Business Performance Analysis Report for Blackfriars Restaurant

Verified

Added on  2023/04/05

|11
|266
|132
Report
AI Summary
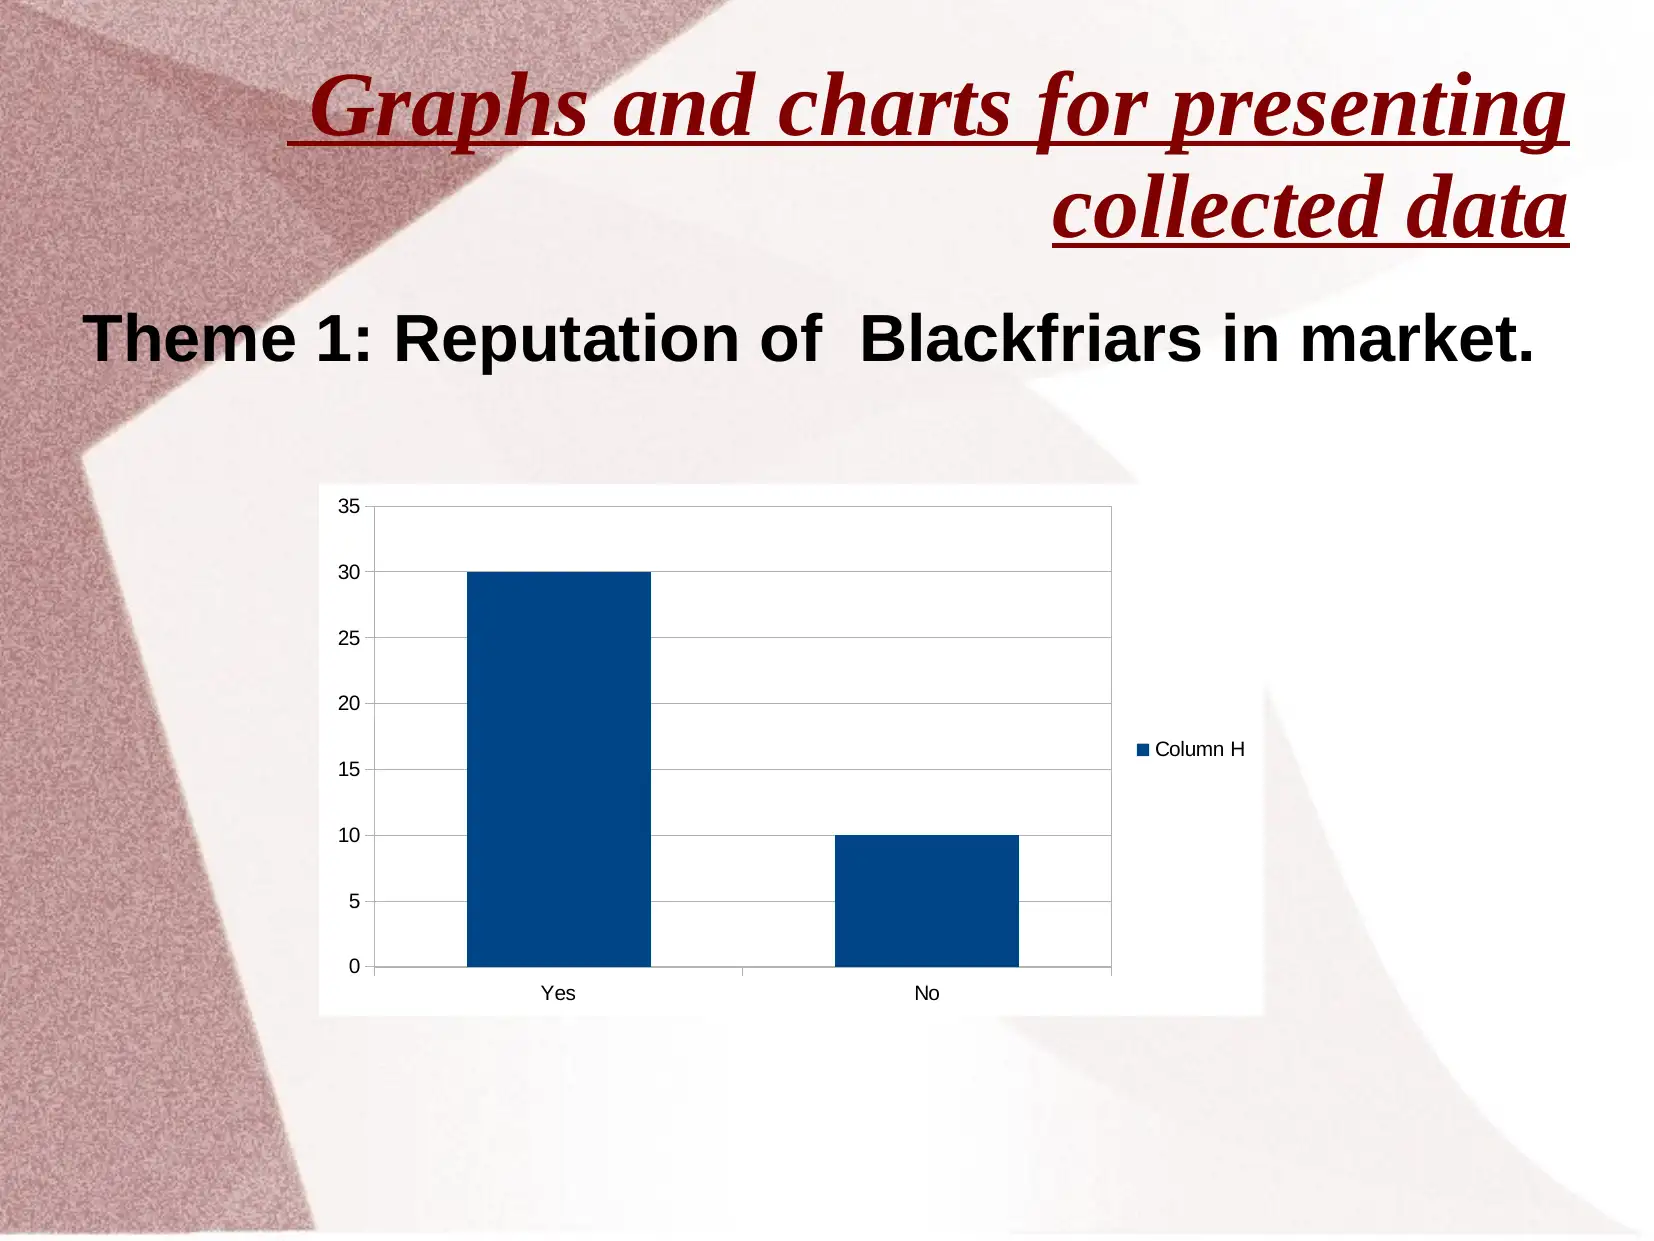
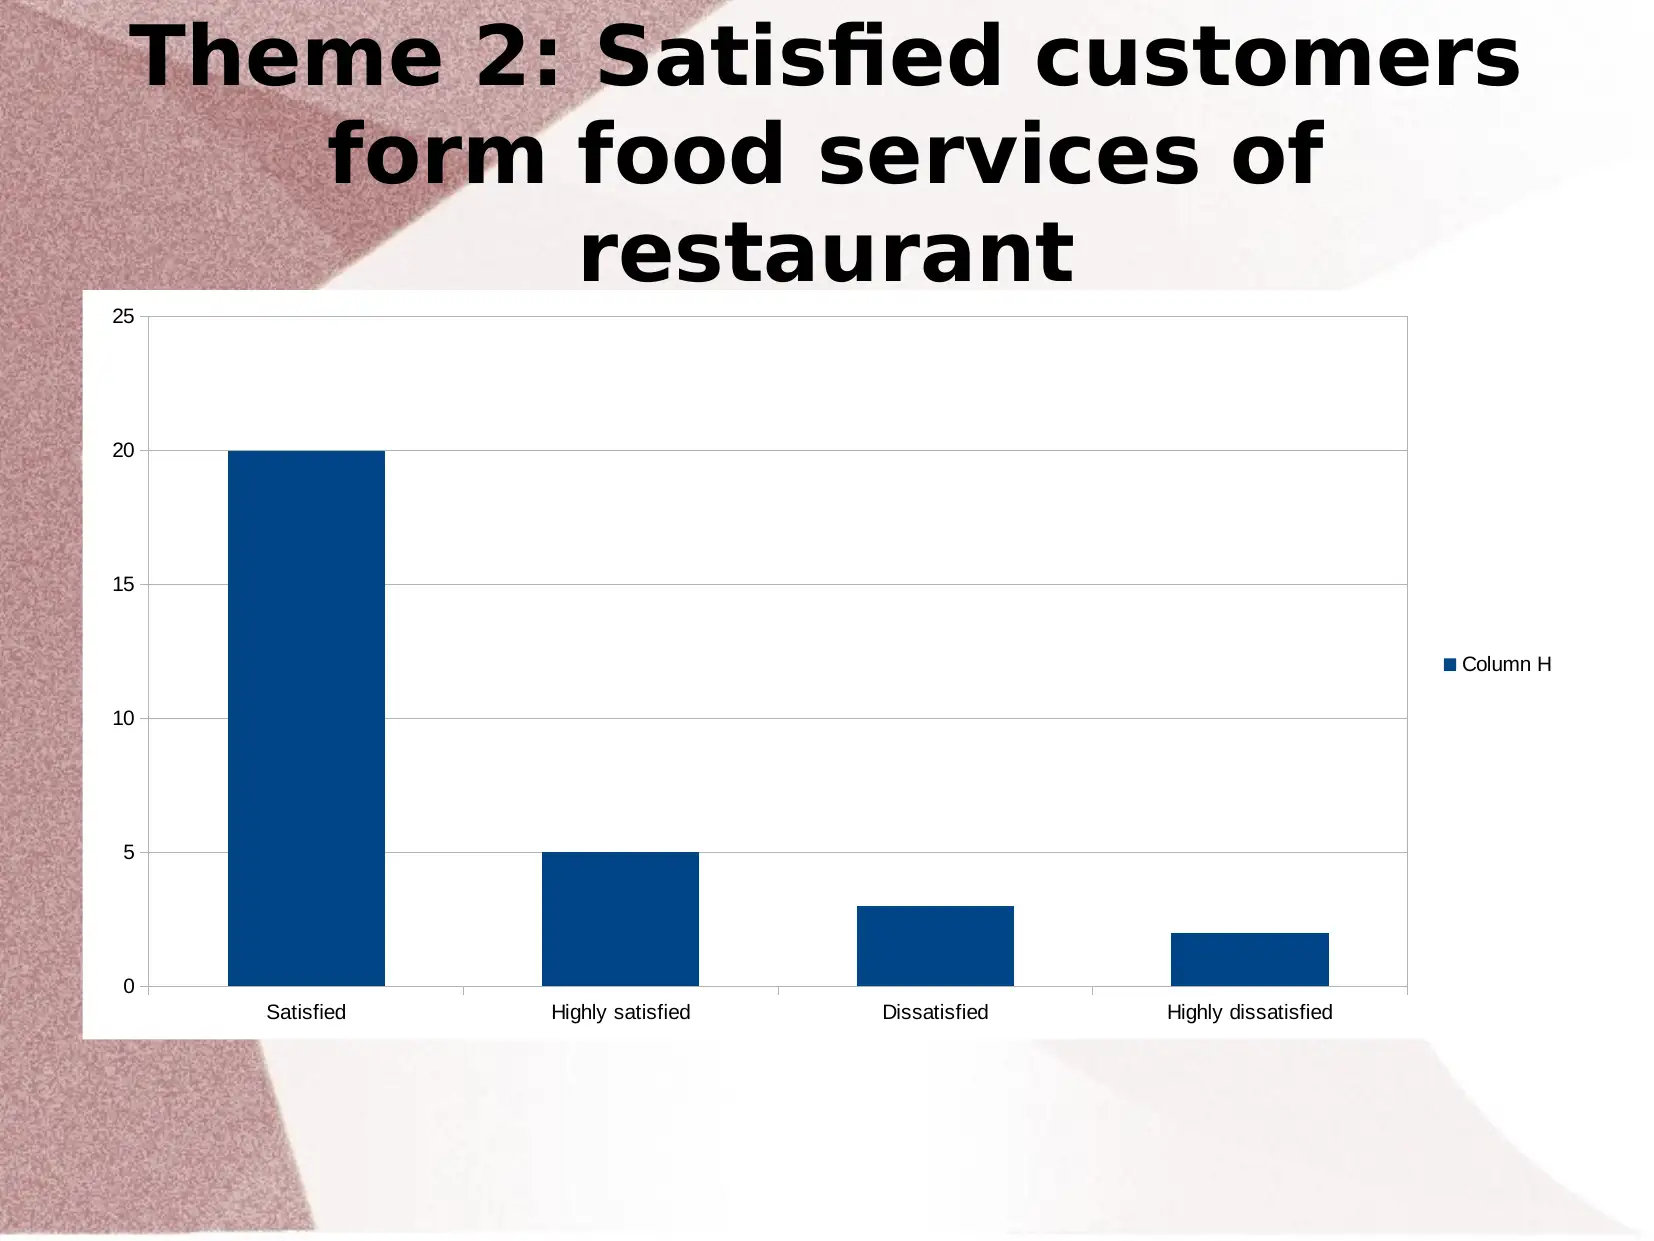
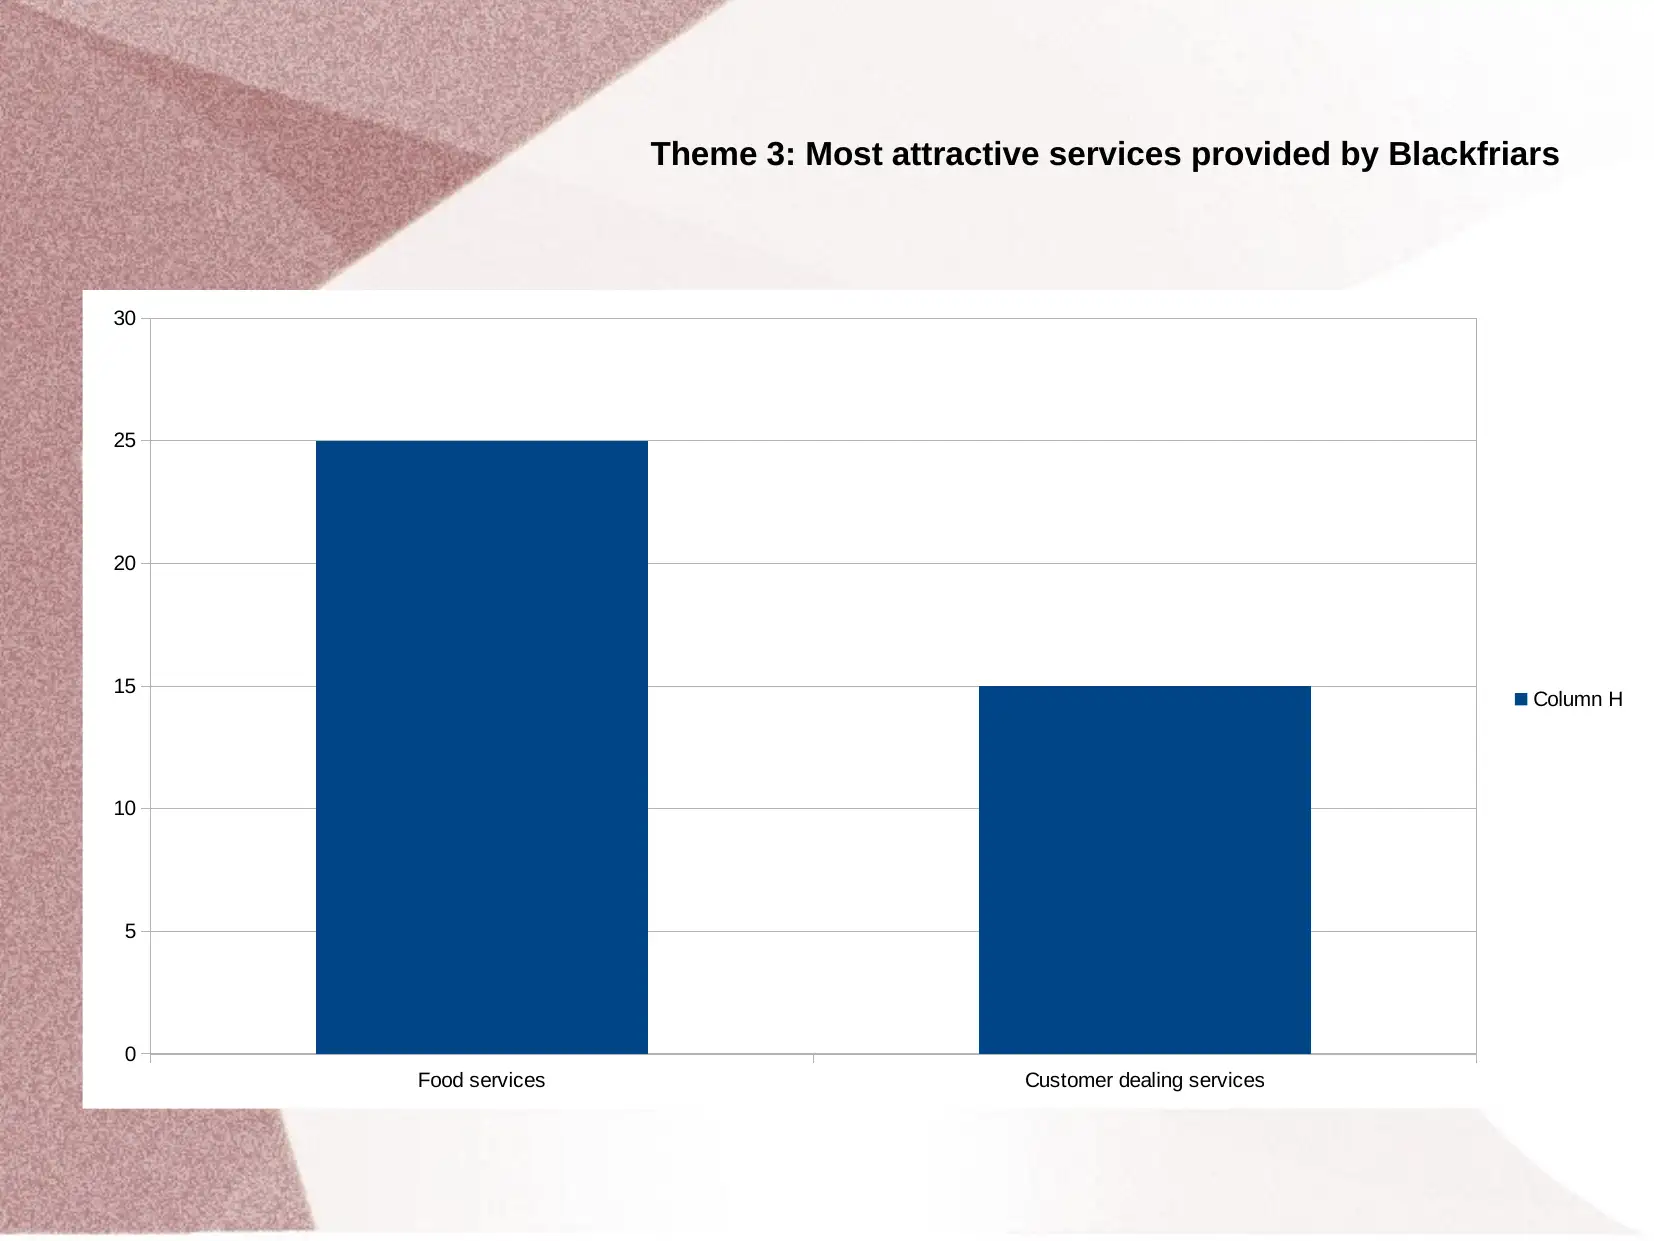
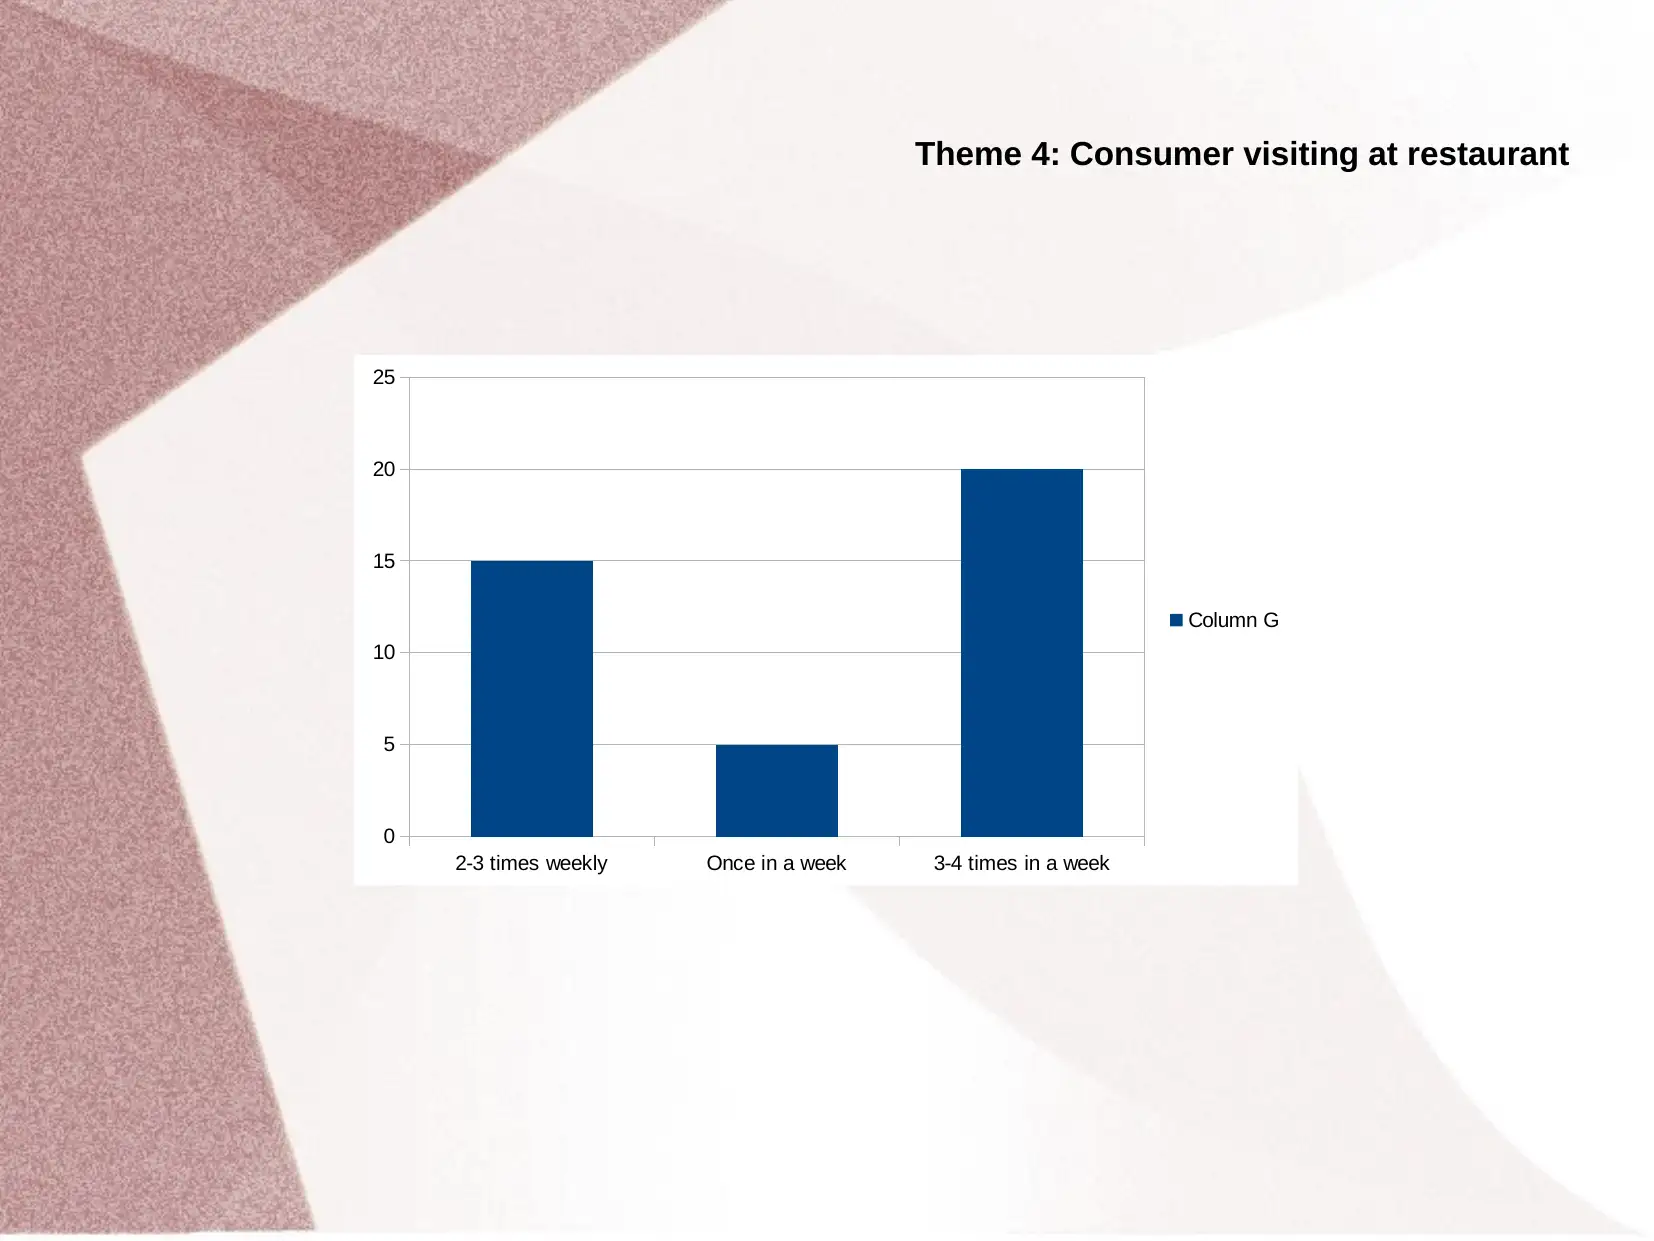
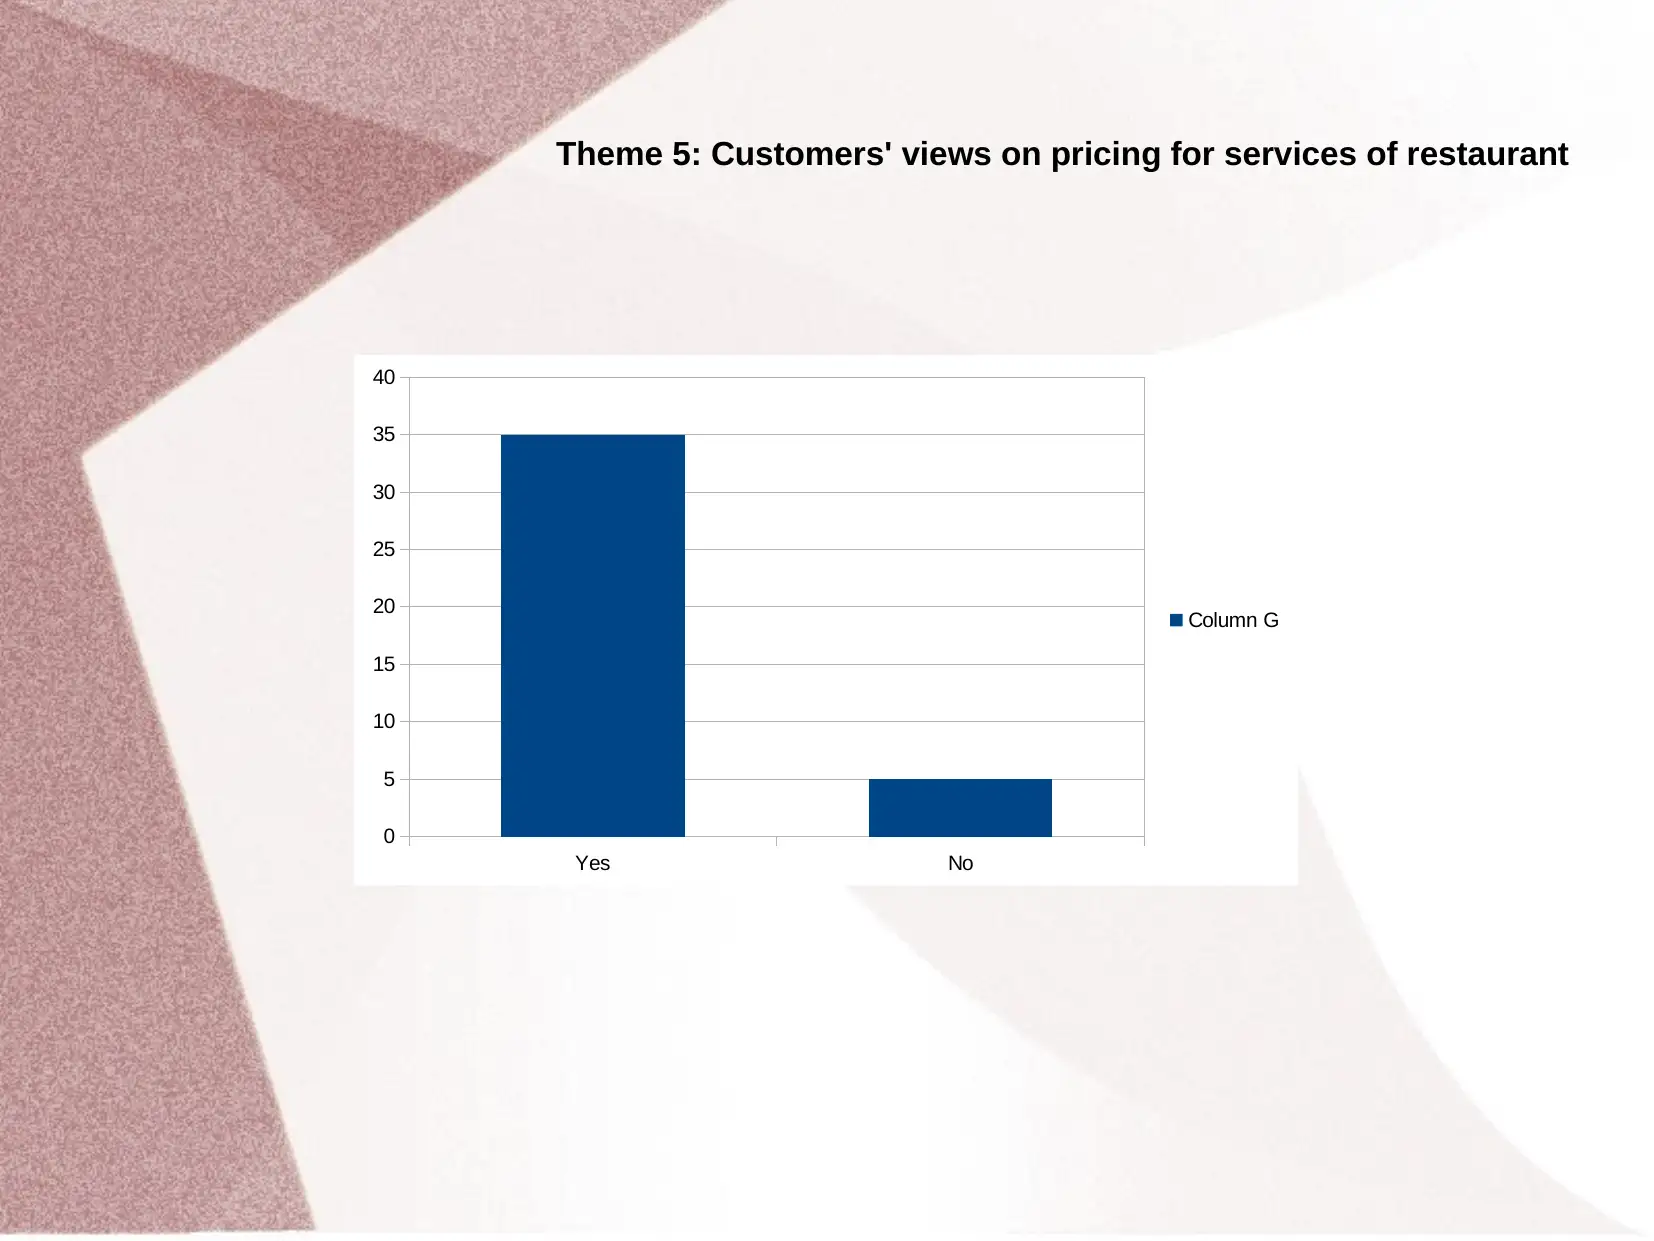
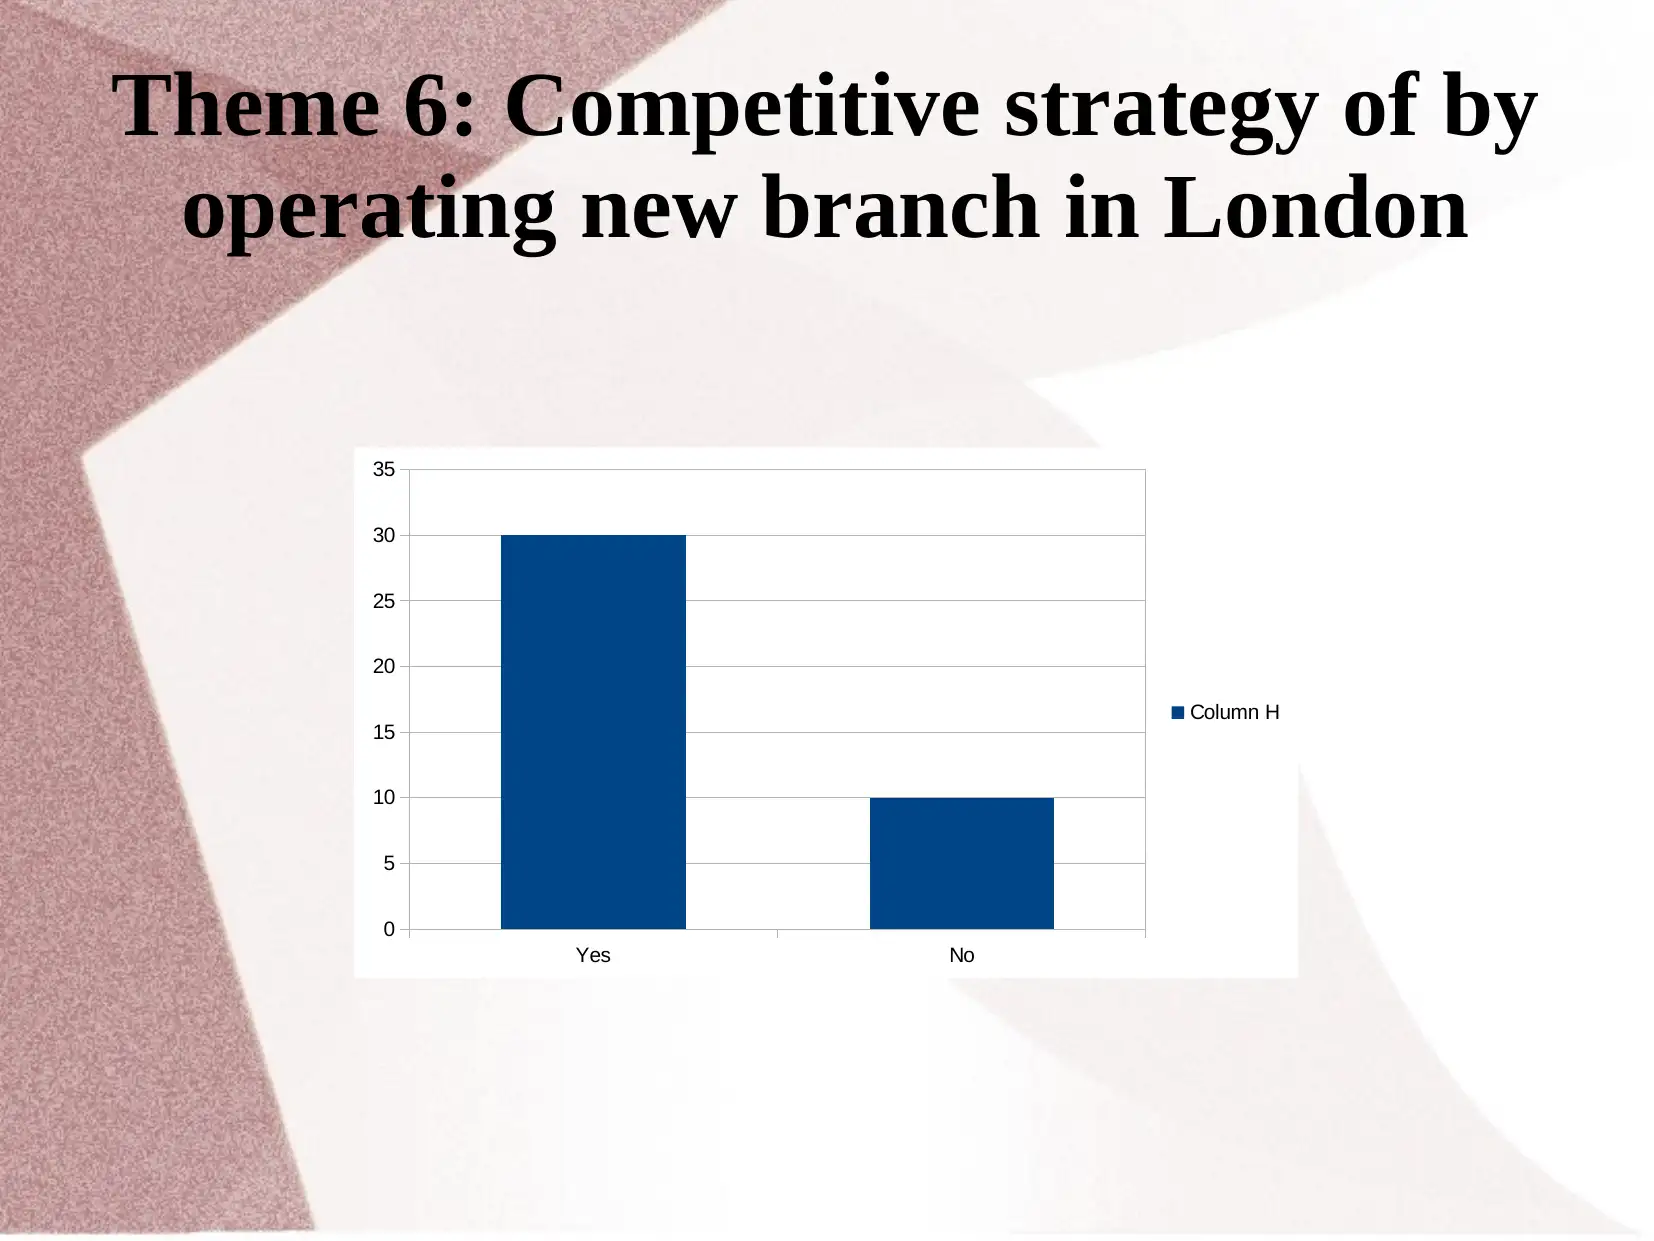
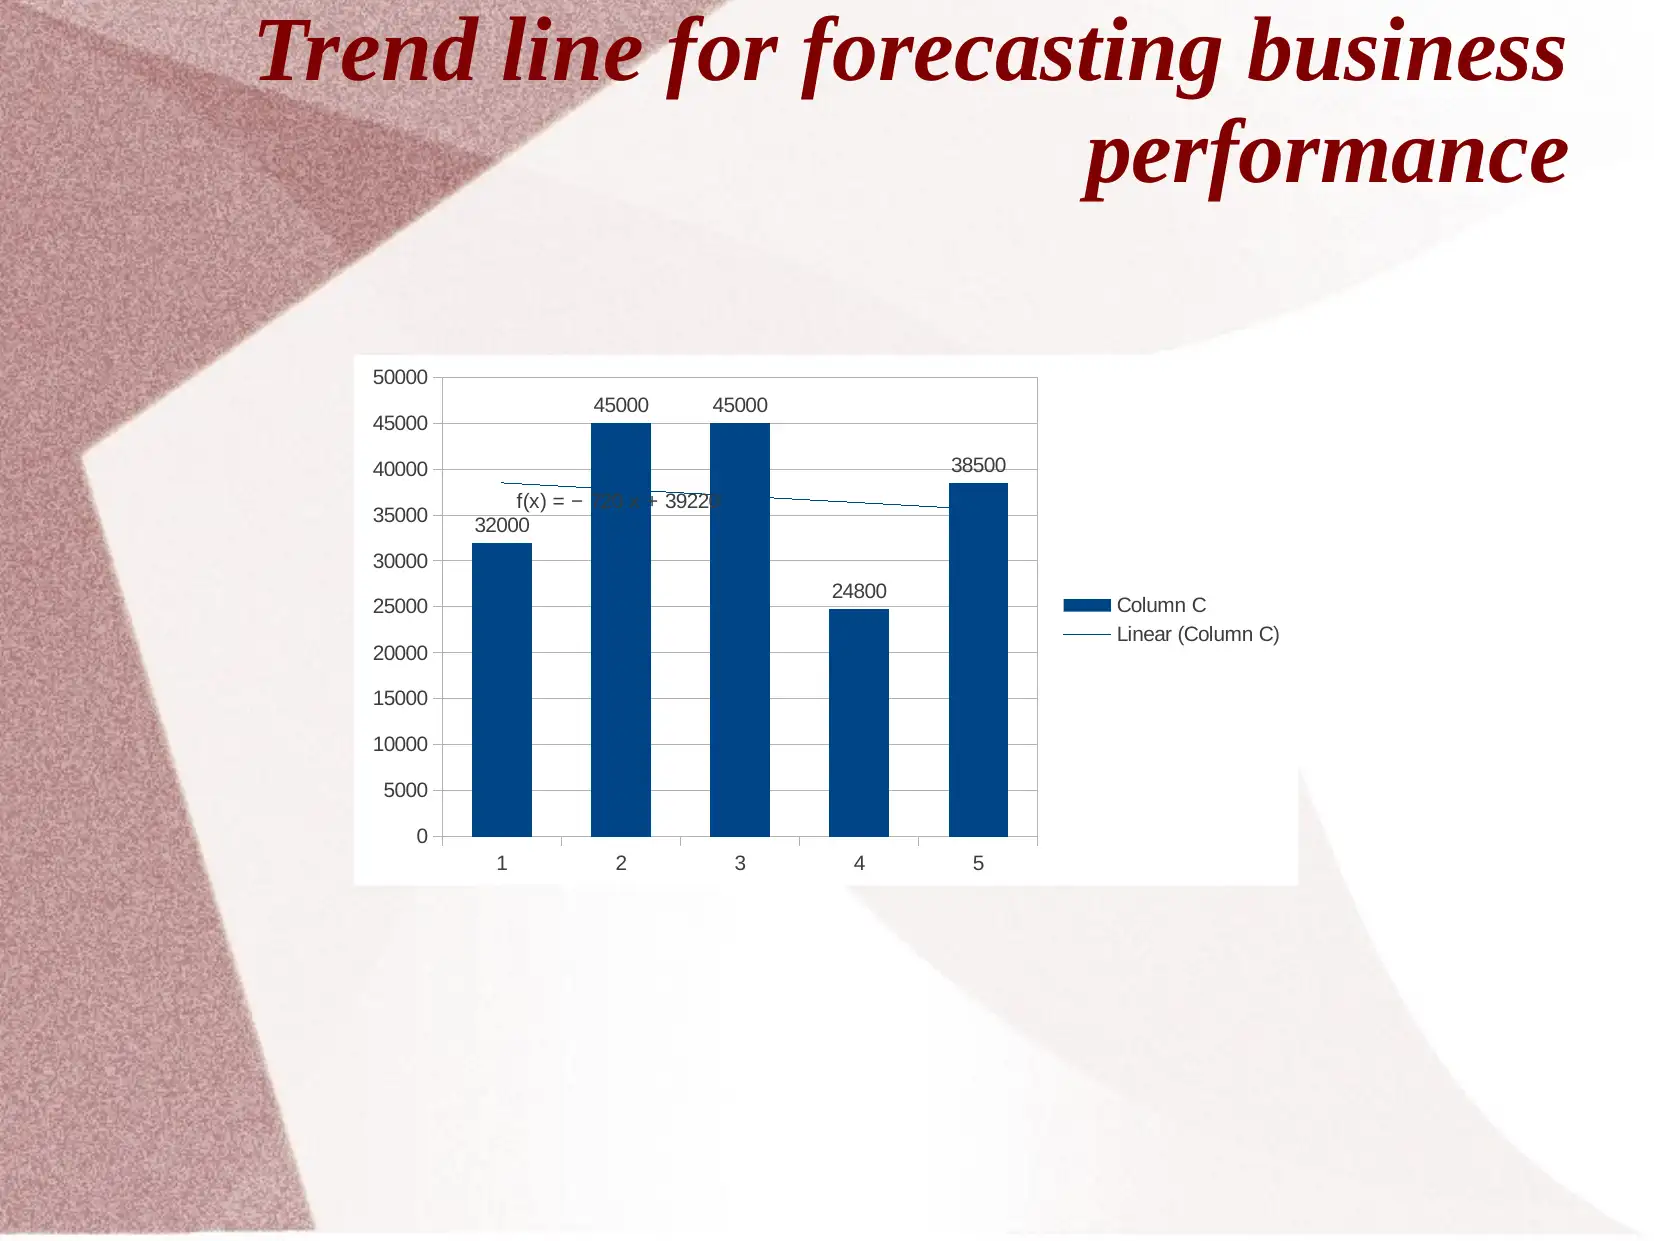
This report presents a business performance analysis for Blackfriars restaurant, utilizing data visualization techniques such as bar graphs and a trend line to illustrate key findings. The analysis covers several themes, including the restaurant's reputation, customer satisfaction with food services, the most attractive services offered, customer visit frequency, customer views on pricing, and the impact of a new branch in London. The report includes a trend line forecasting business performance and references relevant academic papers. The goal is to provide a comprehensive overview of the business's strengths, weaknesses, and potential areas for improvement based on the collected data. The report offers a detailed breakdown of the restaurant's performance, providing valuable insights for decision-making and strategic planning.
Document Page
Business Decision making
tabler-icon-diamond-filled.svg

Paraphrase This Document

Need a fresh take? Get an instant paraphrase of this document with our AI Paraphraser
Document Page
Graphs and charts for presenting
collected data
Theme 1: Reputation of Blackfriars in market.
Yes No
0
5
10
15
20
25
30
35
Column H
Document Page
Theme 2: Satisfied customers
form food services of
restaurant
Satisfied Highly satisfied Dissatisfied Highly dissatisfied
0
5
10
15
20
25
Column H
Document Page
Theme 3: Most attractive services provided by Blackfriars
Food services Customer dealing services
0
5
10
15
20
25
30
Column H
tabler-icon-diamond-filled.svg

Paraphrase This Document

Need a fresh take? Get an instant paraphrase of this document with our AI Paraphraser
Document Page
Theme 4: Consumer visiting at restaurant
2-3 times weekly Once in a week 3-4 times in a week
0
5
10
15
20
25
Column G
Document Page
Theme 5: Customers' views on pricing for services of restaurant
Yes No
0
5
10
15
20
25
30
35
40
Column G
Document Page
Theme 6: Competitive strategy of by
operating new branch in London
Yes No
0
5
10
15
20
25
30
35
Column H
tabler-icon-diamond-filled.svg

Paraphrase This Document

Need a fresh take? Get an instant paraphrase of this document with our AI Paraphraser
Document Page
Trend line for forecasting business
performance
1 2 3 4 5
0
5000
10000
15000
20000
25000
30000
35000
40000
45000
50000
32000
45000 45000
24800
38500
f(x) = − 720 x + 39220
Column C
Linear (Column C)
Document Page
Critical path
Document Page
Cntd.
tabler-icon-diamond-filled.svg

Paraphrase This Document

Need a fresh take? Get an instant paraphrase of this document with our AI Paraphraser
Document Page
Reference
Tang, K.K., Wu, H. and Berto, F., 2015. Fatigue data interpretation of 7075-T6 Al sheets
by energy density factor in a dual scale model. Theoretical and Applied Fracture
Mechanics. 79 pp.98-104.
Togashi, H.F. And et.al., 2015. Morphological and moisture availability controls of the
leaf area‐to‐sapwood area ratio: analysis of measurements on Australian trees.
Ecology and evolution. 5(6). pp.1263-1270.
van I. and et.al., 2013. Advanced instrumentation, data interpretation, and control of
biotechnological processes. Springer Science & Business Media.
chevron_up_icon
1 out of 11
circle_padding
hide_on_mobile
zoom_out_icon
[object Object]