Business Decision Making Report: Analyzing Blackfriars Restaurant Data
VerifiedAdded on 2020/06/04
|21
|4246
|423
Report
AI Summary
This report delves into the business decision-making processes of Blackfriars Restaurant, examining both primary and secondary data collection methods to inform strategic planning. It outlines a comprehensive survey methodology, including questionnaire design and sampling frameworks, to gather insights from customers and stakeholders. The report employs various analytical techniques, such as summarizing data using representative values, measuring results to draw valid conclusions, and assessing dispersion to inform business scenarios. It also utilizes quartile, percentile, and correlation coefficient analyses to derive meaningful conclusions. Furthermore, the report incorporates graphical overviews and analyses using spreadsheets, including the application of trend lines for forecasting. A business presentation and a formal business report are also developed to effectively communicate findings. The project plan for an activity and the critical path are ascertained, and financial tools for decision-making are also discussed, providing a well-rounded analysis of the restaurant's operations and future expansion strategies. The report concludes with recommendations based on the data analysis and strategic planning outlined within.

BUSINESS DECISION
MAKING
MAKING
Paraphrase This Document
Need a fresh take? Get an instant paraphrase of this document with our AI Paraphraser
Table of Contents
INTRODUCTION...........................................................................................................................1
TASK 1............................................................................................................................................1
1.1 Plan for collection of primary and secondary data................................................................1
1.2 Survey methodology and sampling framework....................................................................2
1.3 Questionnaire subjected to business problems......................................................................3
TASK 2............................................................................................................................................5
2.1 Information for decision making by summarising data and use of representative values....5
2.2 Measurement of results to draw valid conclusion.................................................................7
2.3 Measurement of dispersion to with to inform a given business scenario.............................8
2.4 Quartile, Percentile and the correlation coefficient to draw useful conclusion....................9
TASK 3............................................................................................................................................9
3.1 Graphical overview and analysation of with the help of spreadsheet...................................9
3.2 Trend lines in spreadsheet graphs to assist forecasting for business..................................14
3.3 Business presentation with suitable software and technique to circularise information.....15
3.4 Formal Business report.......................................................................................................15
TASK 4..........................................................................................................................................16
4.1 Appropriate information processing tool...........................................................................16
4.2 Project plan for an activity and ascertain the critical path..................................................17
4.3 Financial tools for decision making....................................................................................18
CONCLUSION..............................................................................................................................18
REFERENCES..............................................................................................................................20
INTRODUCTION
Business decision making is a process of forecasting and analysing future events and
situation in respect of business and organisational context (Cosgrove and Rijsberman, 2014). It is
important to provide accurate information and details to analyse the future trends and trend lines.
This is the process which remains effective as per manager’s perspective. This report defines the
source of data form both primary and secondary data. It illustrates a wide range of techniques
which are used to analyse the data effectively and efficiently. Blackfriars Restaurant is the
chosen organisation in present report to elaborate the dimensions of decision making process.
There is relevant information and data collected in respect of the above organisation subjected to
appropriate information in decision making. Use of software generated information and analysis
of results to make decisions and strategies are defined in this context as well.
TASK 1
1.1 Plan for collection of primary and secondary data
Success and growth of an organisation depends upon various factors such as structure,
environment, aim and objectives as well as mission and vision statements (Routledge.Sinha and
Labi, 2011). Business decision making is one of the major aspects which is being used in
organisational context to improve and accelerate the business operations at next level. A well-
structured decision making plan and strategies lead an organisation to sustainable success.
BlackFriars wants to explore the size of business and the structure of further, for this objective
different type of data are collected such as:
Primary data: This type of data is considered as the foremost source of data collection.
Primary data is collected by direct and personal interaction or the research field at work.
Irrelevant information and data remain aside apart from the while collecting the information
from prime sources. Decision making has become more reliable with the information collected
from primary sources.
Research: This method is considered to be more realistic and practical. Clients and
customers get directly communicated subject to issues and problems. The data and information
which is collected in this method is critically analysed and reviewed. There is rank given to the
feedbacks and reviews in respect of problems and subjects. Well structured measurement tools
are used to analyse the thinking of people properly.
1
⊘ This is a preview!⊘
Do you want full access?
Subscribe today to unlock all pages.
Trusted by 1+ million students worldwide
Questionnaire: This is known as a quiz or communication process with multiple options
subjected to questions. In this above scenario, the managers want to restructure and explore
restaurant chain of Blackfriars. Questionnaire submitted to clients and customers all the answers
need to be filled by them for accurate decision making.
Public opinion Polls: This is considered as one of the easiest methods to gain
information and data related to issues and subjects (Tzeng and Huang, 2011). A pooling method
is used with the help of sampling data from cross section. To collecting maximum answers
maximum participation of public is required.
Secondary data: This is one of the cost effective sources of collecting information. Data
and information are taken from applied research and already research subjects. Magazines,
newspapers, past numerical data and information are the main sources used by managers in the
past.
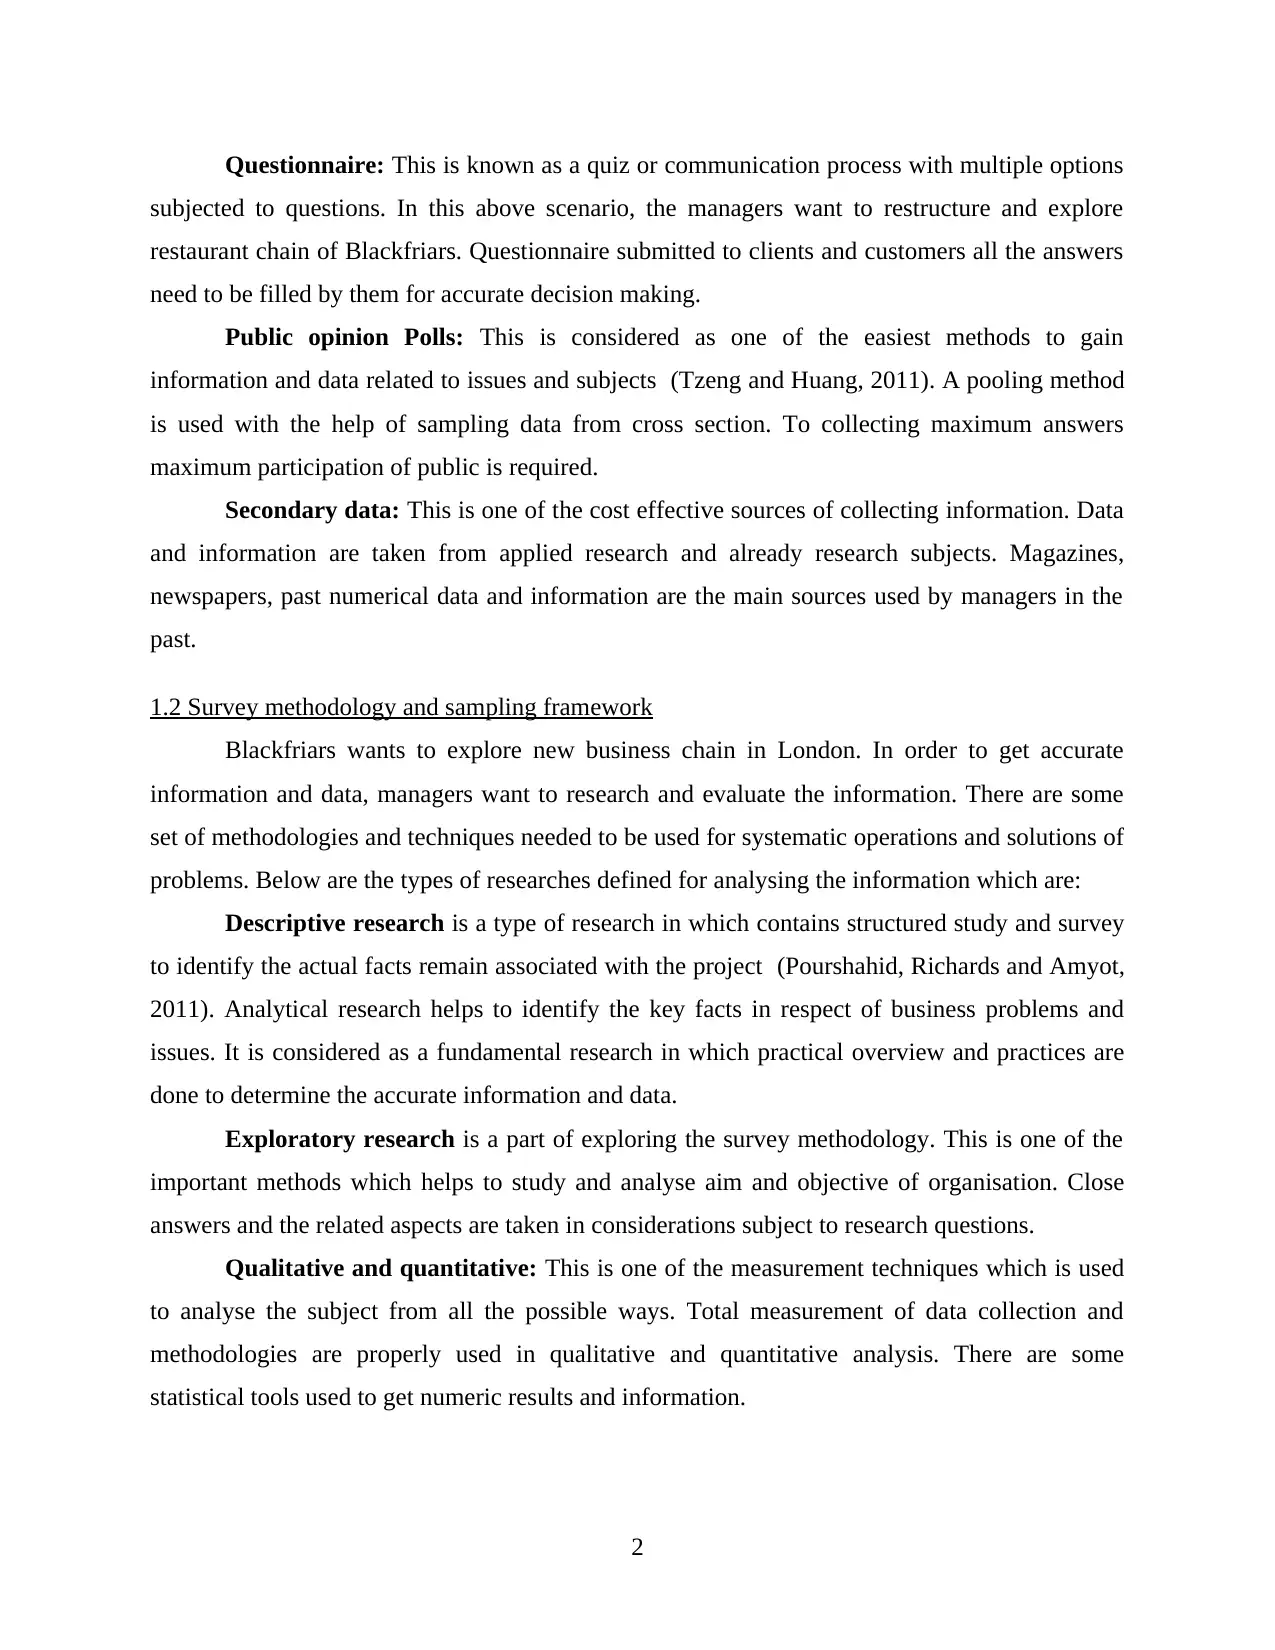
1.2 Survey methodology and sampling framework
Blackfriars wants to explore new business chain in London. In order to get accurate
information and data, managers want to research and evaluate the information. There are some
set of methodologies and techniques needed to be used for systematic operations and solutions of
problems. Below are the types of researches defined for analysing the information which are:
Descriptive research is a type of research in which contains structured study and survey
to identify the actual facts remain associated with the project (Pourshahid, Richards and Amyot,
2011). Analytical research helps to identify the key facts in respect of business problems and
issues. It is considered as a fundamental research in which practical overview and practices are
done to determine the accurate information and data.
Exploratory research is a part of exploring the survey methodology. This is one of the
important methods which helps to study and analyse aim and objective of organisation. Close
answers and the related aspects are taken in considerations subject to research questions.
Qualitative and quantitative: This is one of the measurement techniques which is used
to analyse the subject from all the possible ways. Total measurement of data collection and
methodologies are properly used in qualitative and quantitative analysis. There are some
statistical tools used to get numeric results and information.
2
subjected to questions. In this above scenario, the managers want to restructure and explore
restaurant chain of Blackfriars. Questionnaire submitted to clients and customers all the answers
need to be filled by them for accurate decision making.
Public opinion Polls: This is considered as one of the easiest methods to gain
information and data related to issues and subjects (Tzeng and Huang, 2011). A pooling method
is used with the help of sampling data from cross section. To collecting maximum answers
maximum participation of public is required.
Secondary data: This is one of the cost effective sources of collecting information. Data
and information are taken from applied research and already research subjects. Magazines,
newspapers, past numerical data and information are the main sources used by managers in the
past.
1.2 Survey methodology and sampling framework
Blackfriars wants to explore new business chain in London. In order to get accurate
information and data, managers want to research and evaluate the information. There are some
set of methodologies and techniques needed to be used for systematic operations and solutions of
problems. Below are the types of researches defined for analysing the information which are:
Descriptive research is a type of research in which contains structured study and survey
to identify the actual facts remain associated with the project (Pourshahid, Richards and Amyot,
2011). Analytical research helps to identify the key facts in respect of business problems and
issues. It is considered as a fundamental research in which practical overview and practices are
done to determine the accurate information and data.
Exploratory research is a part of exploring the survey methodology. This is one of the
important methods which helps to study and analyse aim and objective of organisation. Close
answers and the related aspects are taken in considerations subject to research questions.
Qualitative and quantitative: This is one of the measurement techniques which is used
to analyse the subject from all the possible ways. Total measurement of data collection and
methodologies are properly used in qualitative and quantitative analysis. There are some
statistical tools used to get numeric results and information.
2
Paraphrase This Document
Need a fresh take? Get an instant paraphrase of this document with our AI Paraphraser
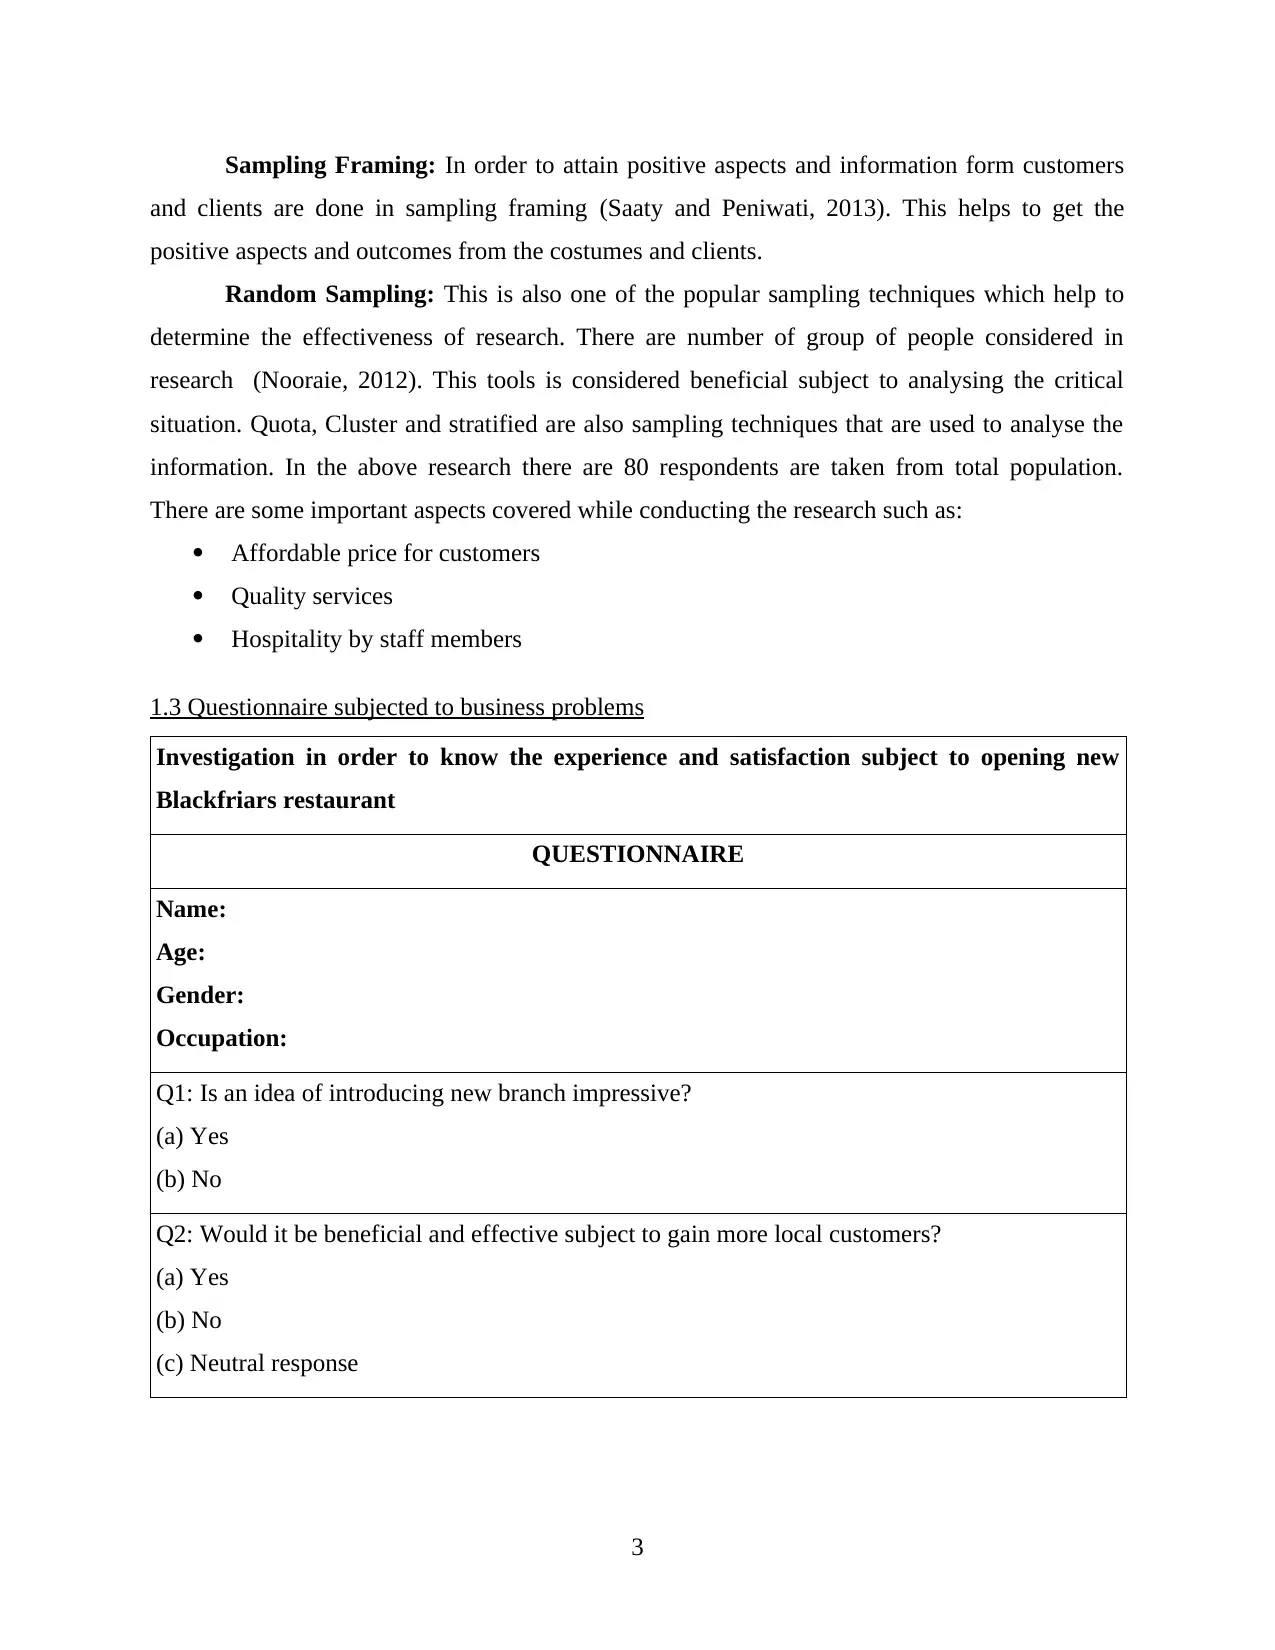
Sampling Framing: In order to attain positive aspects and information form customers
and clients are done in sampling framing (Saaty and Peniwati, 2013). This helps to get the
positive aspects and outcomes from the costumes and clients.
Random Sampling: This is also one of the popular sampling techniques which help to
determine the effectiveness of research. There are number of group of people considered in
research (Nooraie, 2012). This tools is considered beneficial subject to analysing the critical
situation. Quota, Cluster and stratified are also sampling techniques that are used to analyse the
information. In the above research there are 80 respondents are taken from total population.
There are some important aspects covered while conducting the research such as:
Affordable price for customers
Quality services
Hospitality by staff members
1.3 Questionnaire subjected to business problems
Investigation in order to know the experience and satisfaction subject to opening new
Blackfriars restaurant
QUESTIONNAIRE
Name:
Age:
Gender:
Occupation:
Q1: Is an idea of introducing new branch impressive?
(a) Yes
(b) No
Q2: Would it be beneficial and effective subject to gain more local customers?
(a) Yes
(b) No
(c) Neutral response
3
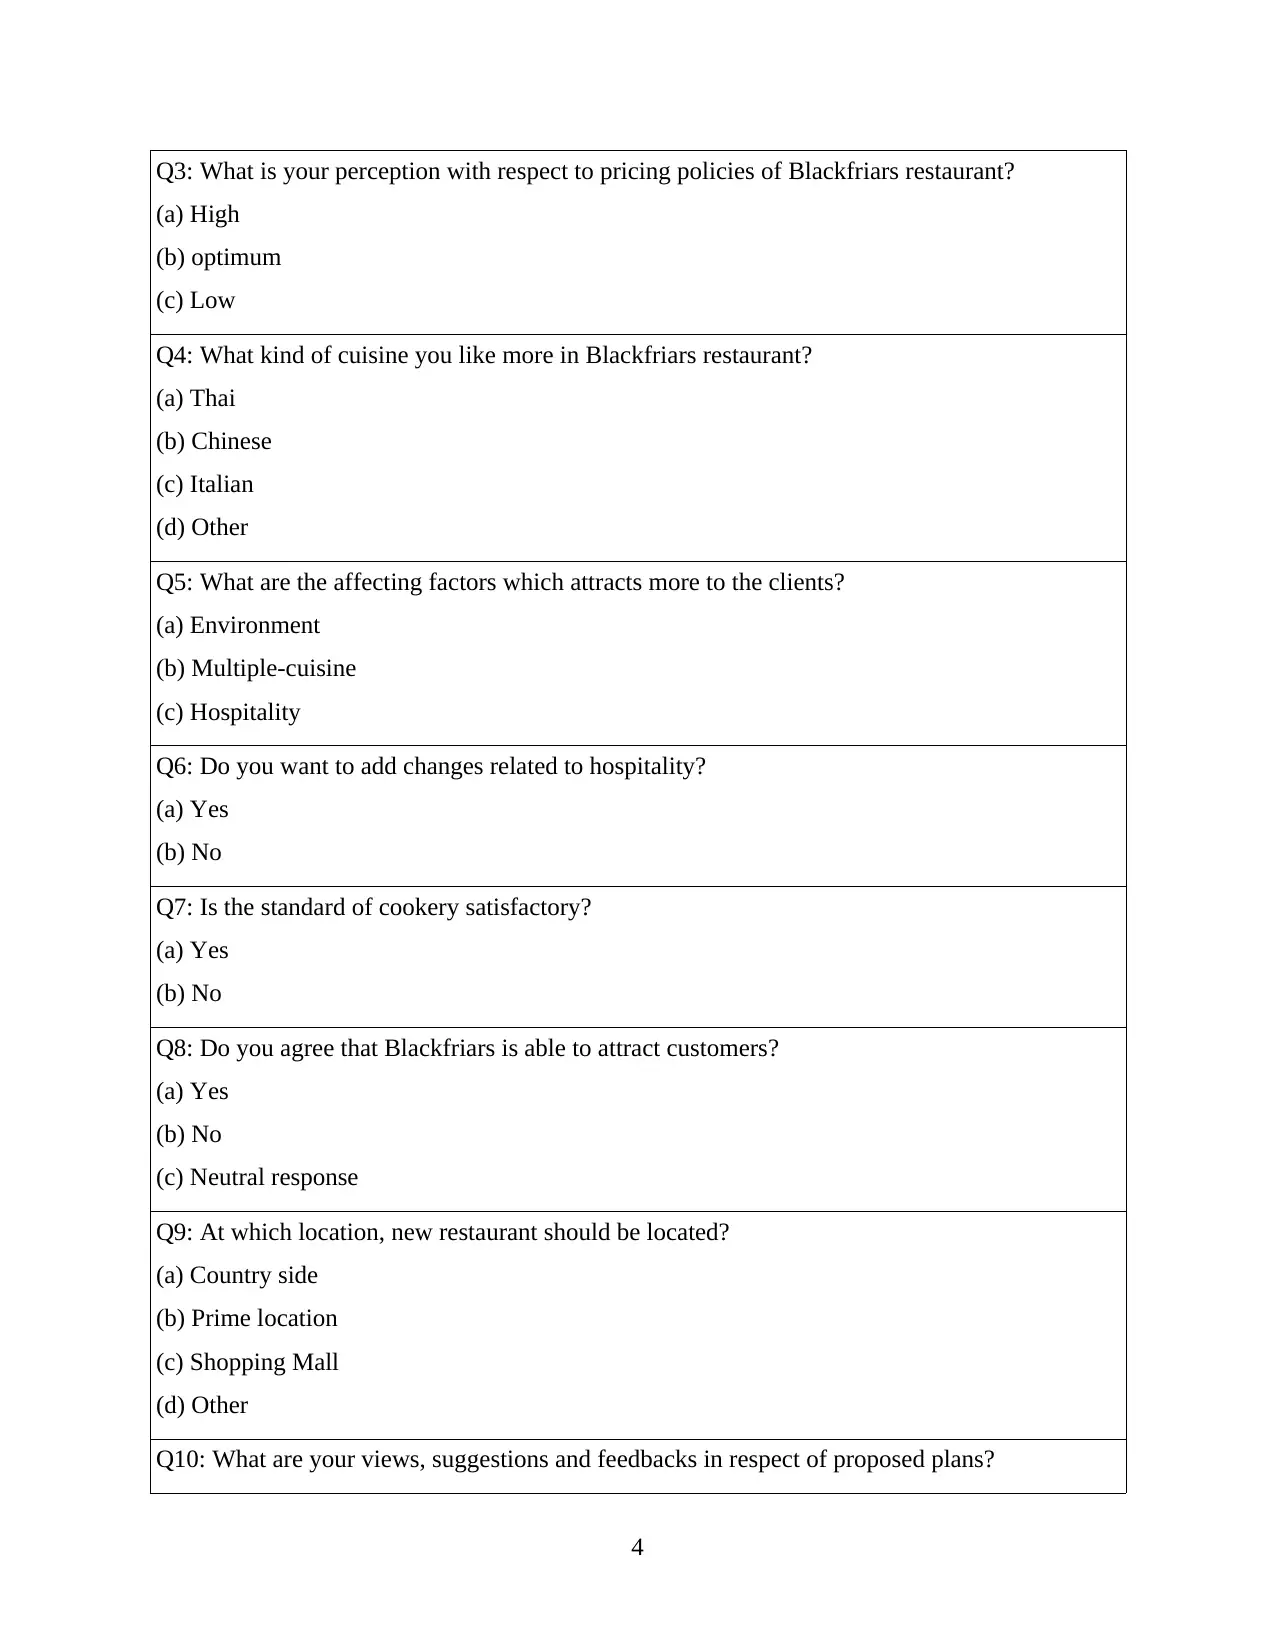
Q3: What is your perception with respect to pricing policies of Blackfriars restaurant?
(a) High
(b) optimum
(c) Low
Q4: What kind of cuisine you like more in Blackfriars restaurant?
(a) Thai
(b) Chinese
(c) Italian
(d) Other
Q5: What are the affecting factors which attracts more to the clients?
(a) Environment
(b) Multiple-cuisine
(c) Hospitality
Q6: Do you want to add changes related to hospitality?
(a) Yes
(b) No
Q7: Is the standard of cookery satisfactory?
(a) Yes
(b) No
Q8: Do you agree that Blackfriars is able to attract customers?
(a) Yes
(b) No
(c) Neutral response
Q9: At which location, new restaurant should be located?
(a) Country side
(b) Prime location
(c) Shopping Mall
(d) Other
Q10: What are your views, suggestions and feedbacks in respect of proposed plans?
4
⊘ This is a preview!⊘
Do you want full access?
Subscribe today to unlock all pages.
Trusted by 1+ million students worldwide
Ans.
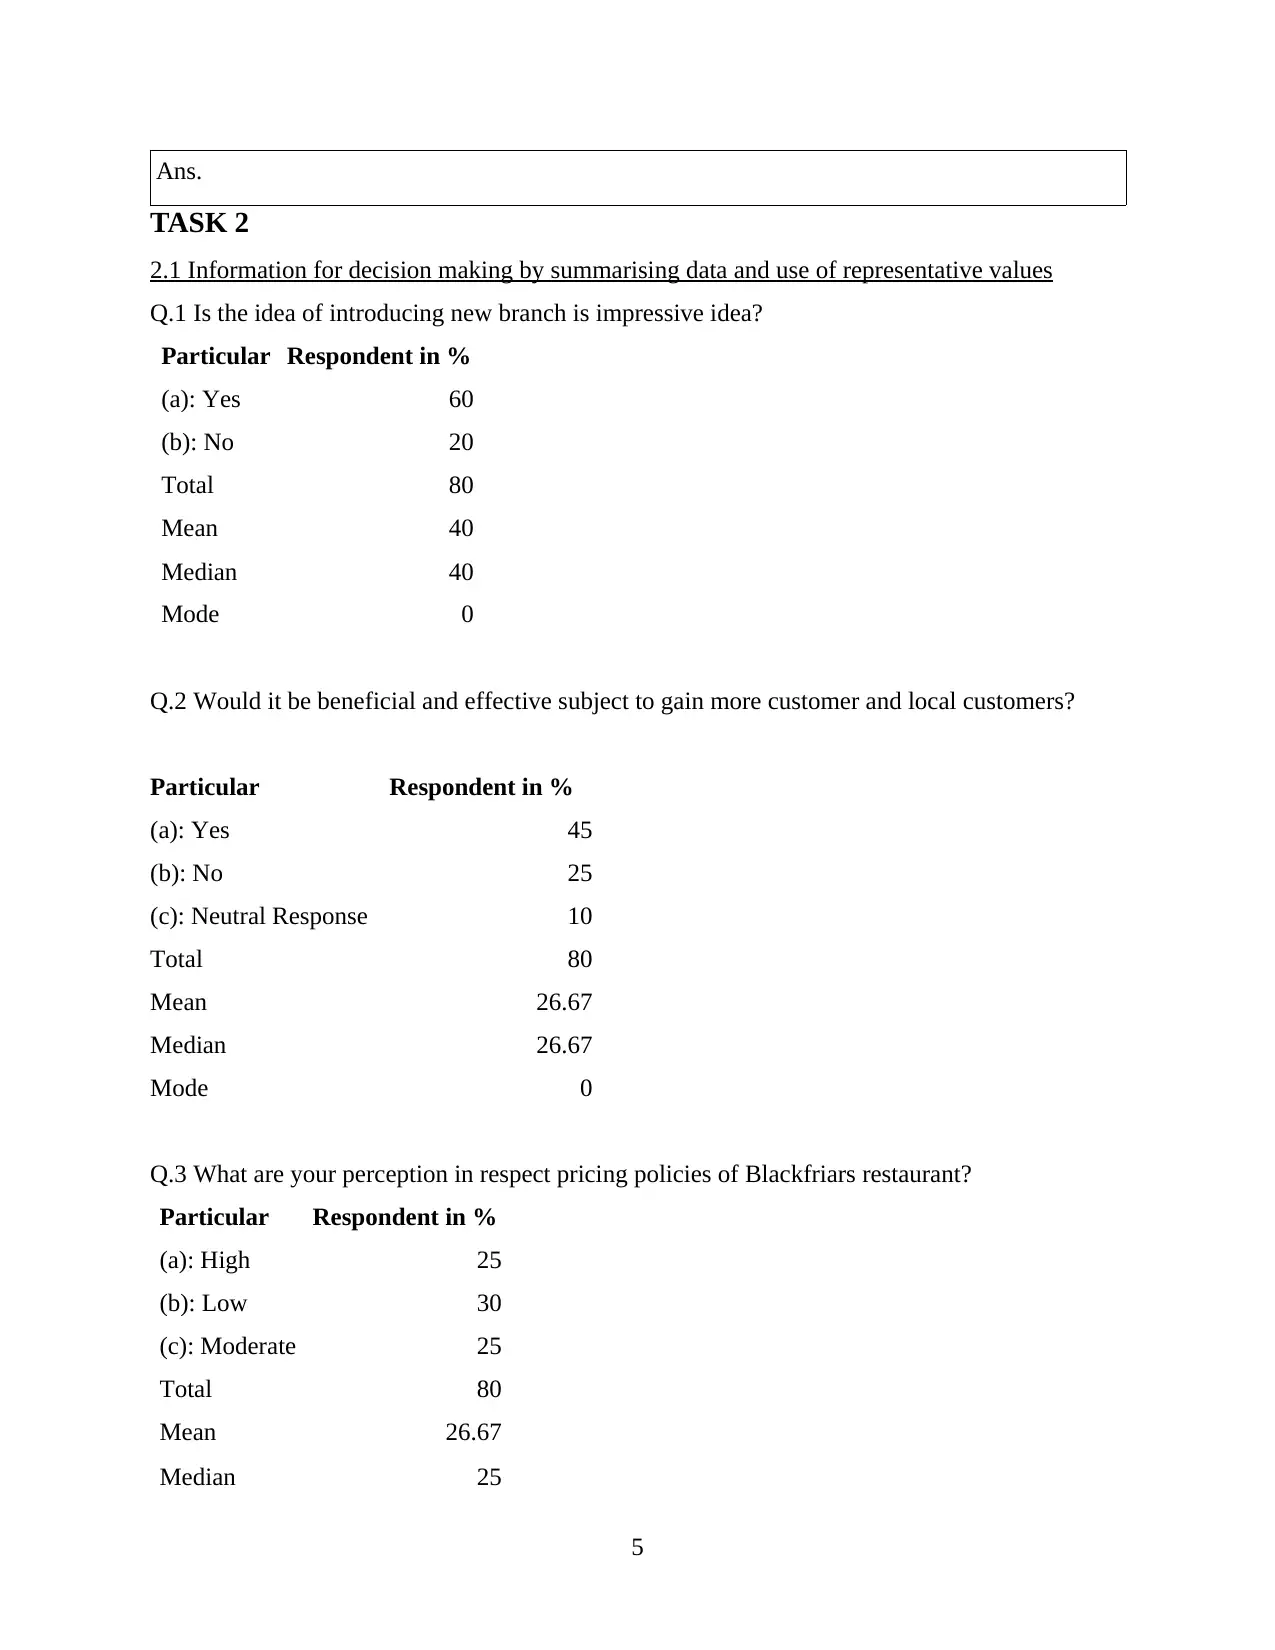
TASK 2
2.1 Information for decision making by summarising data and use of representative values
Q.1 Is the idea of introducing new branch is impressive idea?
Particular Respondent in %
(a): Yes 60
(b): No 20
Total 80
Mean 40
Median 40
Mode 0
Q.2 Would it be beneficial and effective subject to gain more customer and local customers?
Particular Respondent in %
(a): Yes 45
(b): No 25
(c): Neutral Response 10
Total 80
Mean 26.67
Median 26.67
Mode 0
Q.3 What are your perception in respect pricing policies of Blackfriars restaurant?
Particular Respondent in %
(a): High 25
(b): Low 30
(c): Moderate 25
Total 80
Mean 26.67
Median 25
5
Paraphrase This Document
Need a fresh take? Get an instant paraphrase of this document with our AI Paraphraser
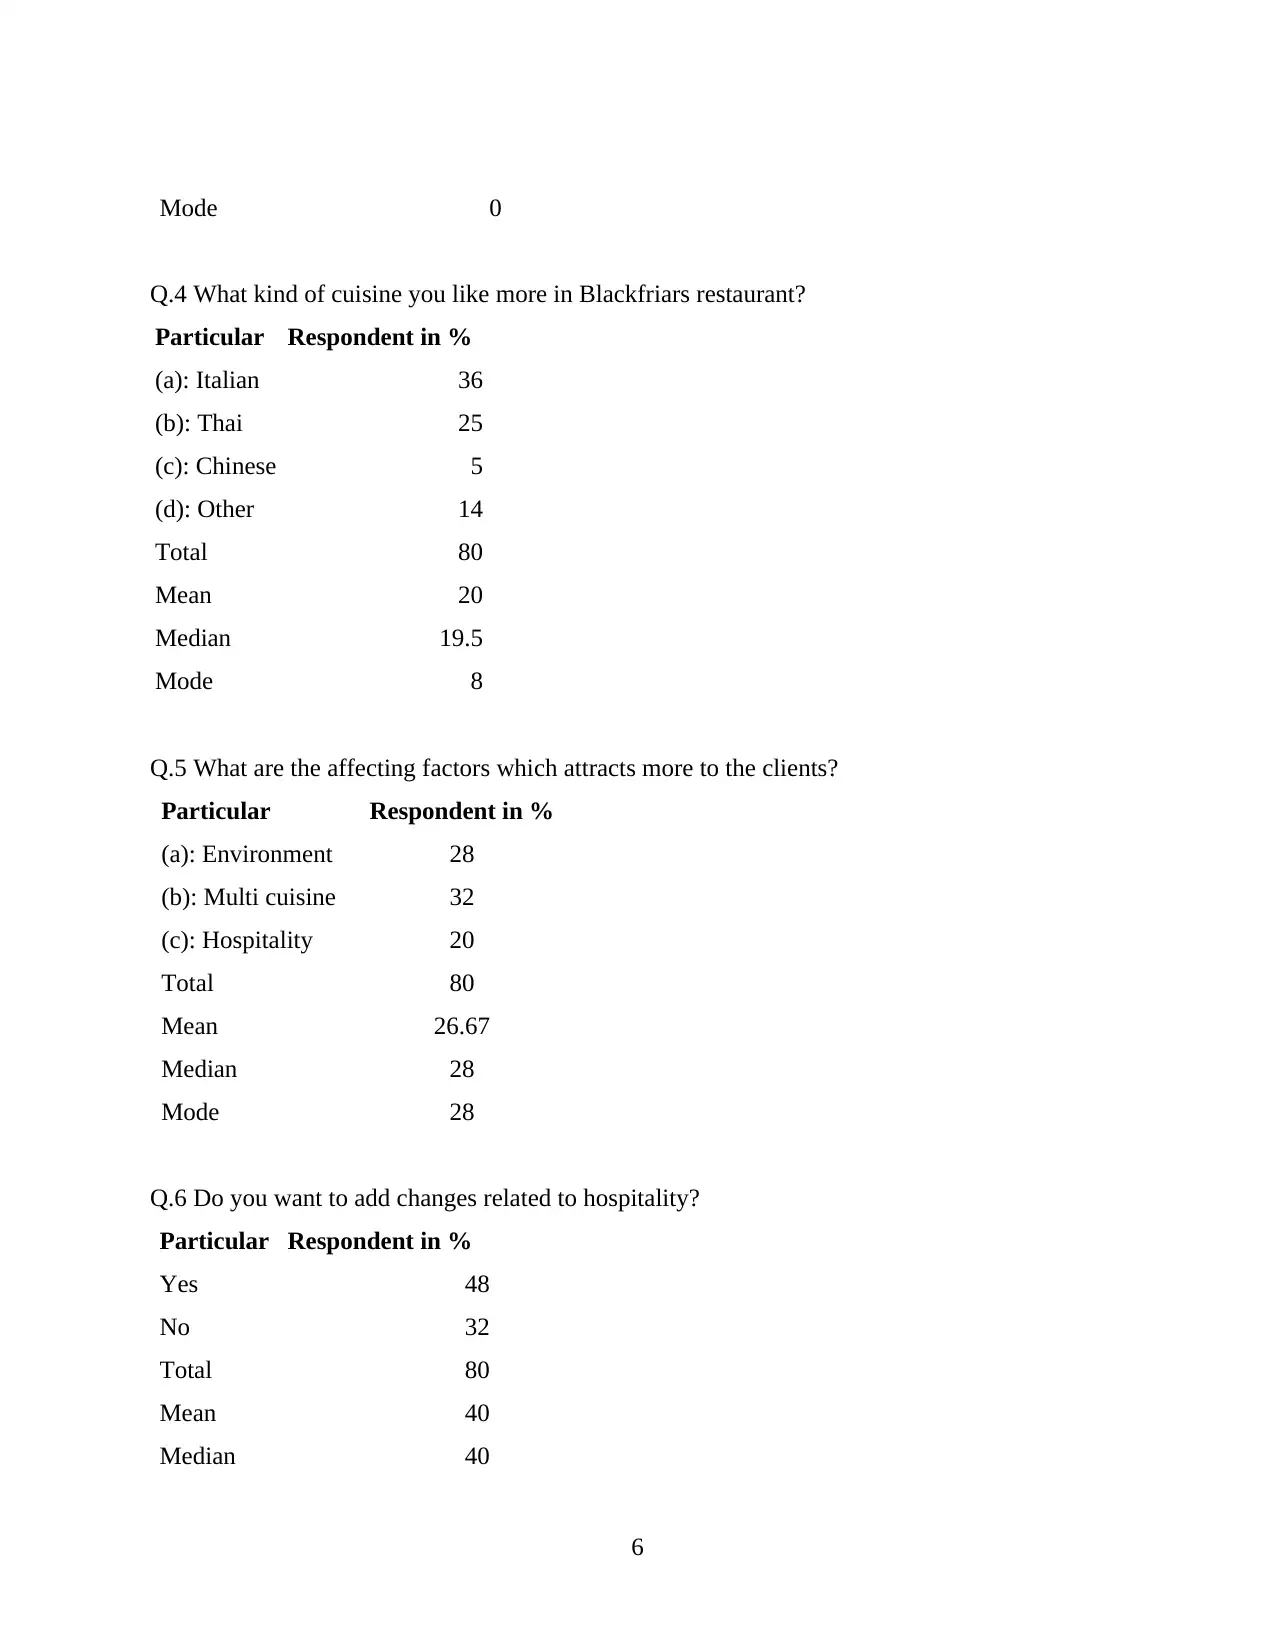
Mode 0
Q.4 What kind of cuisine you like more in Blackfriars restaurant?
Particular Respondent in %
(a): Italian 36
(b): Thai 25
(c): Chinese 5
(d): Other 14
Total 80
Mean 20
Median 19.5
Mode 8
Q.5 What are the affecting factors which attracts more to the clients?
Particular Respondent in %
(a): Environment 28
(b): Multi cuisine 32
(c): Hospitality 20
Total 80
Mean 26.67
Median 28
Mode 28
Q.6 Do you want to add changes related to hospitality?
Particular Respondent in %
Yes 48
No 32
Total 80
Mean 40
Median 40
6
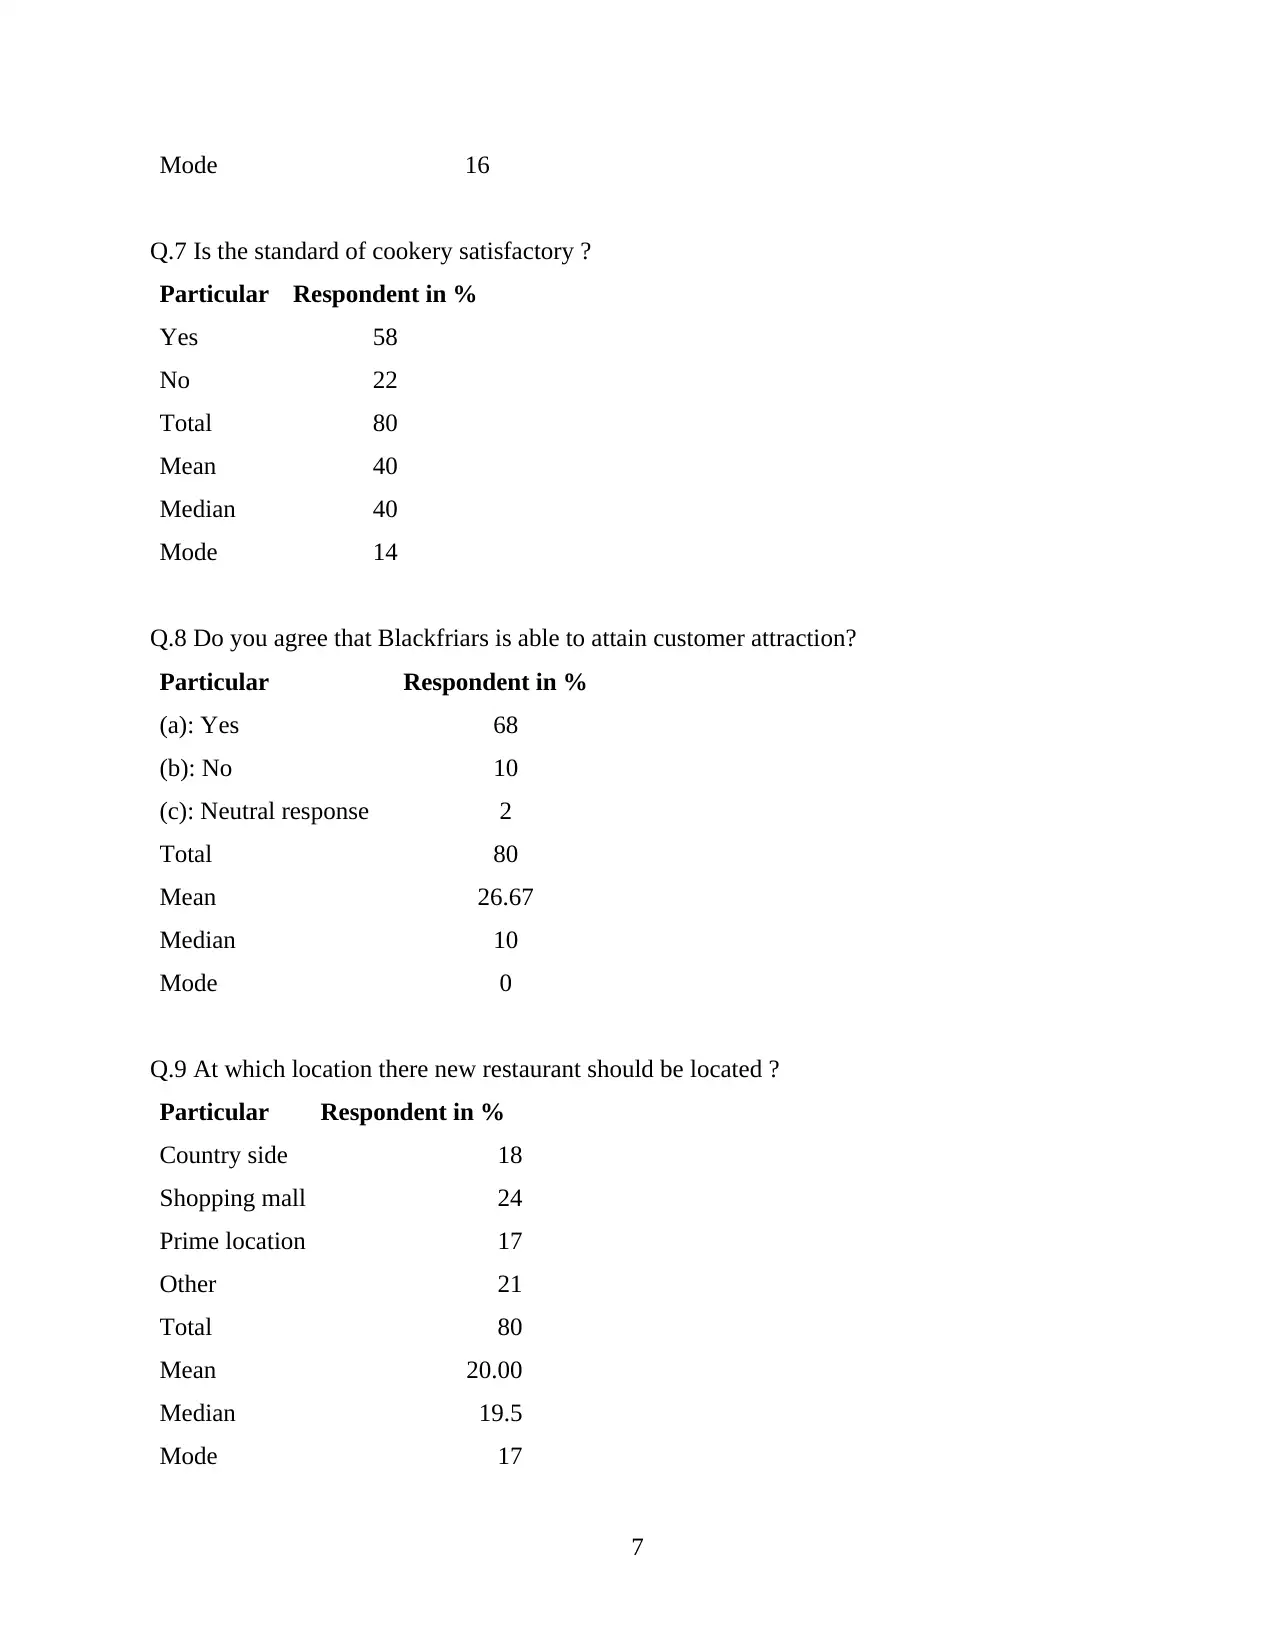
Mode 16
Q.7 Is the standard of cookery satisfactory ?
Particular Respondent in %
Yes 58
No 22
Total 80
Mean 40
Median 40
Mode 14
Q.8 Do you agree that Blackfriars is able to attain customer attraction?
Particular Respondent in %
(a): Yes 68
(b): No 10
(c): Neutral response 2
Total 80
Mean 26.67
Median 10
Mode 0
Q.9 At which location there new restaurant should be located ?
Particular Respondent in %
Country side 18
Shopping mall 24
Prime location 17
Other 21
Total 80
Mean 20.00
Median 19.5
Mode 17
7
⊘ This is a preview!⊘
Do you want full access?
Subscribe today to unlock all pages.
Trusted by 1+ million students worldwide
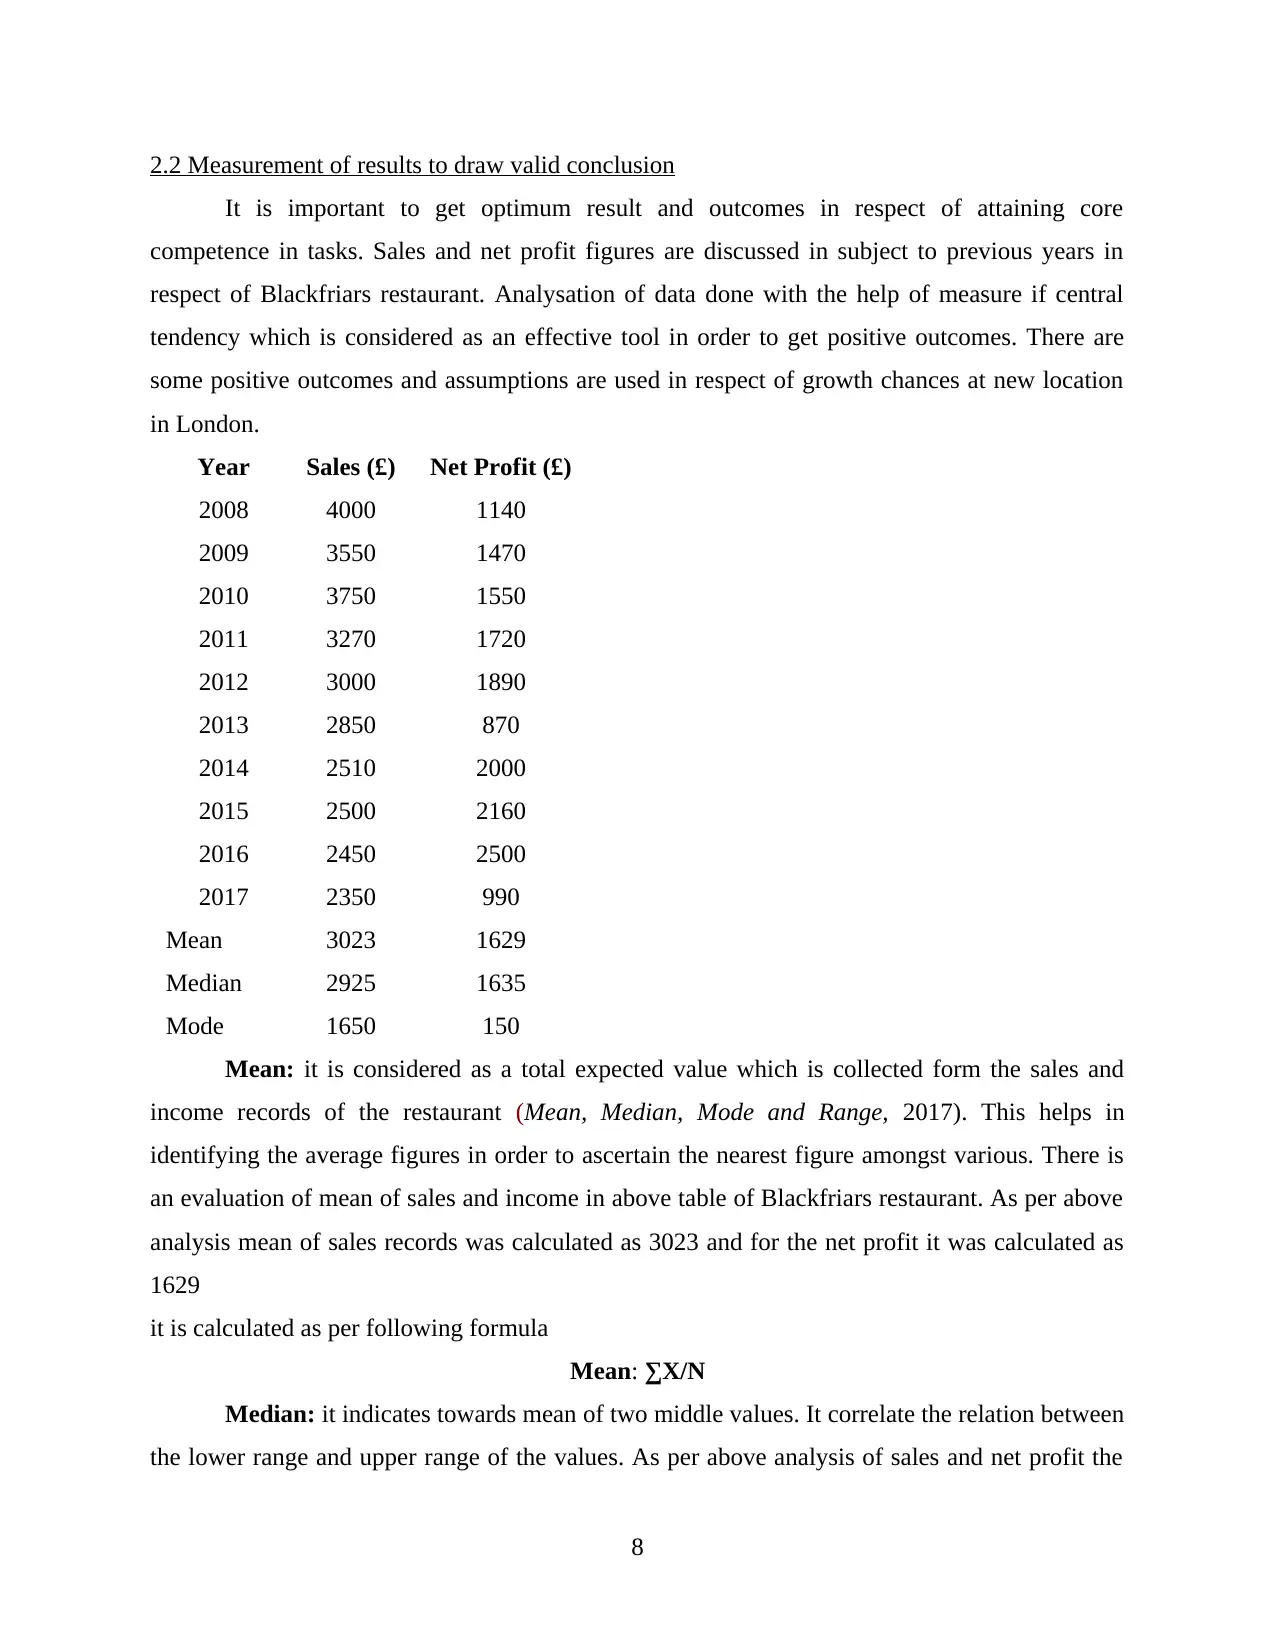
2.2 Measurement of results to draw valid conclusion
It is important to get optimum result and outcomes in respect of attaining core
competence in tasks. Sales and net profit figures are discussed in subject to previous years in
respect of Blackfriars restaurant. Analysation of data done with the help of measure if central
tendency which is considered as an effective tool in order to get positive outcomes. There are
some positive outcomes and assumptions are used in respect of growth chances at new location
in London.
Year Sales (£) Net Profit (£)
2008 4000 1140
2009 3550 1470
2010 3750 1550
2011 3270 1720
2012 3000 1890
2013 2850 870
2014 2510 2000
2015 2500 2160
2016 2450 2500
2017 2350 990
Mean 3023 1629
Median 2925 1635
Mode 1650 150
Mean: it is considered as a total expected value which is collected form the sales and
income records of the restaurant (Mean, Median, Mode and Range, 2017). This helps in
identifying the average figures in order to ascertain the nearest figure amongst various. There is
an evaluation of mean of sales and income in above table of Blackfriars restaurant. As per above
analysis mean of sales records was calculated as 3023 and for the net profit it was calculated as
1629
it is calculated as per following formula
Mean: ∑X/N
Median: it indicates towards mean of two middle values. It correlate the relation between
the lower range and upper range of the values. As per above analysis of sales and net profit the
8
Paraphrase This Document
Need a fresh take? Get an instant paraphrase of this document with our AI Paraphraser
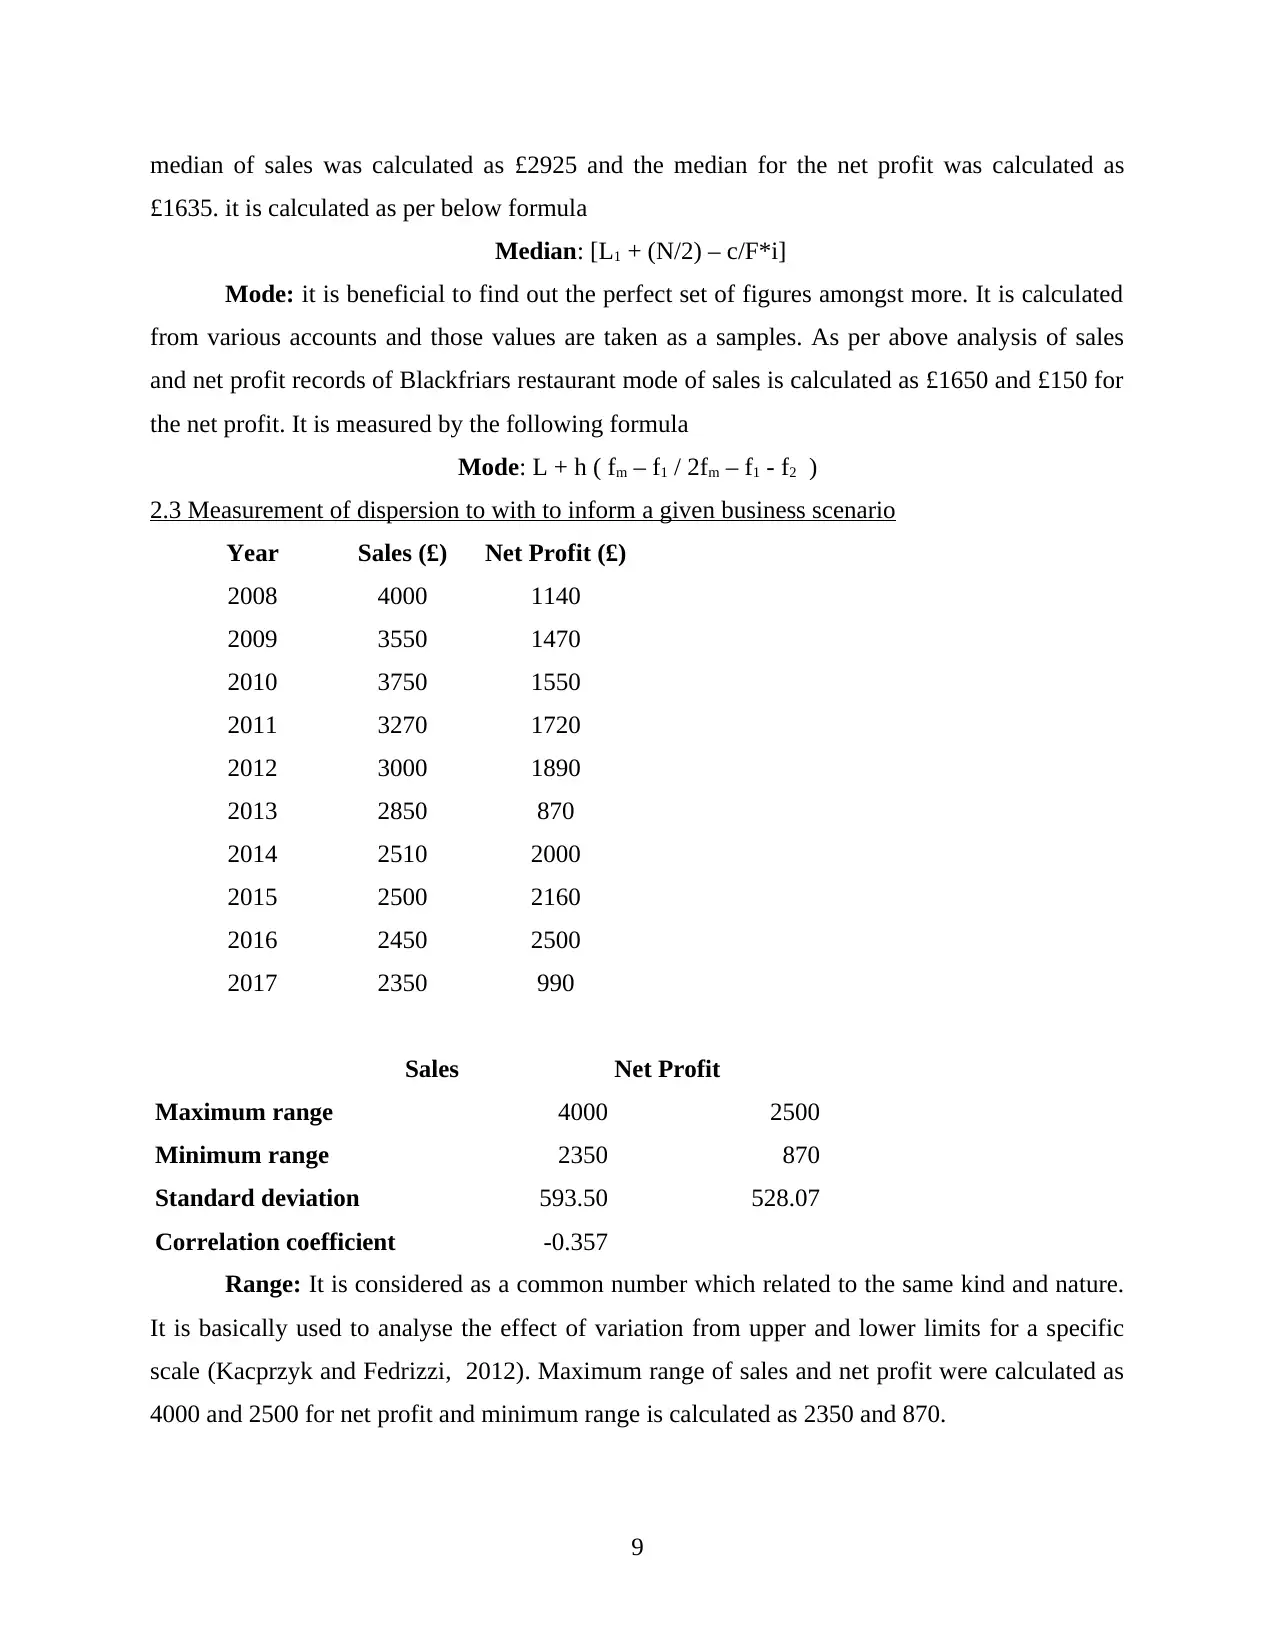
median of sales was calculated as £2925 and the median for the net profit was calculated as
£1635. it is calculated as per below formula
Median: [L1 + (N/2) – c/F*i]
Mode: it is beneficial to find out the perfect set of figures amongst more. It is calculated
from various accounts and those values are taken as a samples. As per above analysis of sales
and net profit records of Blackfriars restaurant mode of sales is calculated as £1650 and £150 for
the net profit. It is measured by the following formula
Mode: L + h ( fm – f1 / 2fm – f1 - f2 )
2.3 Measurement of dispersion to with to inform a given business scenario
Year Sales (£) Net Profit (£)
2008 4000 1140
2009 3550 1470
2010 3750 1550
2011 3270 1720
2012 3000 1890
2013 2850 870
2014 2510 2000
2015 2500 2160
2016 2450 2500
2017 2350 990
Sales Net Profit
Maximum range 4000 2500
Minimum range 2350 870
Standard deviation 593.50 528.07
Correlation coefficient -0.357
Range: It is considered as a common number which related to the same kind and nature.
It is basically used to analyse the effect of variation from upper and lower limits for a specific
scale (Kacprzyk and Fedrizzi, 2012). Maximum range of sales and net profit were calculated as
4000 and 2500 for net profit and minimum range is calculated as 2350 and 870.
9
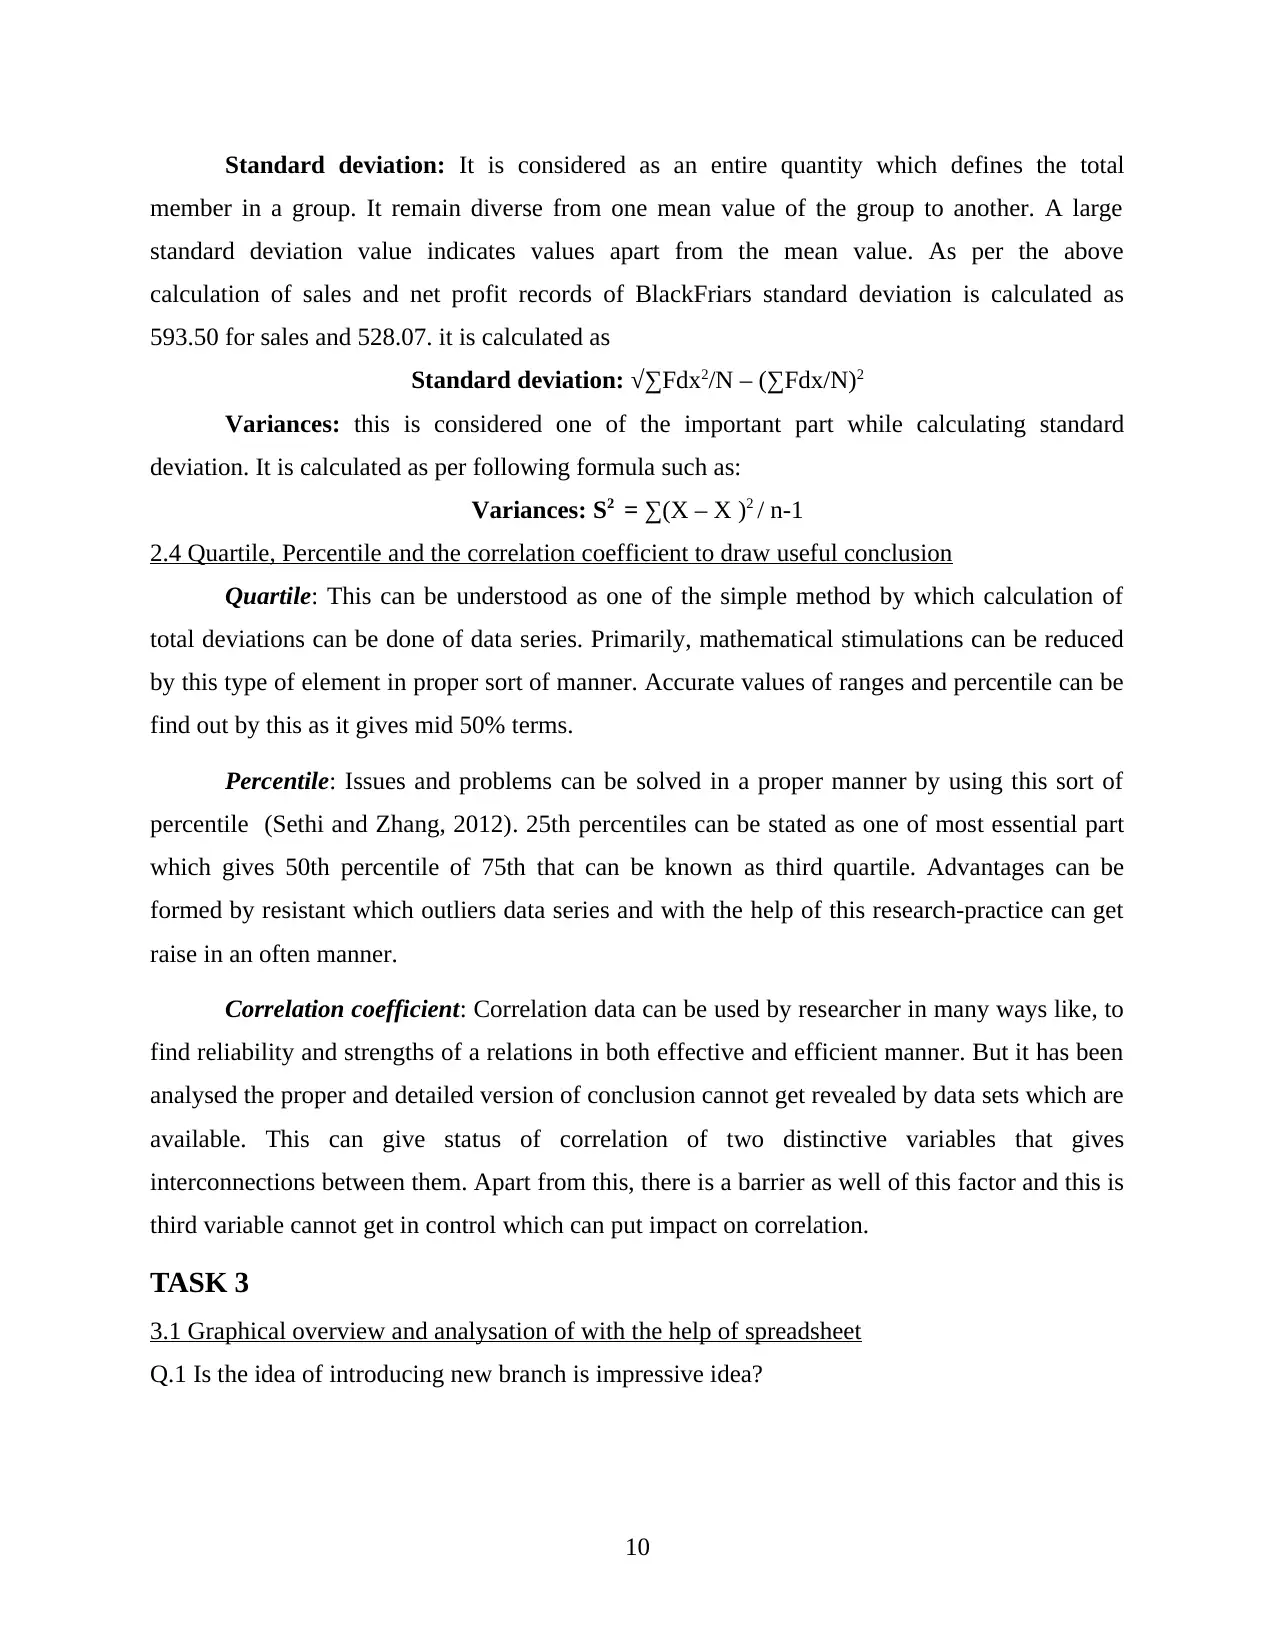
Standard deviation: It is considered as an entire quantity which defines the total
member in a group. It remain diverse from one mean value of the group to another. A large
standard deviation value indicates values apart from the mean value. As per the above
calculation of sales and net profit records of BlackFriars standard deviation is calculated as
593.50 for sales and 528.07. it is calculated as
Standard deviation: √∑Fdx2/N – (∑Fdx/N)2
Variances: this is considered one of the important part while calculating standard
deviation. It is calculated as per following formula such as:
Variances: S2 = ∑(X – X )2 / n-1
2.4 Quartile, Percentile and the correlation coefficient to draw useful conclusion
Quartile: This can be understood as one of the simple method by which calculation of
total deviations can be done of data series. Primarily, mathematical stimulations can be reduced
by this type of element in proper sort of manner. Accurate values of ranges and percentile can be
find out by this as it gives mid 50% terms.
Percentile: Issues and problems can be solved in a proper manner by using this sort of
percentile (Sethi and Zhang, 2012). 25th percentiles can be stated as one of most essential part
which gives 50th percentile of 75th that can be known as third quartile. Advantages can be
formed by resistant which outliers data series and with the help of this research-practice can get
raise in an often manner.
Correlation coefficient: Correlation data can be used by researcher in many ways like, to
find reliability and strengths of a relations in both effective and efficient manner. But it has been
analysed the proper and detailed version of conclusion cannot get revealed by data sets which are
available. This can give status of correlation of two distinctive variables that gives
interconnections between them. Apart from this, there is a barrier as well of this factor and this is
third variable cannot get in control which can put impact on correlation.
TASK 3
3.1 Graphical overview and analysation of with the help of spreadsheet
Q.1 Is the idea of introducing new branch is impressive idea?
10
⊘ This is a preview!⊘
Do you want full access?
Subscribe today to unlock all pages.
Trusted by 1+ million students worldwide
1 out of 21
Related Documents


Your All-in-One AI-Powered Toolkit for Academic Success.
+13062052269
info@desklib.com
Available 24*7 on WhatsApp / Email
![[object Object]](/_next/static/media/star-bottom.7253800d.svg)
Unlock your academic potential
Copyright © 2020–2026 A2Z Services. All Rights Reserved. Developed and managed by ZUCOL.