Business Decision Making: Analysis and Recommendations for Blackfriars
VerifiedAdded on 2021/01/02
|20
|4318
|40
Report
AI Summary
This report provides a comprehensive analysis of business decision-making processes, focusing on the case of Blackfriars Restaurant and its expansion. It begins with an introduction to business decision-making and its importance for organizational success. Task 1 covers the plan for collecting primary and secondary data, including survey methodology, sampling frames, and a detailed questionnaire used to gather customer preferences. The report summarizes data using representative values and analyzes results to draw conclusions, including descriptive statistics, measures of dispersion, and the computation of quartiles, percentiles, and correlation coefficients. Task 2 focuses on presenting information through graphs and trend lines for forecasting, as well as discussing software and techniques for information dissemination. It also includes a formal business report. Task 3 addresses information processing tools for decision-making, a project plan for an activity with critical path determination, and various financial tools used for investment appraisal. The report concludes with a summary of findings and recommendations, supported by references.

BUSINESS DECISION
MAKING
MAKING
Paraphrase This Document
Need a fresh take? Get an instant paraphrase of this document with our AI Paraphraser
TABLE OF CONTENTS
INTRODUCTION...........................................................................................................................1
TASK 1............................................................................................................................................1
1.1 Plan for collection of primary and secondary data ...............................................................1
1.2 Survey methodology and sampling frame used ...................................................................2
1.3 Questionnaire for given business problem ...........................................................................2
2.1 Creating information for decision making by summarising data using representative
values..........................................................................................................................................4
2.2 Analysing results to draw conclusions..................................................................................6
2.3 Analysing data using measures of dispersion.......................................................................7
2.4 Computation of quartiles, percentiles and correlation co-efficient for Blackfriars restaurant
.....................................................................................................................................................8
TASK 2............................................................................................................................................8
3.1 Graphs for presenting the information about sales and profit...............................................8
3.2 Trend line for forecasting of various business information................................................10
3.3 Software and techniques to disseminate information effectively......................................10
3.4 formal business report.........................................................................................................10
TASK 3..........................................................................................................................................11
4.1 Information processing tools for decision making .............................................................11
4.2 project plan for an activity and determination of critical path............................................12
4.3 Financial tools for decision making ...................................................................................14
CONCLUSION..............................................................................................................................16
REFERENCES..............................................................................................................................17
INTRODUCTION
Business decision making is an integral part of management which is used for making
the best decision for improving the performance and profitability of organisation. Business
decision making helps in making strategies for attracting more customers towards the firm.
Blackfriars restaurant will be included in this study as it is opening its second restaurant in
London. The Blackfriars restaurant is the oldest dining room in the UK. It provides traditional
British food using seasonal produce from local farms. This project will include variety of sources
of data collection and Analysis. Furthermore, it will provide understanding of the various
software and techniques used decision making in the organisation. Moreover, it will provide
information processing tools to prepare a project plan and identify the Main activities involved
getting the restaurant ready for the business. It will also provide the investment appraisal tools
for identifying the future profitability of the firm. This report will provide trend line in graph to
assist in forecasting for the future profitability.
TASK 1
1.1 Plan for collection of primary and secondary data
Primary data and secondary data are collected in order to identify the customer taste and
preferences and identifying their needs in order to provide them various products and services.
Primary data: primary data refers to the collection of information from first- hand data
using various methods such as surveys, interviews etc (Zsambok and Klein, 2014).
Plan for primary data collection
Blackfriars for the purpose of primary data collection will use questionnaire for
identifying the needs and demands of customers in order to provide them various facilities
according to the result provided by using questionnaire. Primary data will be collected using the
survey method in which the restaurant will collect the data about customer preferences and taste
by using questionnaire and providing that questionnaire to the customers to fill the answers
which will be used for identifying the customer preferences using the sampling method which
will include sample of 20 people.
Secondary data: It includes data collected from various studies and it does not include
the first – hand data (Barlett, 2016). It contains data which is already gathered and using the
same data for identifying the information. It includes data collected from records, government
department etc.
1
⊘ This is a preview!⊘
Do you want full access?
Subscribe today to unlock all pages.
Trusted by 1+ million students worldwide
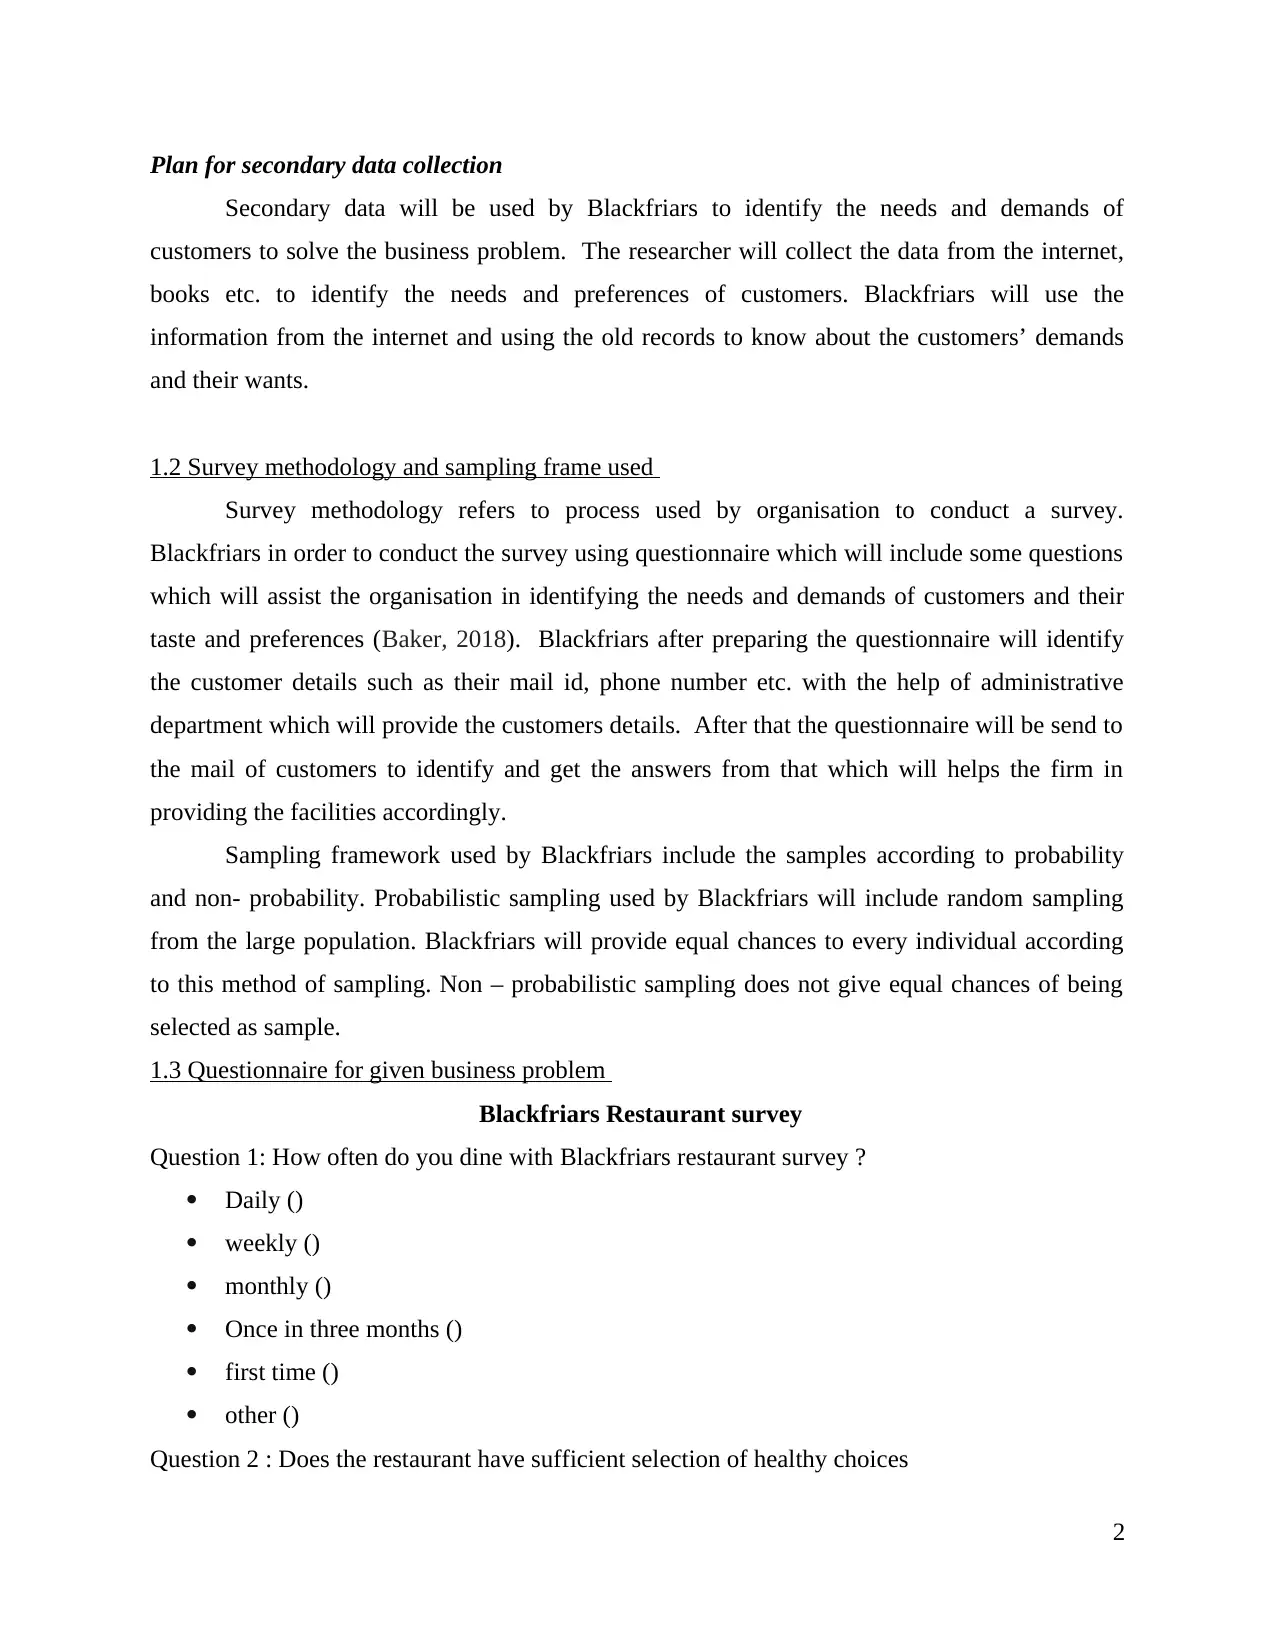
Plan for secondary data collection
Secondary data will be used by Blackfriars to identify the needs and demands of
customers to solve the business problem. The researcher will collect the data from the internet,
books etc. to identify the needs and preferences of customers. Blackfriars will use the
information from the internet and using the old records to know about the customers’ demands
and their wants.
1.2 Survey methodology and sampling frame used
Survey methodology refers to process used by organisation to conduct a survey.
Blackfriars in order to conduct the survey using questionnaire which will include some questions
which will assist the organisation in identifying the needs and demands of customers and their
taste and preferences (Baker, 2018). Blackfriars after preparing the questionnaire will identify
the customer details such as their mail id, phone number etc. with the help of administrative
department which will provide the customers details. After that the questionnaire will be send to
the mail of customers to identify and get the answers from that which will helps the firm in
providing the facilities accordingly.
Sampling framework used by Blackfriars include the samples according to probability
and non- probability. Probabilistic sampling used by Blackfriars will include random sampling
from the large population. Blackfriars will provide equal chances to every individual according
to this method of sampling. Non – probabilistic sampling does not give equal chances of being
selected as sample.
1.3 Questionnaire for given business problem
Blackfriars Restaurant survey
Question 1: How often do you dine with Blackfriars restaurant survey ?
Daily ()
weekly ()
monthly ()
Once in three months ()
first time ()
other ()
Question 2 : Does the restaurant have sufficient selection of healthy choices
2
Paraphrase This Document
Need a fresh take? Get an instant paraphrase of this document with our AI Paraphraser
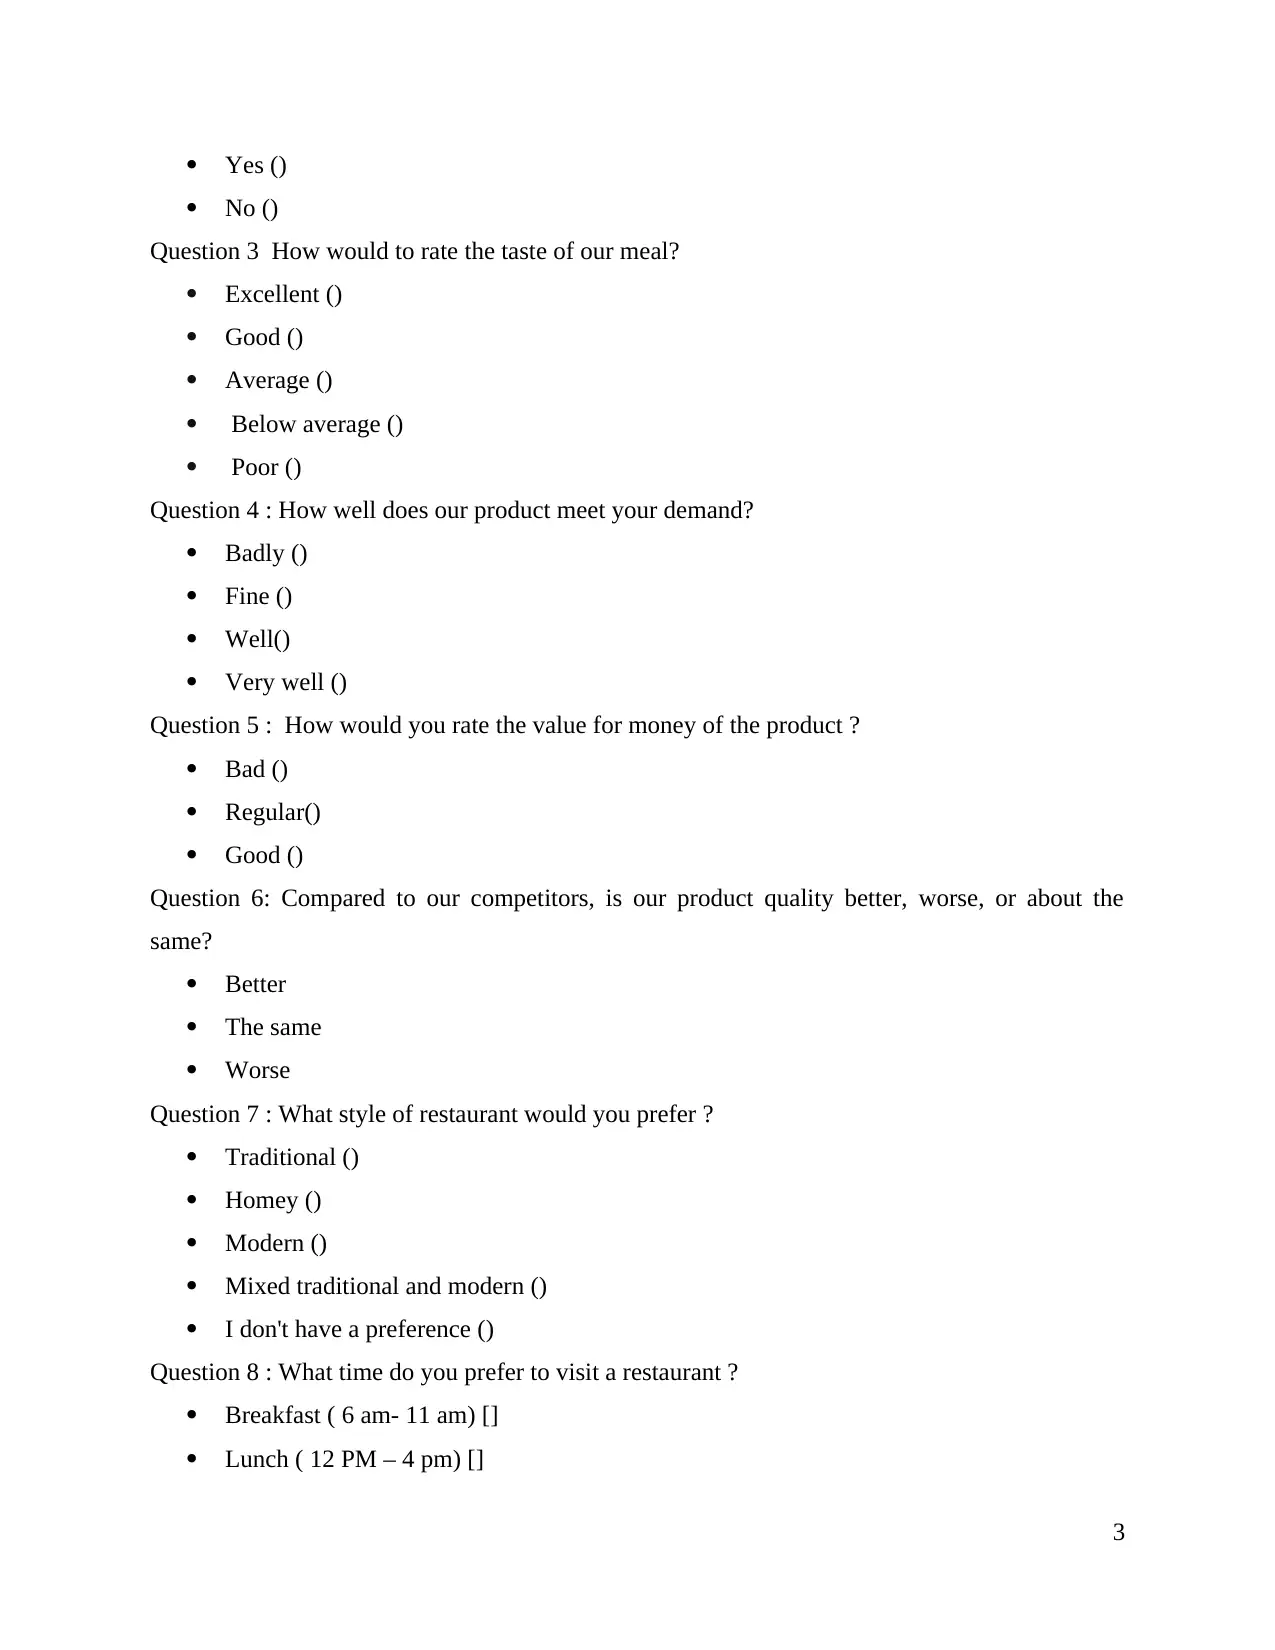
Yes ()
No ()
Question 3 How would to rate the taste of our meal?
Excellent ()
Good ()
Average ()
Below average ()
Poor ()
Question 4 : How well does our product meet your demand?
Badly ()
Fine ()
Well()
Very well ()
Question 5 : How would you rate the value for money of the product ?
Bad ()
Regular()
Good ()
Question 6: Compared to our competitors, is our product quality better, worse, or about the
same?
Better
The same
Worse
Question 7 : What style of restaurant would you prefer ?
Traditional ()
Homey ()
Modern ()
Mixed traditional and modern ()
I don't have a preference ()
Question 8 : What time do you prefer to visit a restaurant ?
Breakfast ( 6 am- 11 am) []
Lunch ( 12 PM – 4 pm) []
3
Both meals
Question 9 : How do you prefer the food to be served ?
Simple ()
Crafted ()
Flavourful ()
Question 10: Annual income range
Below 20000 ()
20000-30000 ()
31000-40000 ()
41000-50000()
51000 and above ()
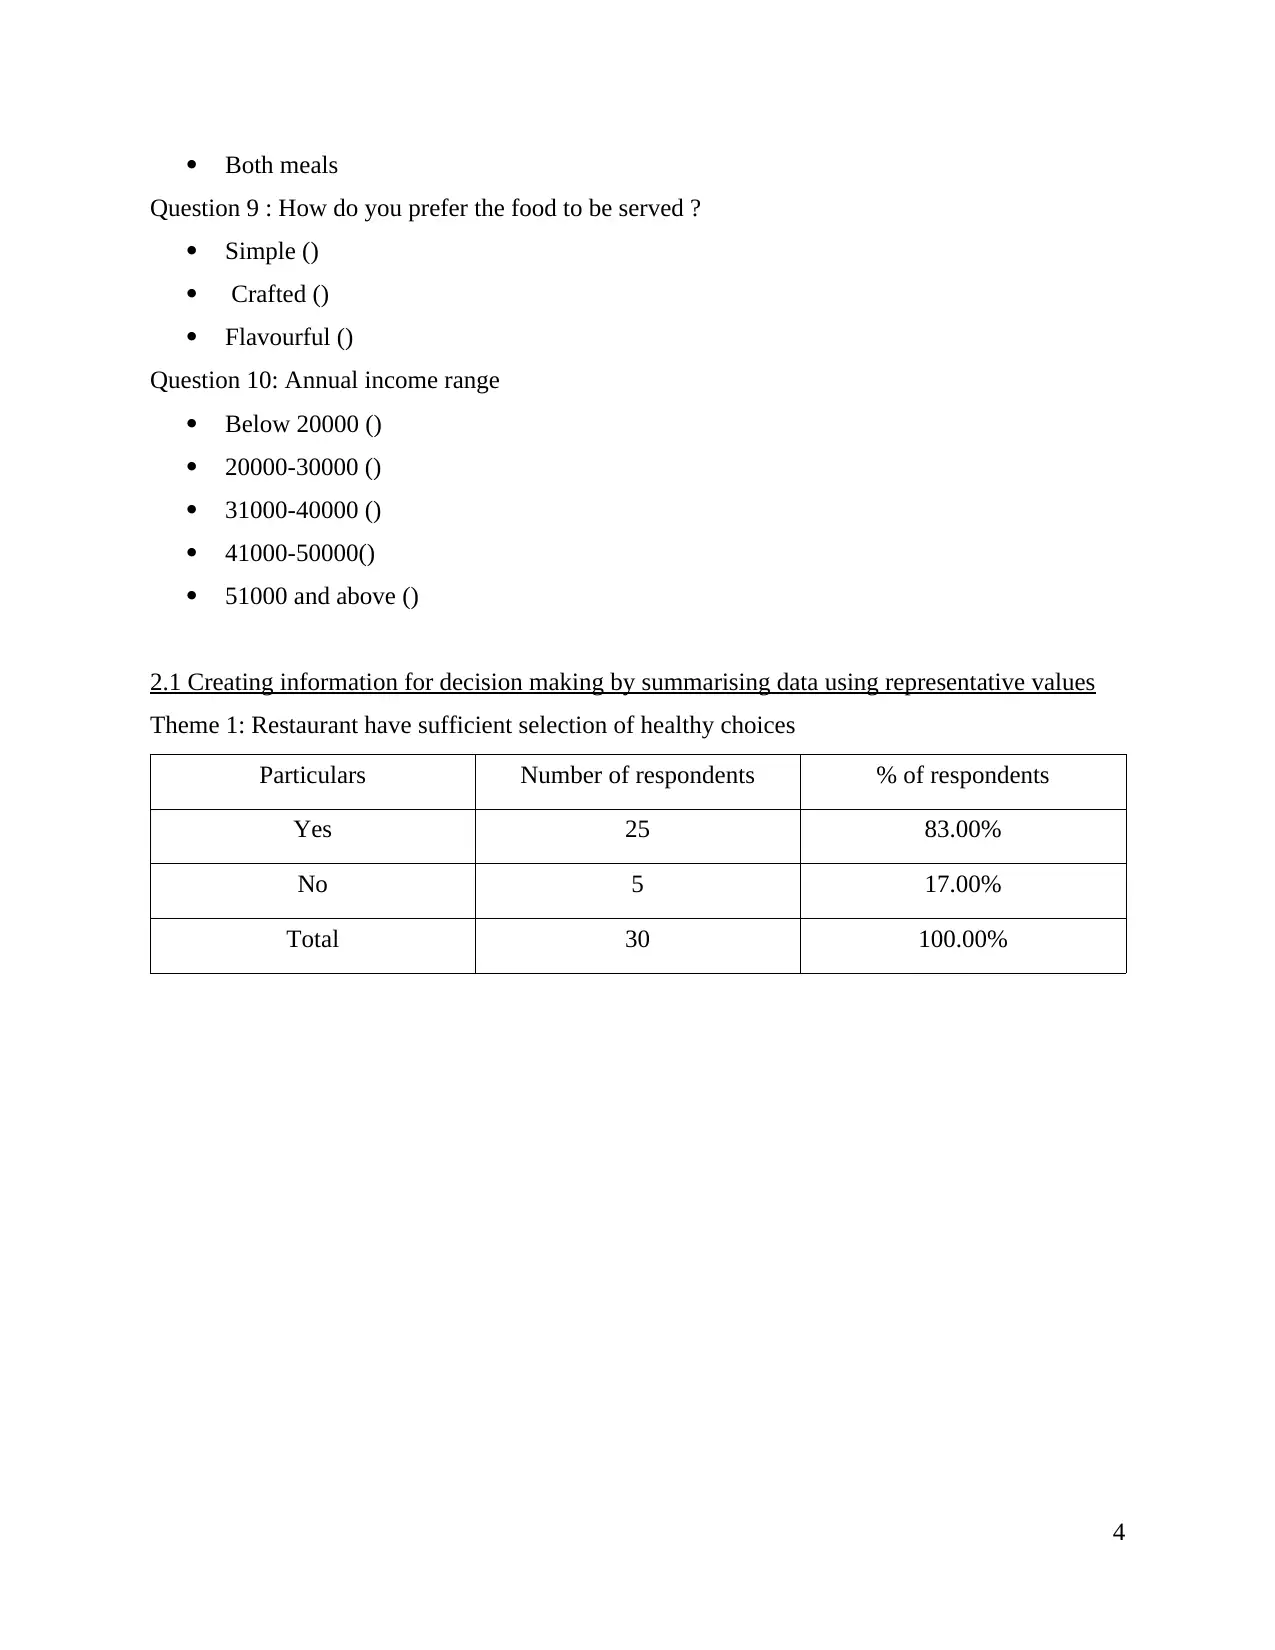
2.1 Creating information for decision making by summarising data using representative values
Theme 1: Restaurant have sufficient selection of healthy choices
Particulars Number of respondents % of respondents
Yes 25 83.00%
No 5 17.00%
Total 30 100.00%
4
Question 9 : How do you prefer the food to be served ?
Simple ()
Crafted ()
Flavourful ()
Question 10: Annual income range
Below 20000 ()
20000-30000 ()
31000-40000 ()
41000-50000()
51000 and above ()
2.1 Creating information for decision making by summarising data using representative values
Theme 1: Restaurant have sufficient selection of healthy choices
Particulars Number of respondents % of respondents
Yes 25 83.00%
No 5 17.00%
Total 30 100.00%
4
⊘ This is a preview!⊘
Do you want full access?
Subscribe today to unlock all pages.
Trusted by 1+ million students worldwide
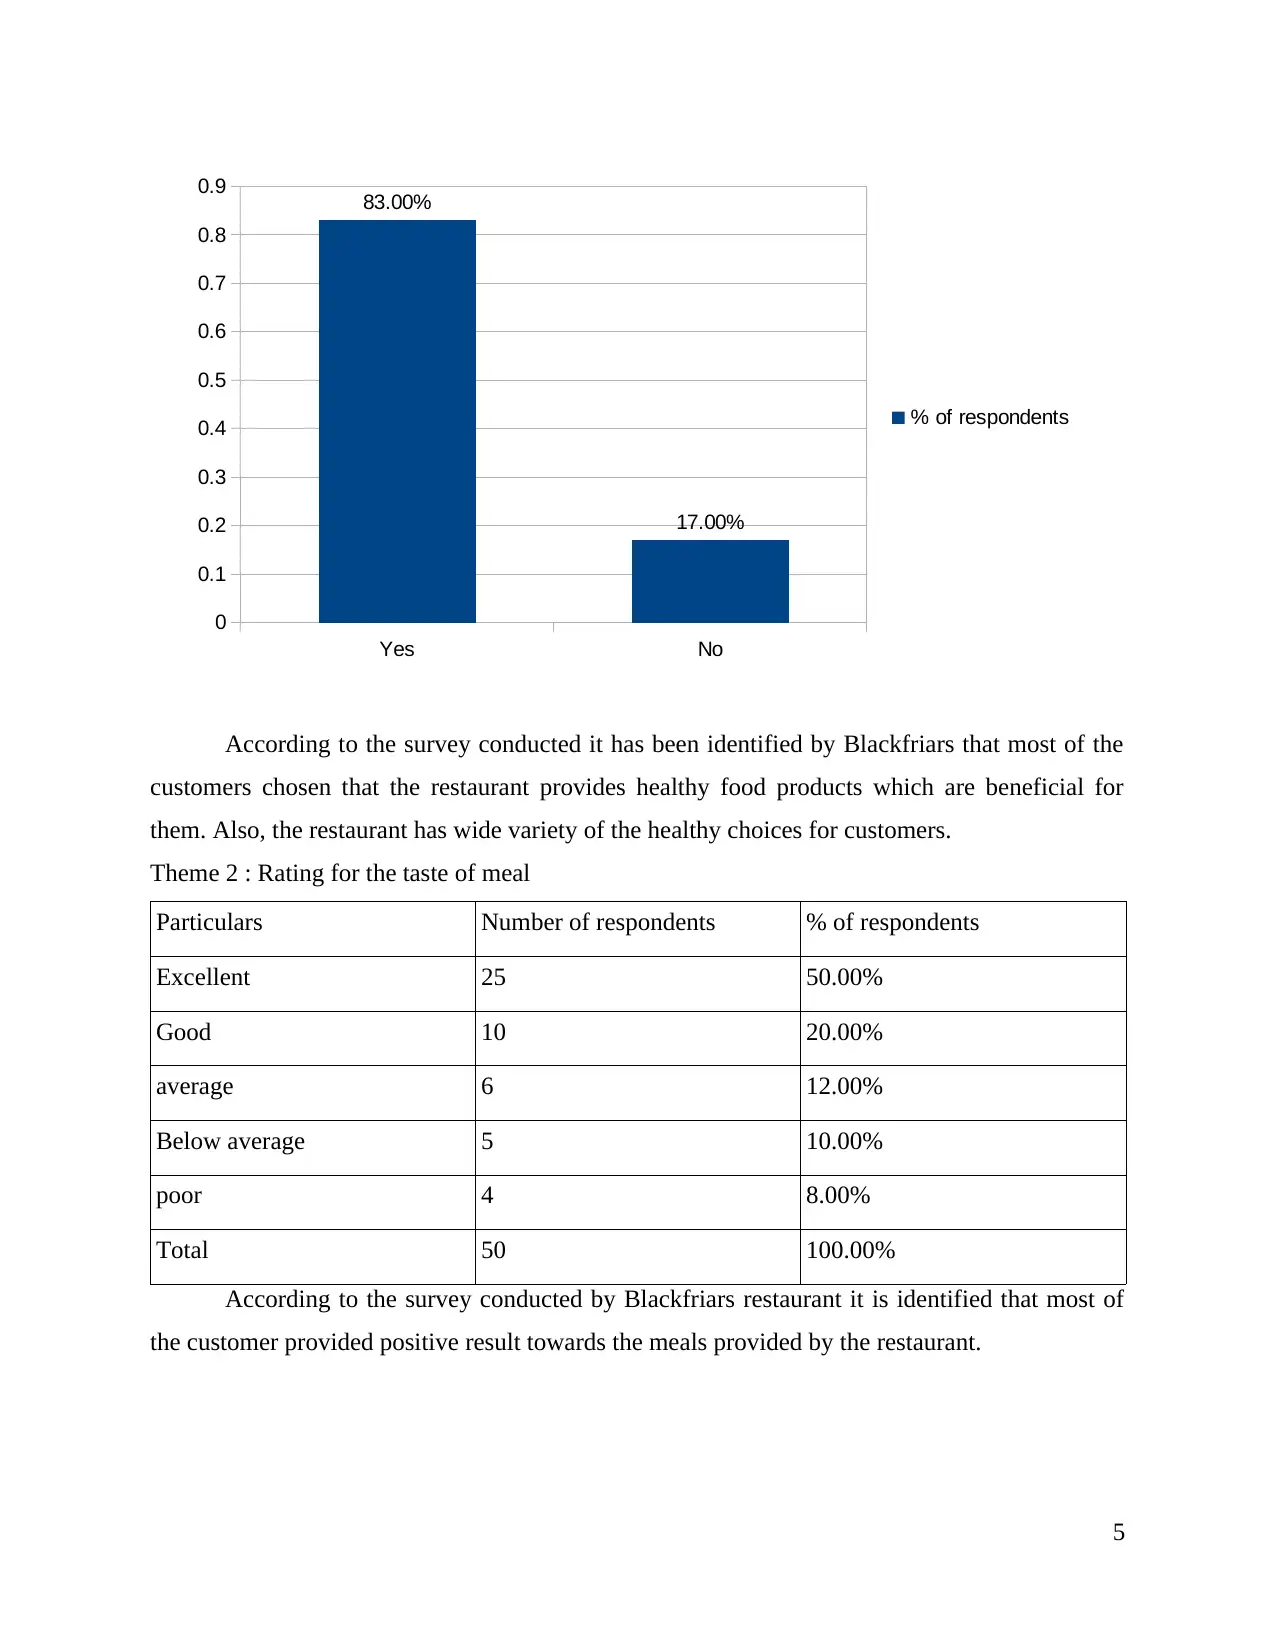
According to the survey conducted it has been identified by Blackfriars that most of the
customers chosen that the restaurant provides healthy food products which are beneficial for
them. Also, the restaurant has wide variety of the healthy choices for customers.
Theme 2 : Rating for the taste of meal
Particulars Number of respondents % of respondents
Excellent 25 50.00%
Good 10 20.00%
average 6 12.00%
Below average 5 10.00%
poor 4 8.00%
Total 50 100.00%
According to the survey conducted by Blackfriars restaurant it is identified that most of
the customer provided positive result towards the meals provided by the restaurant.
5
Yes No
0
0.1
0.2
0.3
0.4
0.5
0.6
0.7
0.8
0.9 83.00%
17.00%
% of respondents
Paraphrase This Document
Need a fresh take? Get an instant paraphrase of this document with our AI Paraphraser
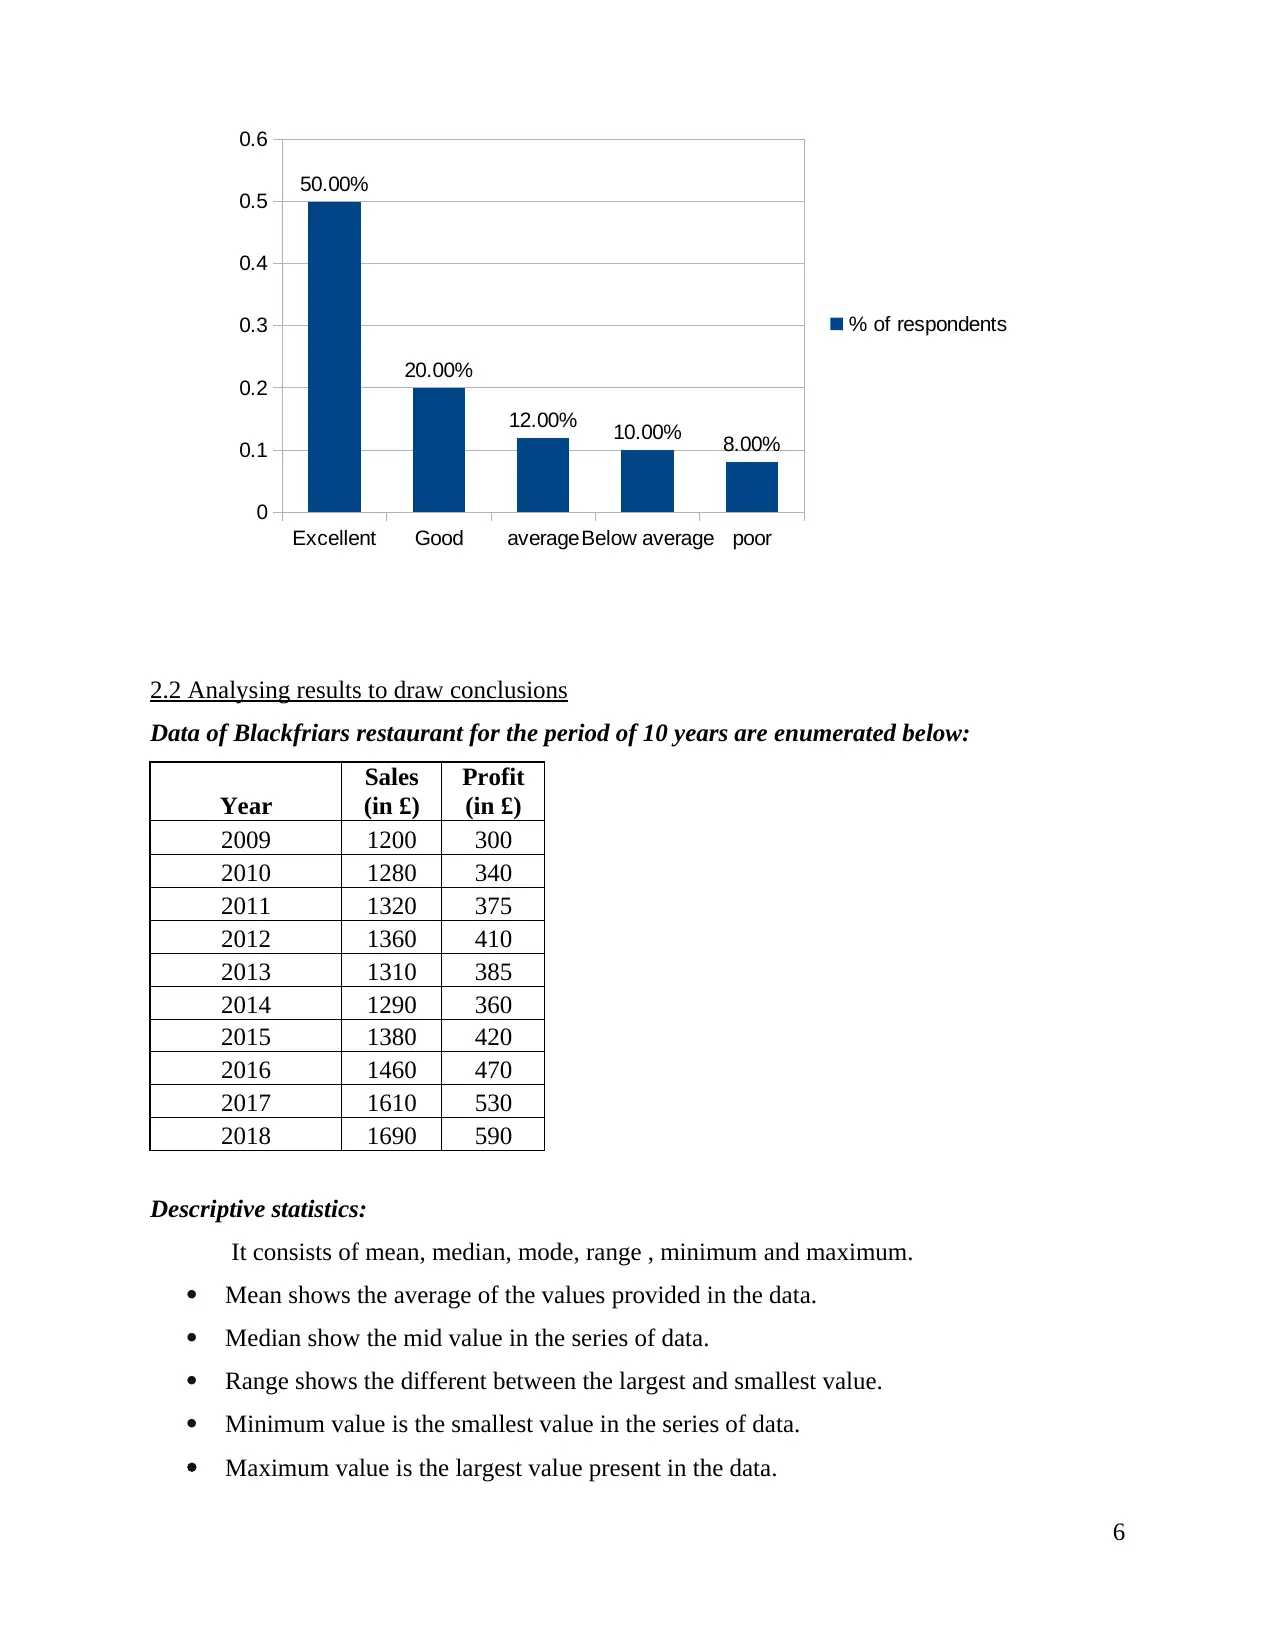
2.2 Analysing results to draw conclusions
Data of Blackfriars restaurant for the period of 10 years are enumerated below:
Year
Sales
(in £)
Profit
(in £)
2009 1200 300
2010 1280 340
2011 1320 375
2012 1360 410
2013 1310 385
2014 1290 360
2015 1380 420
2016 1460 470
2017 1610 530
2018 1690 590
Descriptive statistics:
It consists of mean, median, mode, range , minimum and maximum.
Mean shows the average of the values provided in the data.
Median show the mid value in the series of data.
Range shows the different between the largest and smallest value.
Minimum value is the smallest value in the series of data.
Maximum value is the largest value present in the data.
6
Excellent Good averageBelow average poor
0
0.1
0.2
0.3
0.4
0.5
0.6
50.00%
20.00%
12.00% 10.00% 8.00%
% of respondents
Particulars
Sales
(in £)
Profit
(in £)
Mean 1390 418
Median 1340 397.5
Mode #N/A #N/A
Range 490 290
Minimum 1200 300
Maximum 1690 590
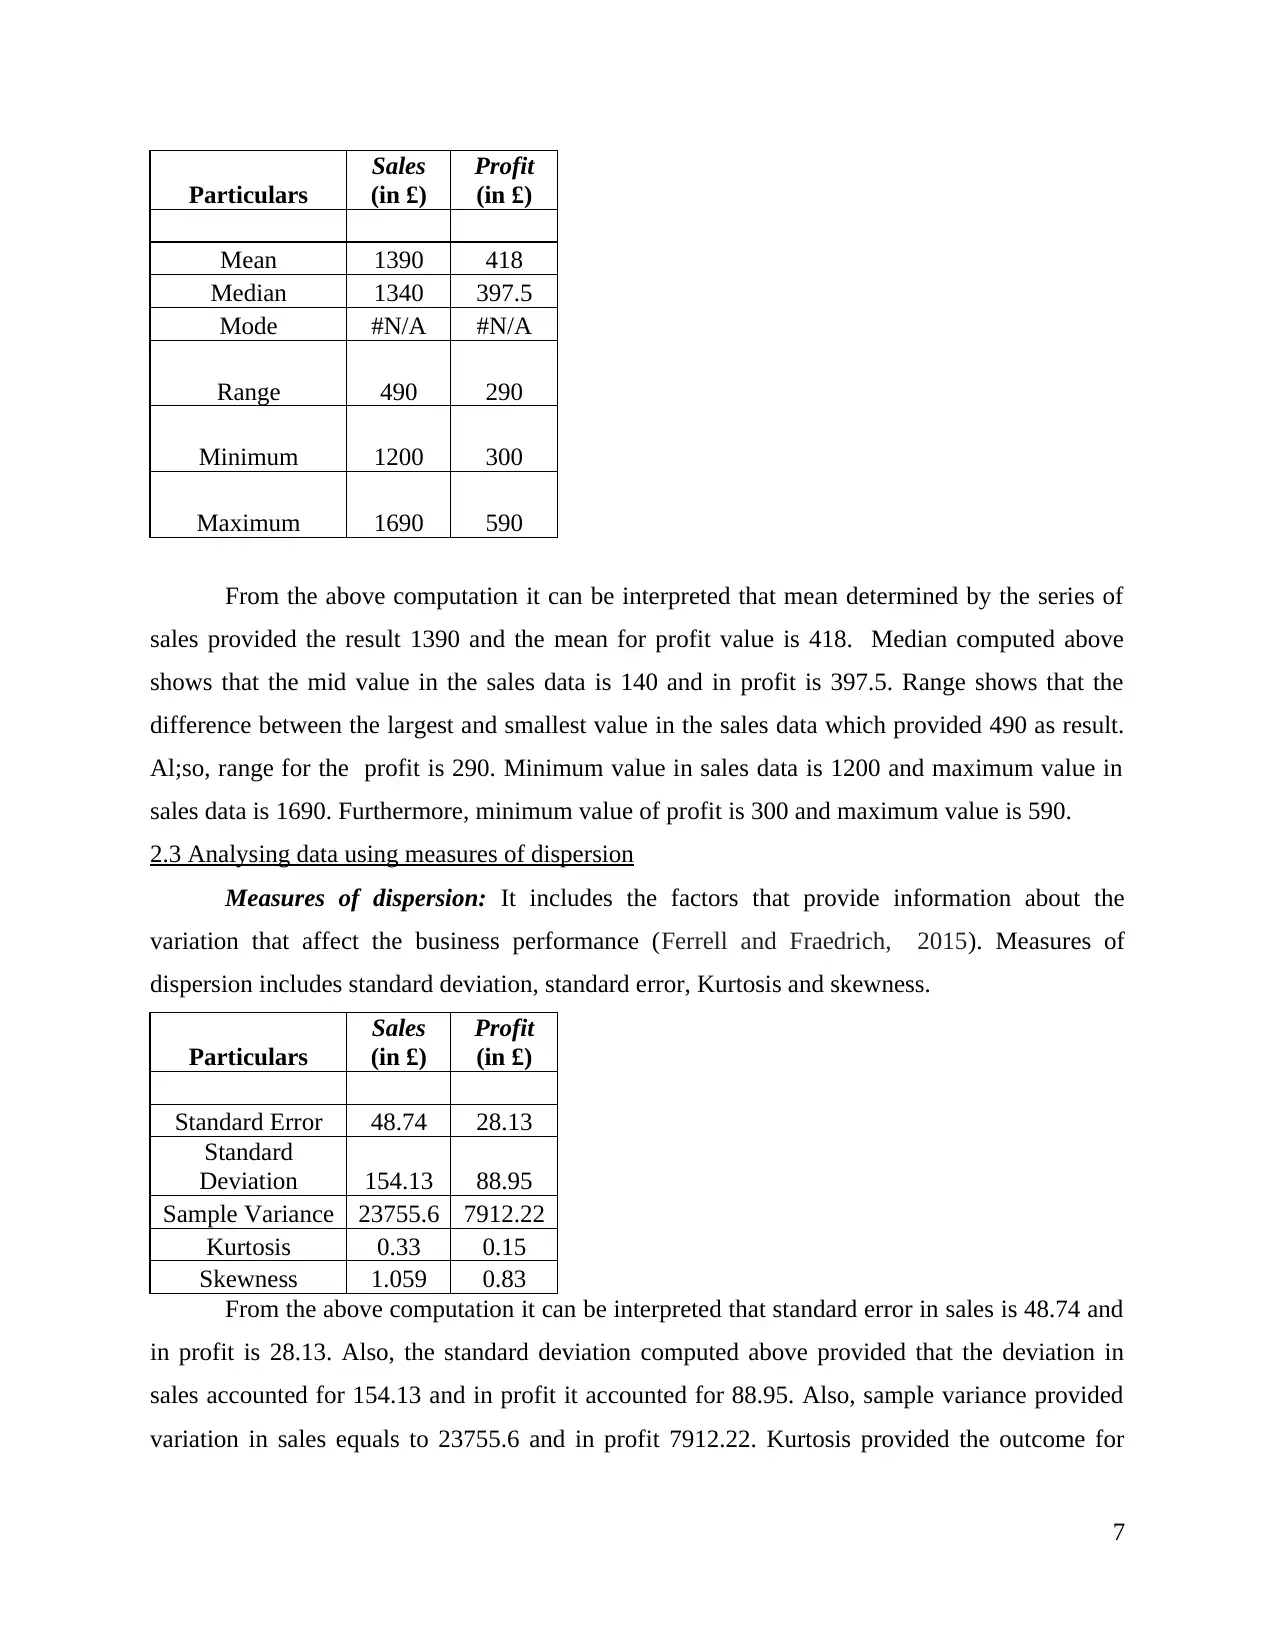
From the above computation it can be interpreted that mean determined by the series of
sales provided the result 1390 and the mean for profit value is 418. Median computed above
shows that the mid value in the sales data is 140 and in profit is 397.5. Range shows that the
difference between the largest and smallest value in the sales data which provided 490 as result.
Al;so, range for the profit is 290. Minimum value in sales data is 1200 and maximum value in
sales data is 1690. Furthermore, minimum value of profit is 300 and maximum value is 590.
2.3 Analysing data using measures of dispersion
Measures of dispersion: It includes the factors that provide information about the
variation that affect the business performance (Ferrell and Fraedrich, 2015). Measures of
dispersion includes standard deviation, standard error, Kurtosis and skewness.
Particulars
Sales
(in £)
Profit
(in £)
Standard Error 48.74 28.13
Standard
Deviation 154.13 88.95
Sample Variance 23755.6 7912.22
Kurtosis 0.33 0.15
Skewness 1.059 0.83
From the above computation it can be interpreted that standard error in sales is 48.74 and
in profit is 28.13. Also, the standard deviation computed above provided that the deviation in
sales accounted for 154.13 and in profit it accounted for 88.95. Also, sample variance provided
variation in sales equals to 23755.6 and in profit 7912.22. Kurtosis provided the outcome for
7
Sales
(in £)
Profit
(in £)
Mean 1390 418
Median 1340 397.5
Mode #N/A #N/A
Range 490 290
Minimum 1200 300
Maximum 1690 590
From the above computation it can be interpreted that mean determined by the series of
sales provided the result 1390 and the mean for profit value is 418. Median computed above
shows that the mid value in the sales data is 140 and in profit is 397.5. Range shows that the
difference between the largest and smallest value in the sales data which provided 490 as result.
Al;so, range for the profit is 290. Minimum value in sales data is 1200 and maximum value in
sales data is 1690. Furthermore, minimum value of profit is 300 and maximum value is 590.
2.3 Analysing data using measures of dispersion
Measures of dispersion: It includes the factors that provide information about the
variation that affect the business performance (Ferrell and Fraedrich, 2015). Measures of
dispersion includes standard deviation, standard error, Kurtosis and skewness.
Particulars
Sales
(in £)
Profit
(in £)
Standard Error 48.74 28.13
Standard
Deviation 154.13 88.95
Sample Variance 23755.6 7912.22
Kurtosis 0.33 0.15
Skewness 1.059 0.83
From the above computation it can be interpreted that standard error in sales is 48.74 and
in profit is 28.13. Also, the standard deviation computed above provided that the deviation in
sales accounted for 154.13 and in profit it accounted for 88.95. Also, sample variance provided
variation in sales equals to 23755.6 and in profit 7912.22. Kurtosis provided the outcome for
7
⊘ This is a preview!⊘
Do you want full access?
Subscribe today to unlock all pages.
Trusted by 1+ million students worldwide
variation in sales as 0.33 and in profit as 0.15. Skewness provided that sales variation equals to
1.059 and profit variation equal to 0.83.
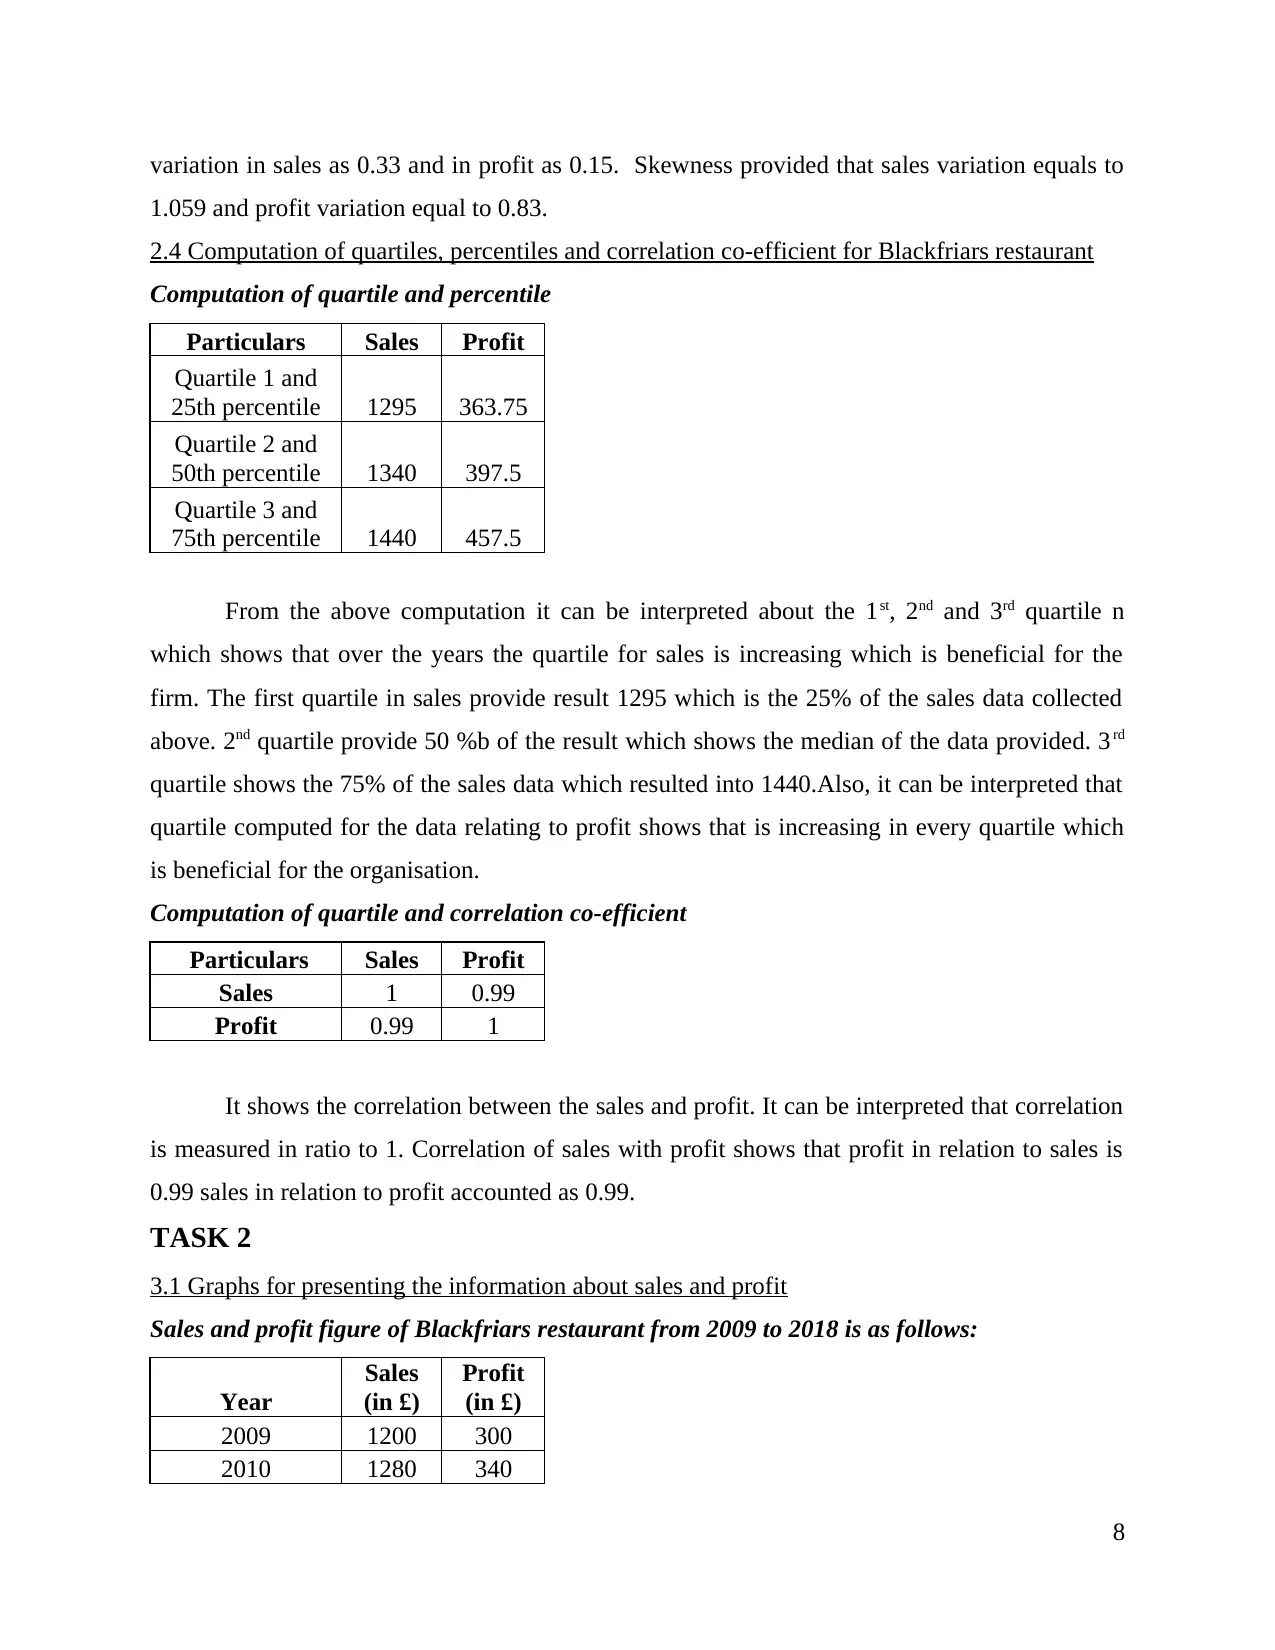
2.4 Computation of quartiles, percentiles and correlation co-efficient for Blackfriars restaurant
Computation of quartile and percentile
Particulars Sales Profit
Quartile 1 and
25th percentile 1295 363.75
Quartile 2 and
50th percentile 1340 397.5
Quartile 3 and
75th percentile 1440 457.5
From the above computation it can be interpreted about the 1st, 2nd and 3rd quartile n
which shows that over the years the quartile for sales is increasing which is beneficial for the
firm. The first quartile in sales provide result 1295 which is the 25% of the sales data collected
above. 2nd quartile provide 50 %b of the result which shows the median of the data provided. 3rd
quartile shows the 75% of the sales data which resulted into 1440.Also, it can be interpreted that
quartile computed for the data relating to profit shows that is increasing in every quartile which
is beneficial for the organisation.
Computation of quartile and correlation co-efficient
Particulars Sales Profit
Sales 1 0.99
Profit 0.99 1
It shows the correlation between the sales and profit. It can be interpreted that correlation
is measured in ratio to 1. Correlation of sales with profit shows that profit in relation to sales is
0.99 sales in relation to profit accounted as 0.99.
TASK 2
3.1 Graphs for presenting the information about sales and profit
Sales and profit figure of Blackfriars restaurant from 2009 to 2018 is as follows:
Year
Sales
(in £)
Profit
(in £)
2009 1200 300
2010 1280 340
8
1.059 and profit variation equal to 0.83.
2.4 Computation of quartiles, percentiles and correlation co-efficient for Blackfriars restaurant
Computation of quartile and percentile
Particulars Sales Profit
Quartile 1 and
25th percentile 1295 363.75
Quartile 2 and
50th percentile 1340 397.5
Quartile 3 and
75th percentile 1440 457.5
From the above computation it can be interpreted about the 1st, 2nd and 3rd quartile n
which shows that over the years the quartile for sales is increasing which is beneficial for the
firm. The first quartile in sales provide result 1295 which is the 25% of the sales data collected
above. 2nd quartile provide 50 %b of the result which shows the median of the data provided. 3rd
quartile shows the 75% of the sales data which resulted into 1440.Also, it can be interpreted that
quartile computed for the data relating to profit shows that is increasing in every quartile which
is beneficial for the organisation.
Computation of quartile and correlation co-efficient
Particulars Sales Profit
Sales 1 0.99
Profit 0.99 1
It shows the correlation between the sales and profit. It can be interpreted that correlation
is measured in ratio to 1. Correlation of sales with profit shows that profit in relation to sales is
0.99 sales in relation to profit accounted as 0.99.
TASK 2
3.1 Graphs for presenting the information about sales and profit
Sales and profit figure of Blackfriars restaurant from 2009 to 2018 is as follows:
Year
Sales
(in £)
Profit
(in £)
2009 1200 300
2010 1280 340
8
Paraphrase This Document
Need a fresh take? Get an instant paraphrase of this document with our AI Paraphraser
2011 1320 375
2012 1360 410
2013 1310 385
2014 1290 360
2015 1380 420
2016 1460 470
2017 1610 530
2018 1690 590
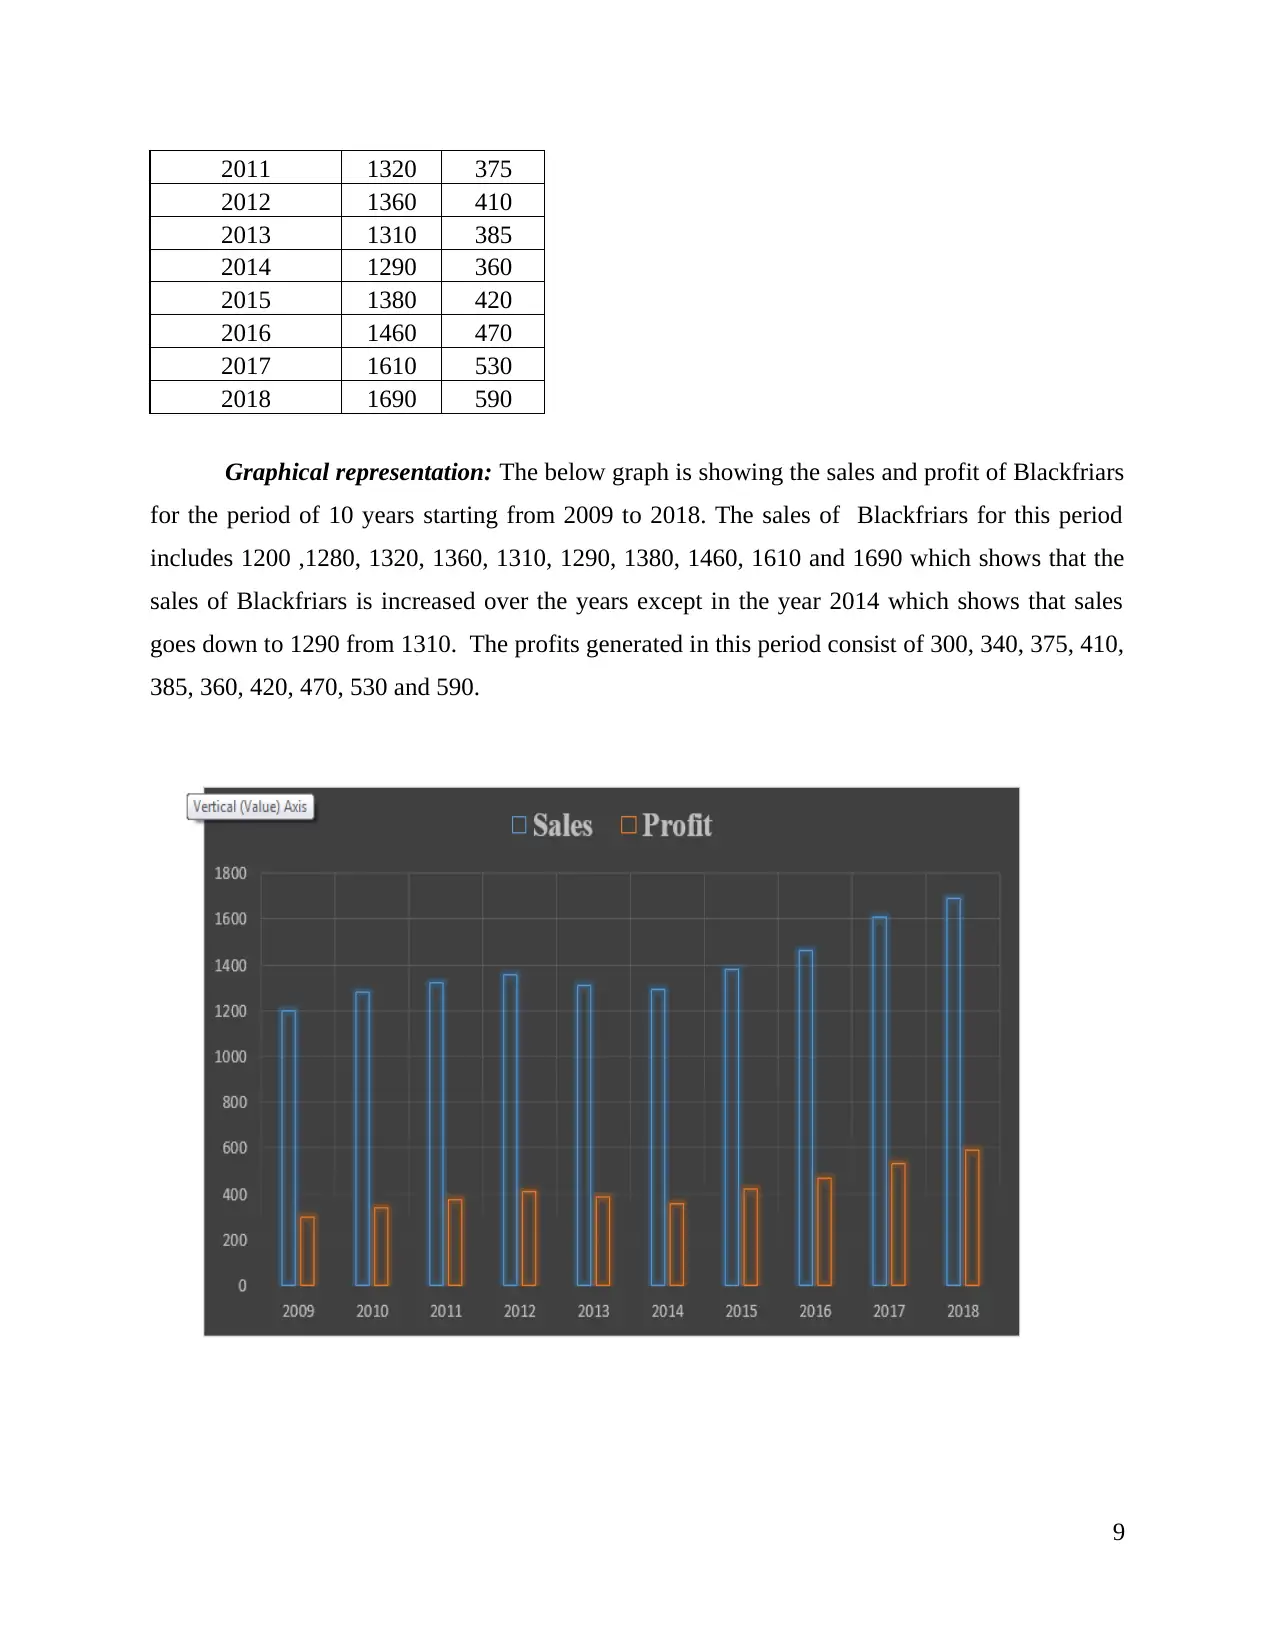
Graphical representation: The below graph is showing the sales and profit of Blackfriars
for the period of 10 years starting from 2009 to 2018. The sales of Blackfriars for this period
includes 1200 ,1280, 1320, 1360, 1310, 1290, 1380, 1460, 1610 and 1690 which shows that the
sales of Blackfriars is increased over the years except in the year 2014 which shows that sales
goes down to 1290 from 1310. The profits generated in this period consist of 300, 340, 375, 410,
385, 360, 420, 470, 530 and 590.
9
2012 1360 410
2013 1310 385
2014 1290 360
2015 1380 420
2016 1460 470
2017 1610 530
2018 1690 590
Graphical representation: The below graph is showing the sales and profit of Blackfriars
for the period of 10 years starting from 2009 to 2018. The sales of Blackfriars for this period
includes 1200 ,1280, 1320, 1360, 1310, 1290, 1380, 1460, 1610 and 1690 which shows that the
sales of Blackfriars is increased over the years except in the year 2014 which shows that sales
goes down to 1290 from 1310. The profits generated in this period consist of 300, 340, 375, 410,
385, 360, 420, 470, 530 and 590.
9
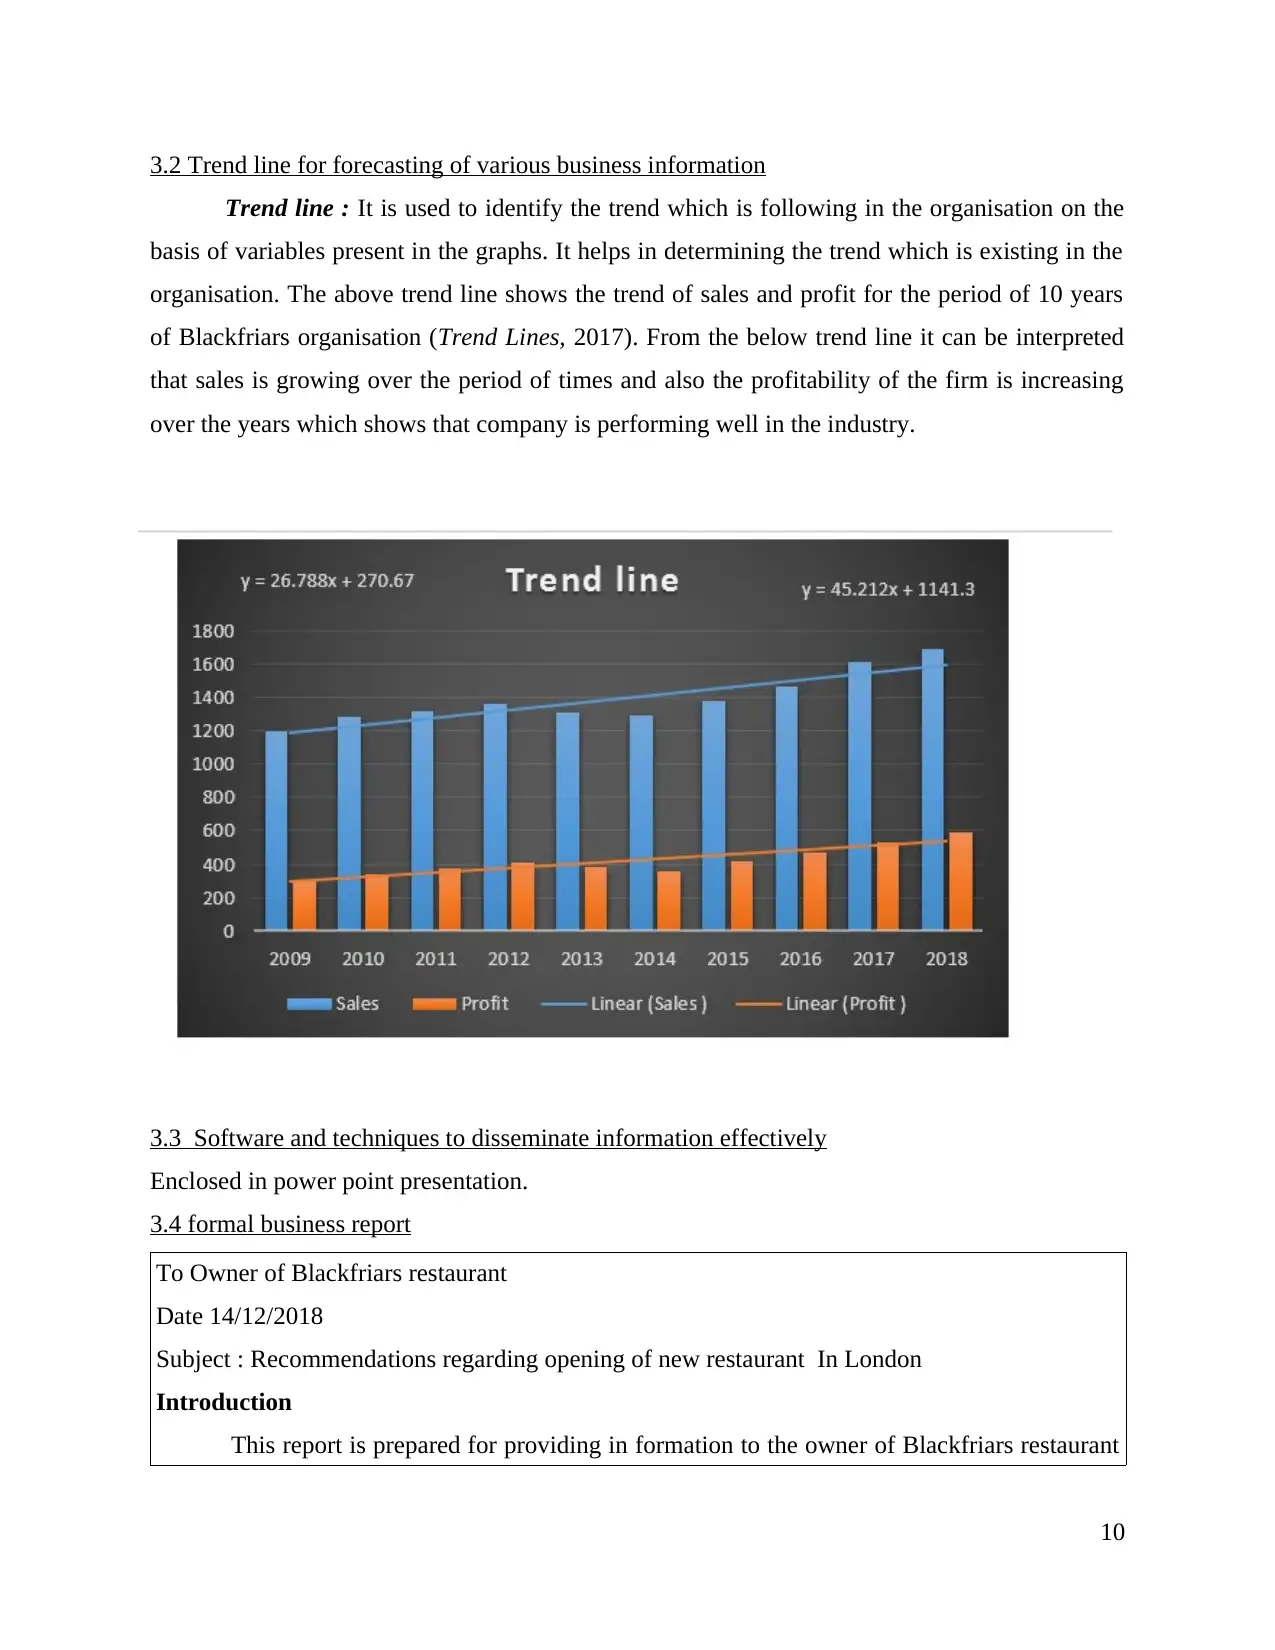
3.2 Trend line for forecasting of various business information
Trend line : It is used to identify the trend which is following in the organisation on the
basis of variables present in the graphs. It helps in determining the trend which is existing in the
organisation. The above trend line shows the trend of sales and profit for the period of 10 years
of Blackfriars organisation (Trend Lines, 2017). From the below trend line it can be interpreted
that sales is growing over the period of times and also the profitability of the firm is increasing
over the years which shows that company is performing well in the industry.
3.3 Software and techniques to disseminate information effectively
Enclosed in power point presentation.
3.4 formal business report
To Owner of Blackfriars restaurant
Date 14/12/2018
Subject : Recommendations regarding opening of new restaurant In London
Introduction
This report is prepared for providing in formation to the owner of Blackfriars restaurant
10
⊘ This is a preview!⊘
Do you want full access?
Subscribe today to unlock all pages.
Trusted by 1+ million students worldwide
1 out of 20
Related Documents


Your All-in-One AI-Powered Toolkit for Academic Success.
+13062052269
info@desklib.com
Available 24*7 on WhatsApp / Email
![[object Object]](/_next/static/media/star-bottom.7253800d.svg)
Unlock your academic potential
Copyright © 2020–2026 A2Z Services. All Rights Reserved. Developed and managed by ZUCOL.