Business Decision-Making Report: Blackfriars Restaurant Expansion
VerifiedAdded on 2020/06/05
|24
|4276
|44
Report
AI Summary
This report analyzes the business decision-making process for the expansion of Blackfriars Restaurant, focusing on its potential entry into a new market. The report begins with an introduction to the importance of business decision-making for sustainable development, particularly in the context of the restaurant industry. It outlines the methodology, including the use of primary and secondary data sources, survey design, and sampling techniques. The report presents the results of a survey conducted to assess consumer preferences and opinions regarding the restaurant's expansion. It includes data analysis using representative values, measures of central tendency, and dispersion, along with the advantages of using quartiles, percentiles, and correlation coefficients. The report then moves on to graphical representations of the data, trend line analysis, and the presentation of a formal report. Furthermore, the report explores the implementation of information tools for effective decision-making, network diagrams, and various investment appraisal proposals. The conclusion summarizes the key findings and recommendations for Blackfriars Restaurant's expansion strategy.
Business Decision-
Making
Table of Contents
Making
Table of Contents
Paraphrase This Document
Need a fresh take? Get an instant paraphrase of this document with our AI Paraphraser
INTRODUCTION...........................................................................................................................1
TASK 1............................................................................................................................................1
1.1 Create a plan:.........................................................................................................................1
1.2 Survey methodology and sampling frame used:...................................................................2
1.3: Questionnaire designing:......................................................................................................3
TASK 2............................................................................................................................................5
2.1: Designing data with the help of representative values.........................................................5
2.2 Assessment of data which are gathered:...............................................................................7
2.3 Assessing measure of dispersion:..........................................................................................8
2.4: Advantages of using quartile, percentile and coefficient correlation...................................9
TASK 3..........................................................................................................................................10
3.1: Produce graphs...................................................................................................................10
3.2 Trend line............................................................................................................................14
3.3 Covered in PPT...................................................................................................................15
3.4: Presentation of formal report.............................................................................................16
TASK 4..........................................................................................................................................17
4.1: Implementation of information tools for making effective decision-making....................17
4.2 Network diagram:................................................................................................................18
4.3 Various investment appraisal proposal:..............................................................................19
CONCLUSION..............................................................................................................................20
REFERENCES..............................................................................................................................21

⊘ This is a preview!⊘
Do you want full access?
Subscribe today to unlock all pages.
Trusted by 1+ million students worldwide
INTRODUCTION
Business decision making is the tool which is used by the organisation in order to gain
the sustainable development. However, business decision making is the most effective tool that
are used by the organisation in order to get the core competencies. However, decision making
tool is the most efficient way to make an strategy in an efficient manner. Although, the
management accounting is the best effective tool that can be used by the Blackfriars Restaurant
so that they could make an efficient policies. This report is totally based on the Blackfriars
restaurant which is expanding its operations in an efficient manner. The main aim of this report
is to know about the market where the company is going to set up their expansion. The
researcher, with the help of this report, would get to know about the market where the firm can
expand their operations in an effective manner.
TASK 1
1.1 Create a plan:
The data is the most crucial tool which can be used by each organisation for making the
business viable and sustainable. However, there is a strong need together the relevant data so that
the business can be get the sustainable development. The data can be gathered by the researcher
for knowing the real situations of the market where the company is going to expand their market
effectively (Cosgrove and Rijsberman, 2014). The data is gathered via two way. Which is
primary and secondary method. But before going to use the data, company would get to know
the pros and cons of these sources for gathering the data. Now, there is a strong need to make a
planning which can be used by the organisation in order to gain the sustainable development.
These are elaborated in an effective manner:
Primary source of method: This is the primary method which is used for the first time.
The main tool is used by the organisation in order to gain the sustainability. The primary method
is much reliable and is used at the time when the data requirement is strictly close to the
requirements. But there are certain tools which can be used by the organisation in order to gain
the sustainability in an effective manner. Under this case, primary data is used by the
organisation in order to know about the central London where the blackfriars restaurant is going
to set up the business in an effective manner. The main drawback is of the primary source which
is used by the organisation in order to gather the business in an effective manner. The primary
1
Paraphrase This Document
Need a fresh take? Get an instant paraphrase of this document with our AI Paraphraser
source method is much costly as this can only be used by the organisation in order to know the
market in an effective manner. Here, primary source of data collection method is used by the
organisation so that the business can attain the pre-set objectives and company could gain the
sustainable development (Kacprzyk and Fedrizzi, 2012). For gathering the data, company could
use questionnaire, observation, interview etc. now the restaurant needs to make plan so that the
organisation could attain their pre-set objectives in an effective manner.
Secondary sources: This is the secondary tool for collecting the data for making analysis
in an effective manner. However, there is a strong need to know about the business operations in
an effective manner. That is why the secondary data methodology is used by the restaurant. The
secondary data collection method is used when the data requirement is highly required. There are
various tools that can be used by the organisation in order to frame a particular strategy. The
secondary data source is the main tool that can be used by the organisation so that the business
objectives can be achieved. Secondary method is used for making the research easy and data
requirement is high. This data is the best tool which can be used by the organisation in order to
lower the business in an effective manner (Nooraie, 2012). There are various secondary tools
namely: Magazine, newspapers, television and any other tool. Under this report, various tools are
used by the organisation in order to gain the sustainable development.
1.2 Survey methodology and sampling frame used:
For making the proper research, there is a need to have the effective methodologies. This
is the best effective tool by which the solution can be used in order to gain the sustainability in
an effective manner. This is the way through which issues are solved in a systematic manner
which could emerge at the using of new branch. Some of them are:
Descriptive research strategy is used by the researcher in order to convene the survey and
organise research which intentionally to identify the facts which could render state of affairs as
this reflects in a research work (Saaty and Peniwati, 2013). On the other hand, analytical research
is the base of research practices which is totally different from the other kinds of research
practices. On the other hand, researcher is based on the basis of established data for making the
vital assessment of the material.
Exploratory research tool is the main tool which simply aim to research survey areas and
they could attempts to serving the offer final answers to a research questions.
2
Quantitative and qualitative data tools: this is the research methodology which
completely assess the data which have been measured from the diverse consumers in an effective
manner. This is rightly said that that by measuring the diverse statistical tools (Crowfoot and
Wondolleck, 2012). On the other hand, diverse tools are concerned to the quality of research
done by the organisation.
Sampling Frameworks: For the aim of assessing positive results from a research
activities, this is totally crucial to collect the similar samples from the available group of
consumers. This is likewise divided into the diverse parts.
Random sampling: This is the highly efficient sampling tools that is implemented over a
selected number of people out of the total group (March, 2013). This is totally free from biase
tools which is assisted in any complex situations. There are various other sampling tools like-
Quota, stratified, cluster sampling method. As per this research tool, a total of 60 respondents
were chosen from the total population. There are some of the helpful aspects which contains the
research form. These are mentioned hereunder:
Price which could easily afford
Quality in service
Hospitality delivering by their employees
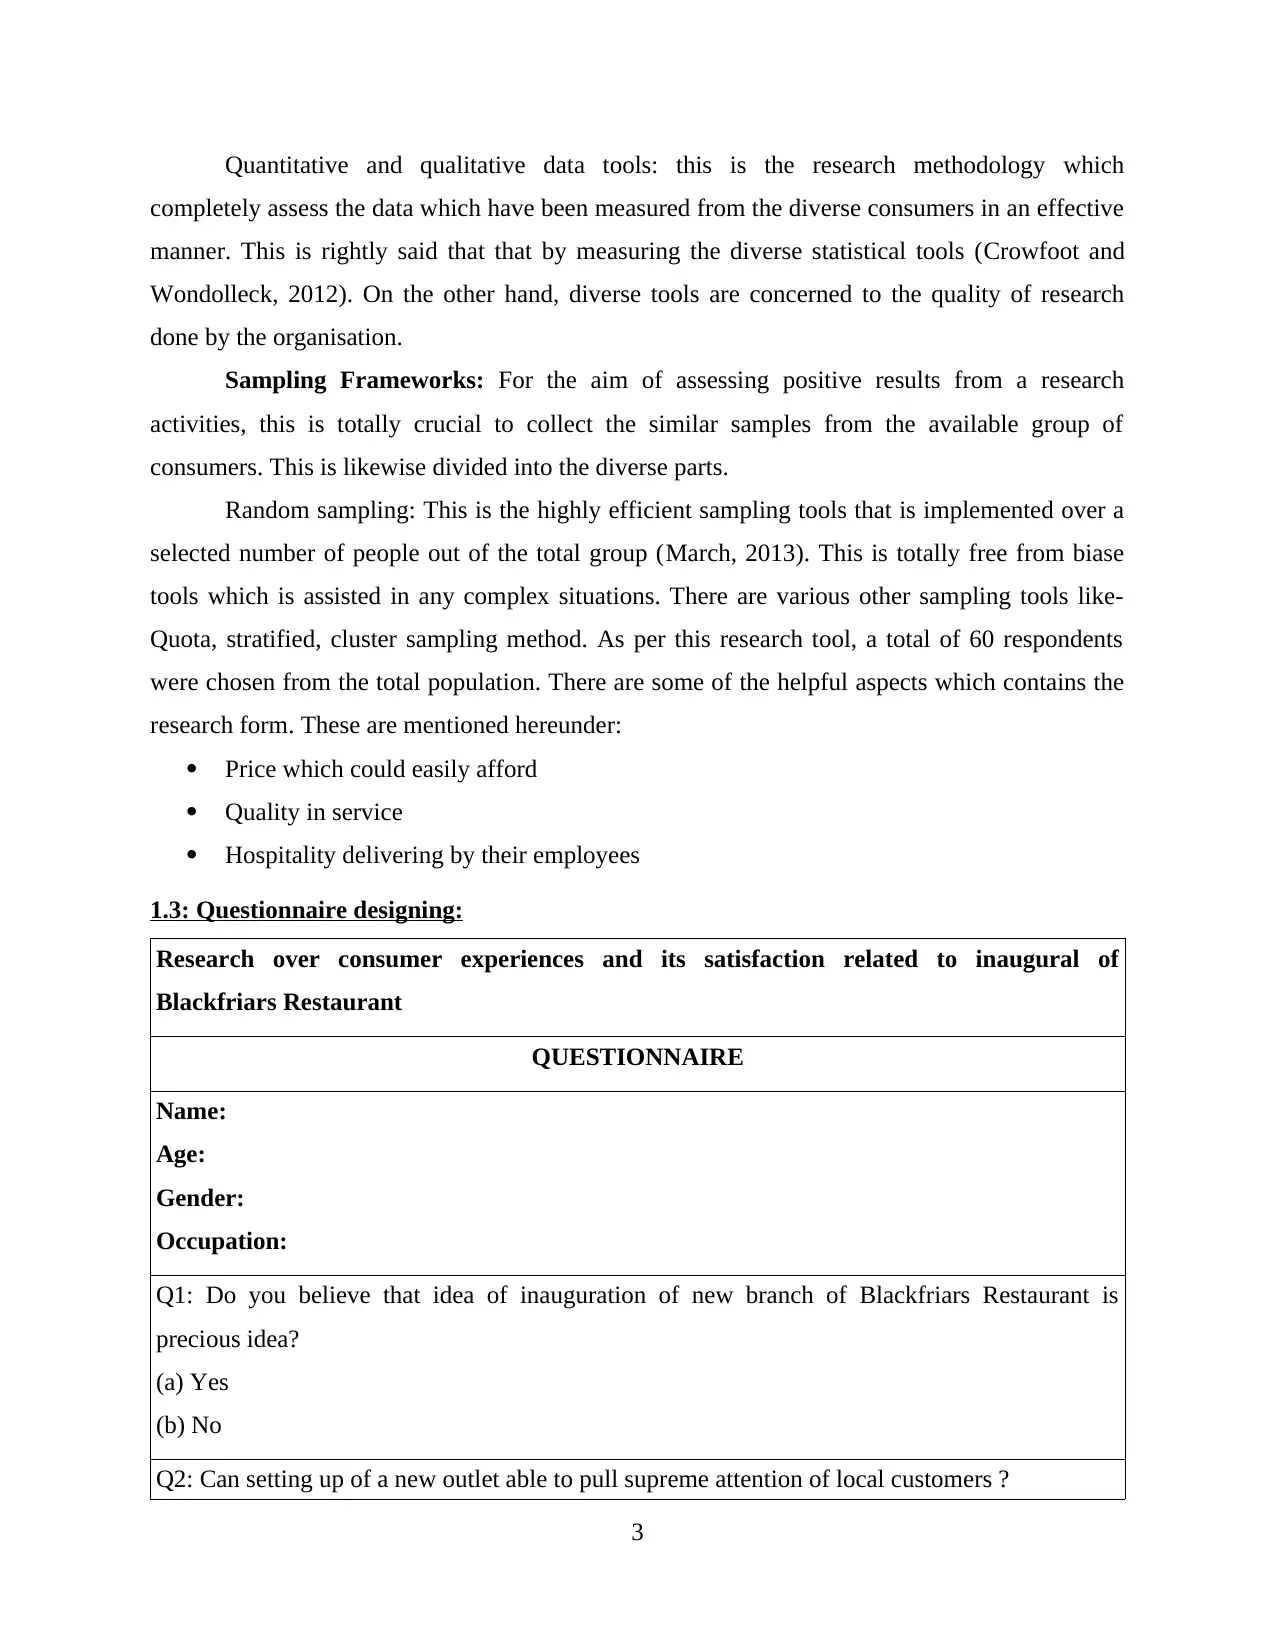
1.3: Questionnaire designing:
Research over consumer experiences and its satisfaction related to inaugural of
Blackfriars Restaurant
QUESTIONNAIRE
Name:
Age:
Gender:
Occupation:
Q1: Do you believe that idea of inauguration of new branch of Blackfriars Restaurant is
precious idea?
(a) Yes
(b) No
Q2: Can setting up of a new outlet able to pull supreme attention of local customers ?
3
completely assess the data which have been measured from the diverse consumers in an effective
manner. This is rightly said that that by measuring the diverse statistical tools (Crowfoot and
Wondolleck, 2012). On the other hand, diverse tools are concerned to the quality of research
done by the organisation.
Sampling Frameworks: For the aim of assessing positive results from a research
activities, this is totally crucial to collect the similar samples from the available group of
consumers. This is likewise divided into the diverse parts.
Random sampling: This is the highly efficient sampling tools that is implemented over a
selected number of people out of the total group (March, 2013). This is totally free from biase
tools which is assisted in any complex situations. There are various other sampling tools like-
Quota, stratified, cluster sampling method. As per this research tool, a total of 60 respondents
were chosen from the total population. There are some of the helpful aspects which contains the
research form. These are mentioned hereunder:
Price which could easily afford
Quality in service
Hospitality delivering by their employees
1.3: Questionnaire designing:
Research over consumer experiences and its satisfaction related to inaugural of
Blackfriars Restaurant
QUESTIONNAIRE
Name:
Age:
Gender:
Occupation:
Q1: Do you believe that idea of inauguration of new branch of Blackfriars Restaurant is
precious idea?
(a) Yes
(b) No
Q2: Can setting up of a new outlet able to pull supreme attention of local customers ?
3
⊘ This is a preview!⊘
Do you want full access?
Subscribe today to unlock all pages.
Trusted by 1+ million students worldwide
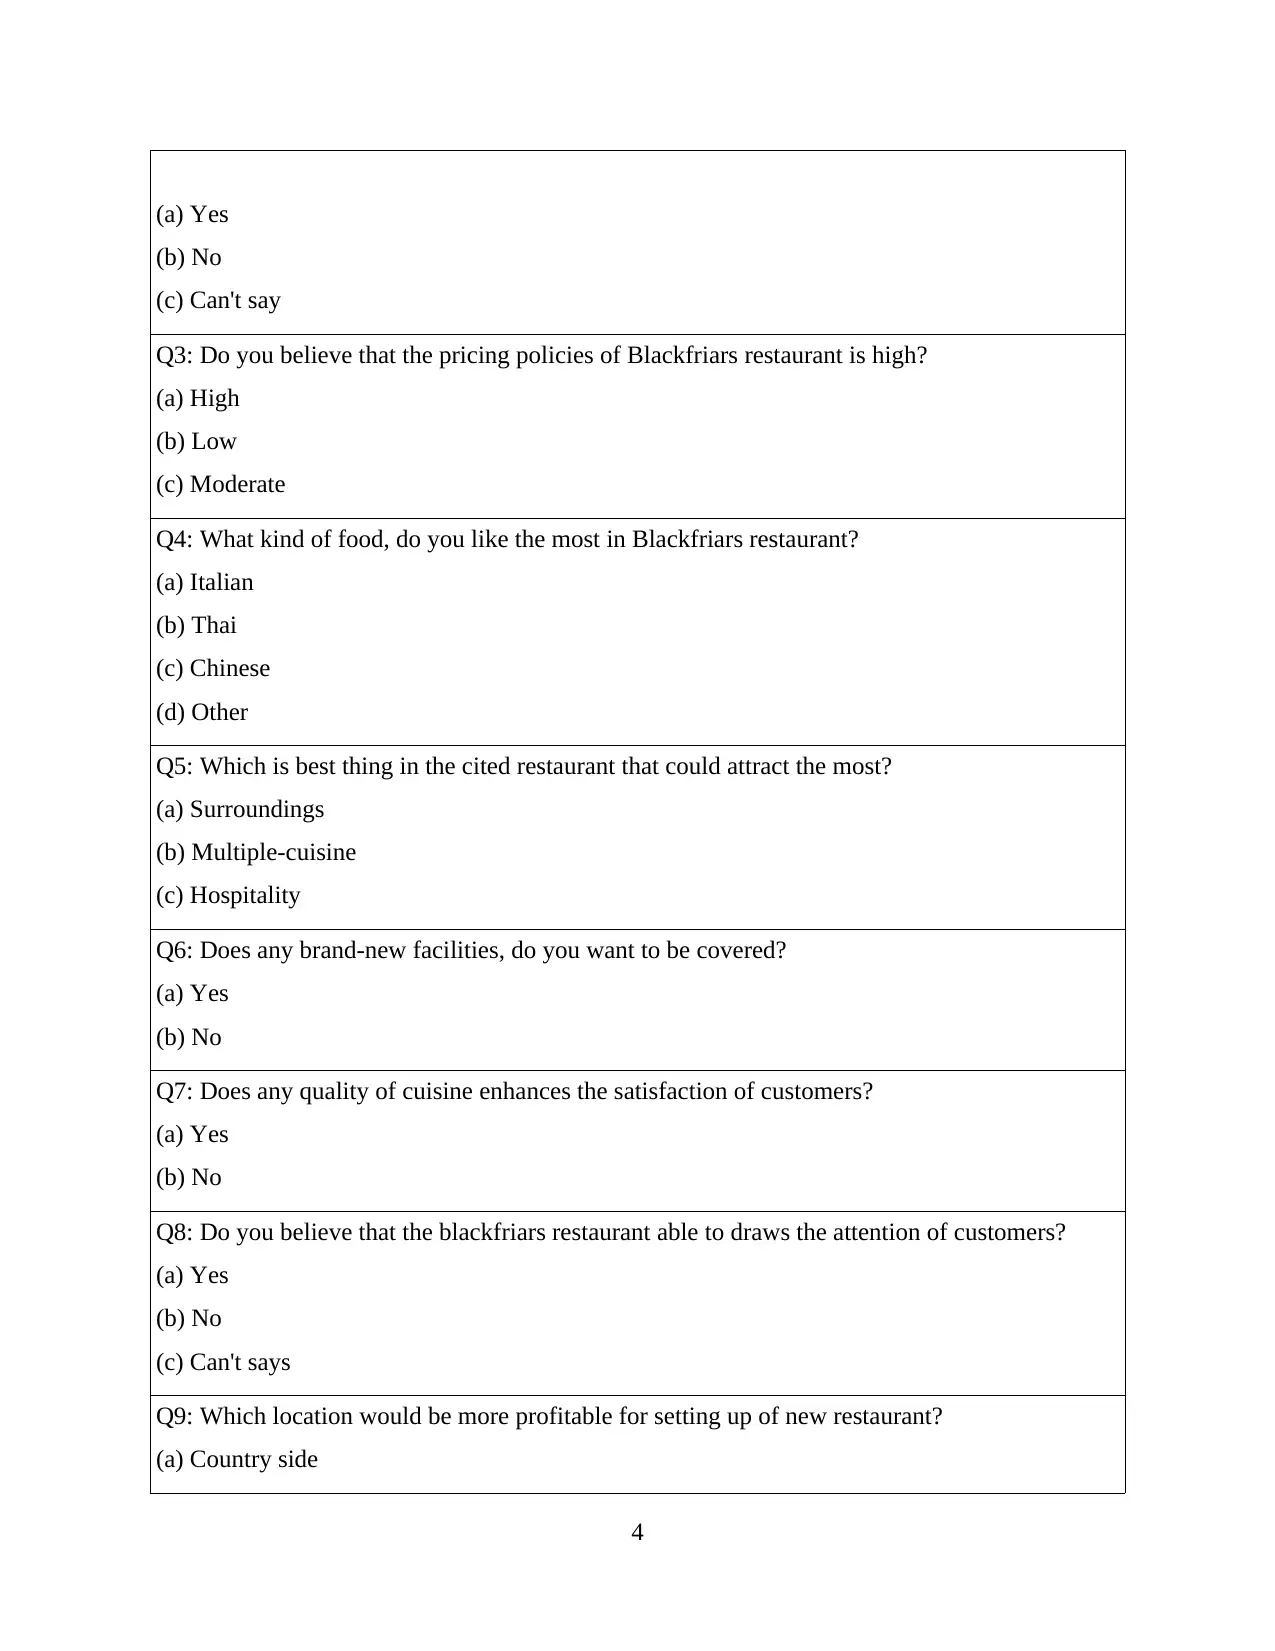
(a) Yes
(b) No
(c) Can't say
Q3: Do you believe that the pricing policies of Blackfriars restaurant is high?
(a) High
(b) Low
(c) Moderate
Q4: What kind of food, do you like the most in Blackfriars restaurant?
(a) Italian
(b) Thai
(c) Chinese
(d) Other
Q5: Which is best thing in the cited restaurant that could attract the most?
(a) Surroundings
(b) Multiple-cuisine
(c) Hospitality
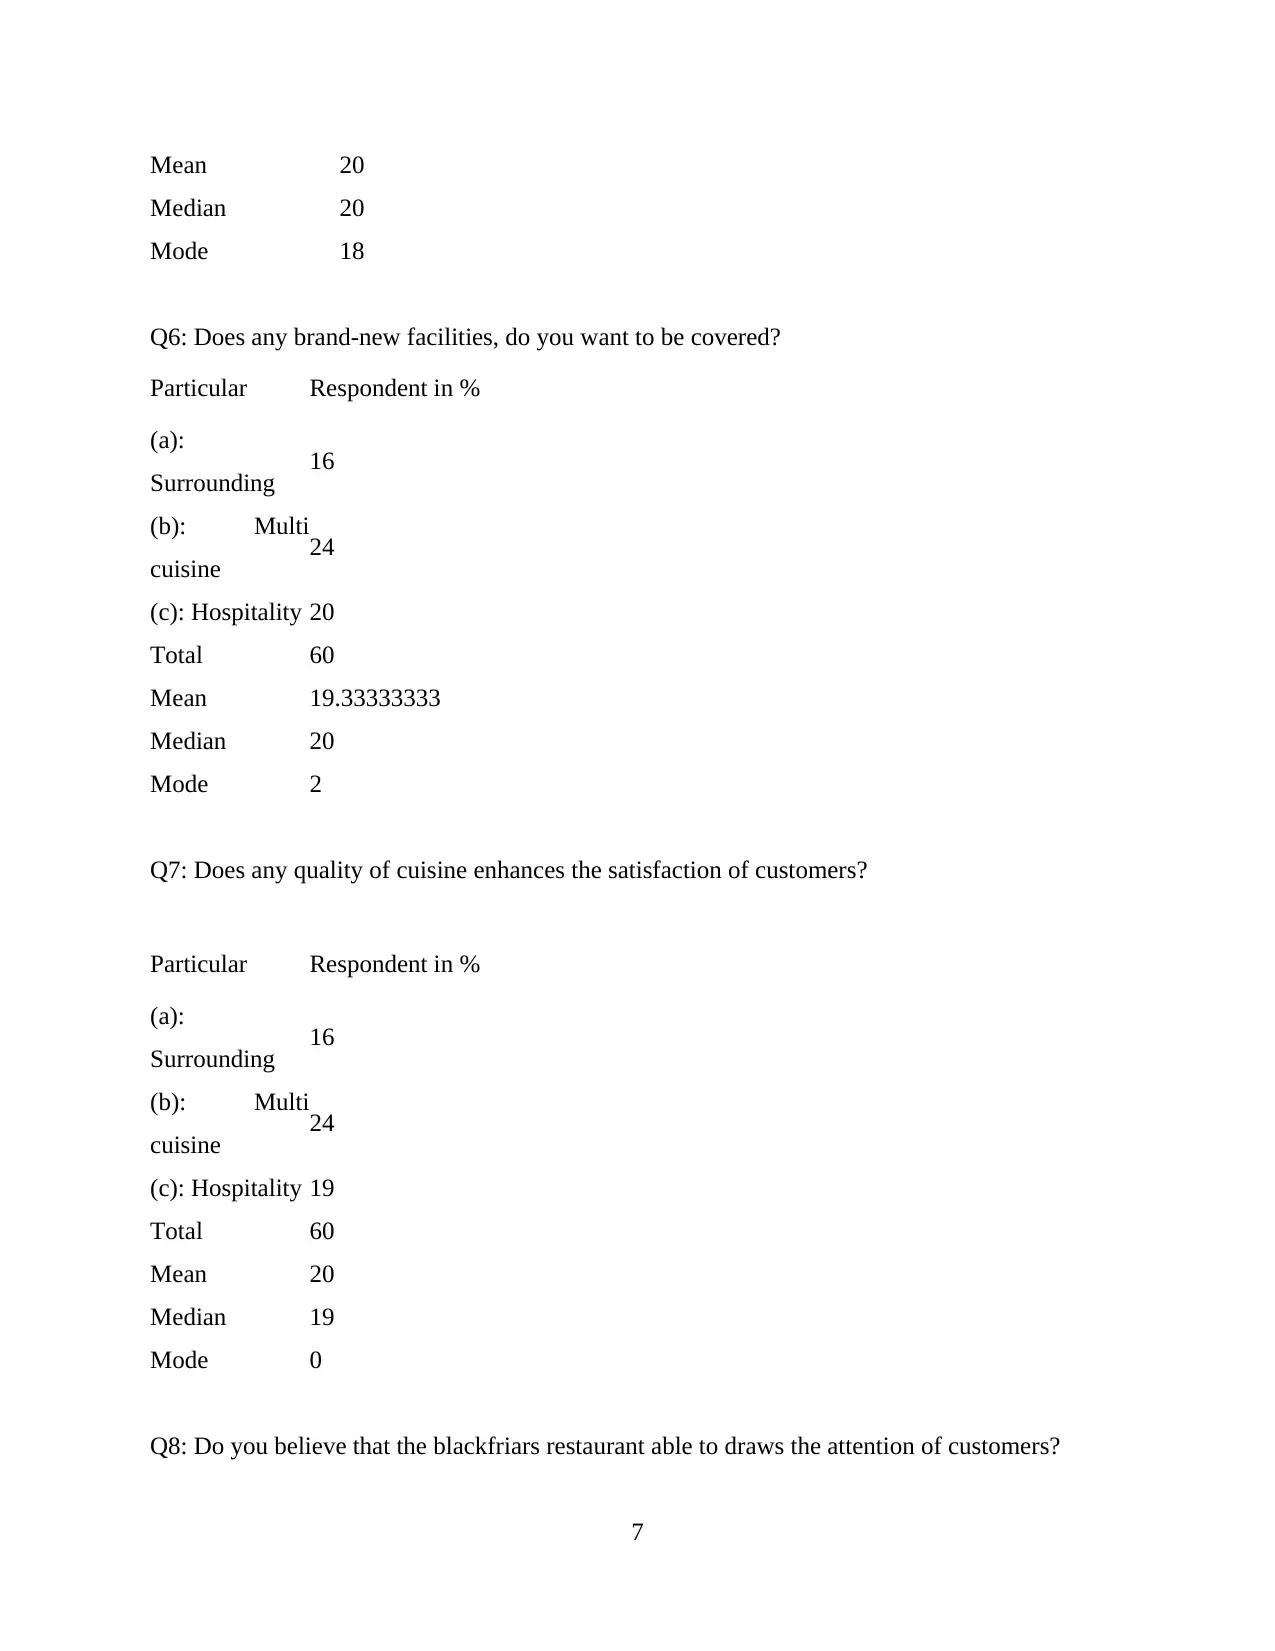
Q6: Does any brand-new facilities, do you want to be covered?
(a) Yes
(b) No
Q7: Does any quality of cuisine enhances the satisfaction of customers?
(a) Yes
(b) No
Q8: Do you believe that the blackfriars restaurant able to draws the attention of customers?
(a) Yes
(b) No
(c) Can't says
Q9: Which location would be more profitable for setting up of new restaurant?
(a) Country side
4
(b) No
(c) Can't say
Q3: Do you believe that the pricing policies of Blackfriars restaurant is high?
(a) High
(b) Low
(c) Moderate
Q4: What kind of food, do you like the most in Blackfriars restaurant?
(a) Italian
(b) Thai
(c) Chinese
(d) Other
Q5: Which is best thing in the cited restaurant that could attract the most?
(a) Surroundings
(b) Multiple-cuisine
(c) Hospitality
Q6: Does any brand-new facilities, do you want to be covered?
(a) Yes
(b) No
Q7: Does any quality of cuisine enhances the satisfaction of customers?
(a) Yes
(b) No
Q8: Do you believe that the blackfriars restaurant able to draws the attention of customers?
(a) Yes
(b) No
(c) Can't says
Q9: Which location would be more profitable for setting up of new restaurant?
(a) Country side
4
Paraphrase This Document
Need a fresh take? Get an instant paraphrase of this document with our AI Paraphraser
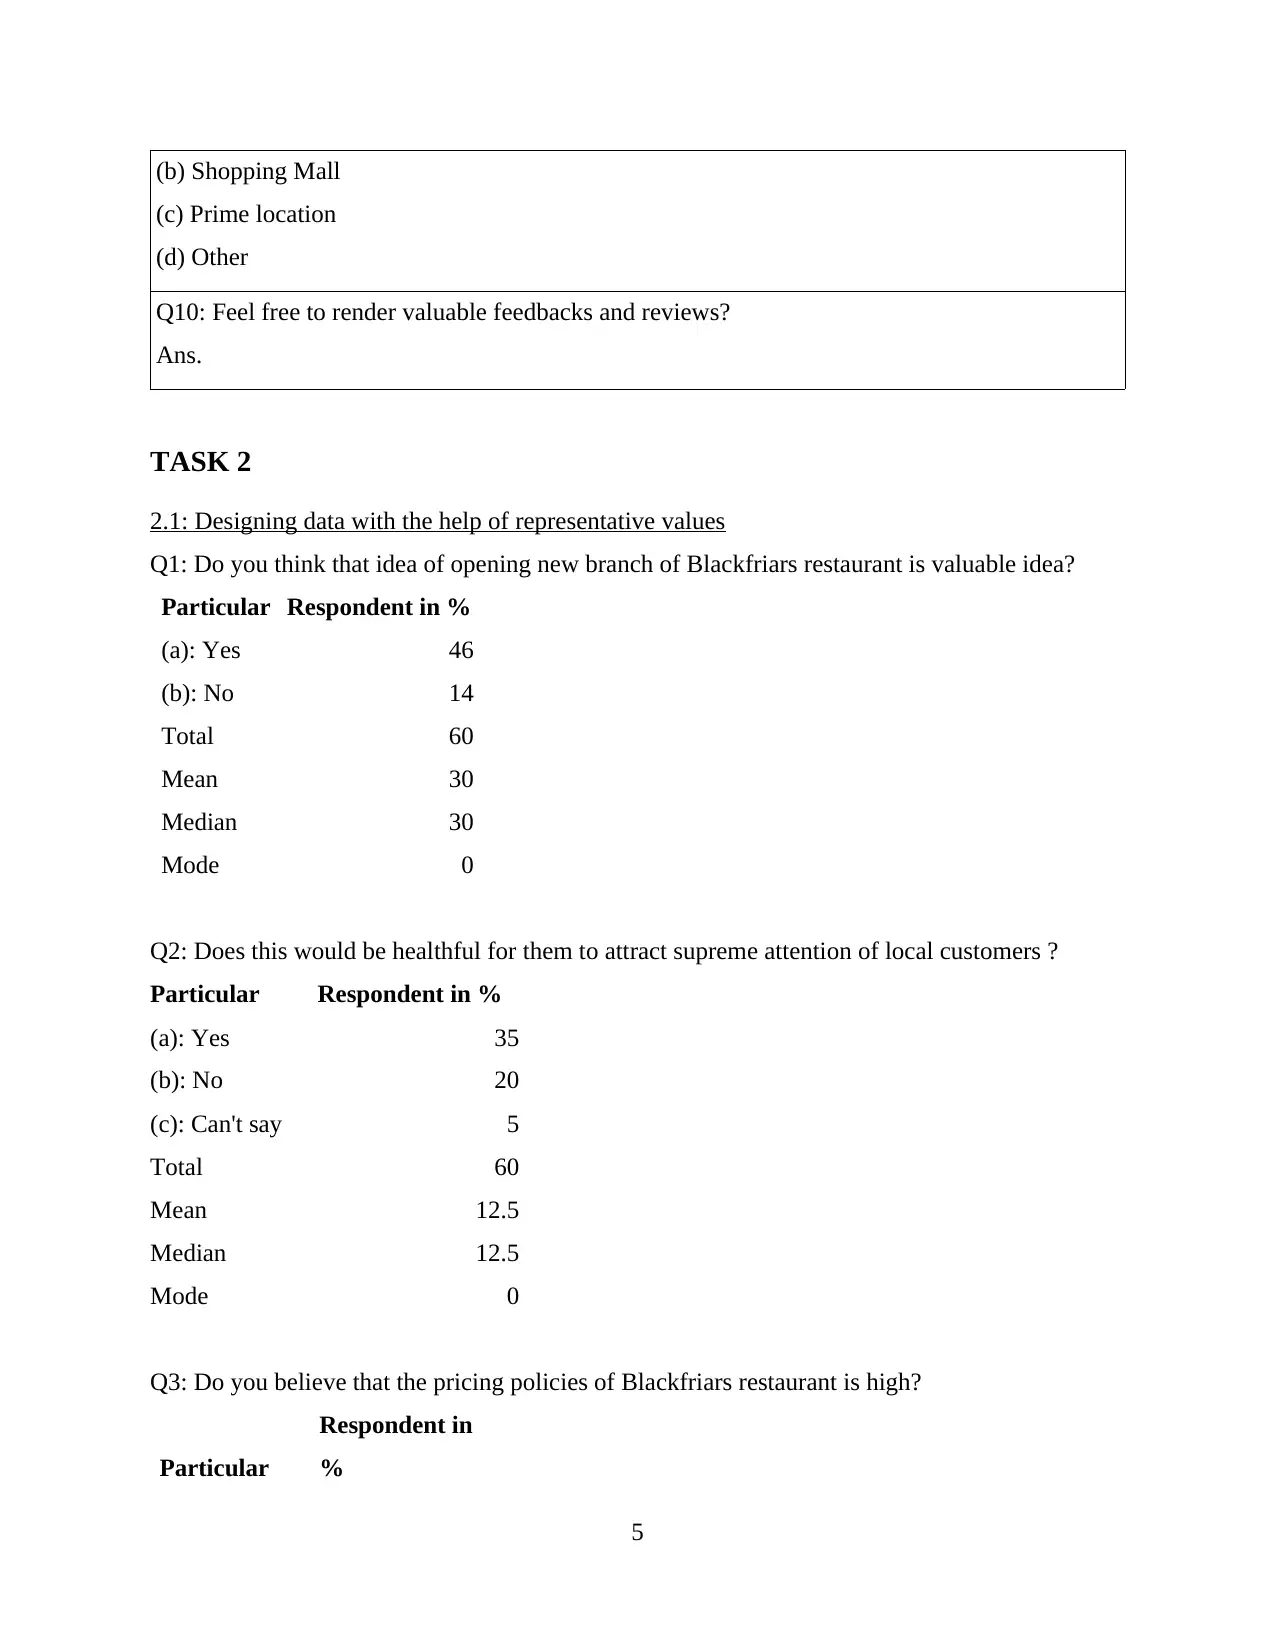
(b) Shopping Mall
(c) Prime location
(d) Other
Q10: Feel free to render valuable feedbacks and reviews?
Ans.
TASK 2
2.1: Designing data with the help of representative values
Q1: Do you think that idea of opening new branch of Blackfriars restaurant is valuable idea?
Particular Respondent in %
(a): Yes 46
(b): No 14
Total 60
Mean 30
Median 30
Mode 0
Q2: Does this would be healthful for them to attract supreme attention of local customers ?
Particular Respondent in %
(a): Yes 35
(b): No 20
(c): Can't say 5
Total 60
Mean 12.5
Median 12.5
Mode 0
Q3: Do you believe that the pricing policies of Blackfriars restaurant is high?
Particular
Respondent in
%
5
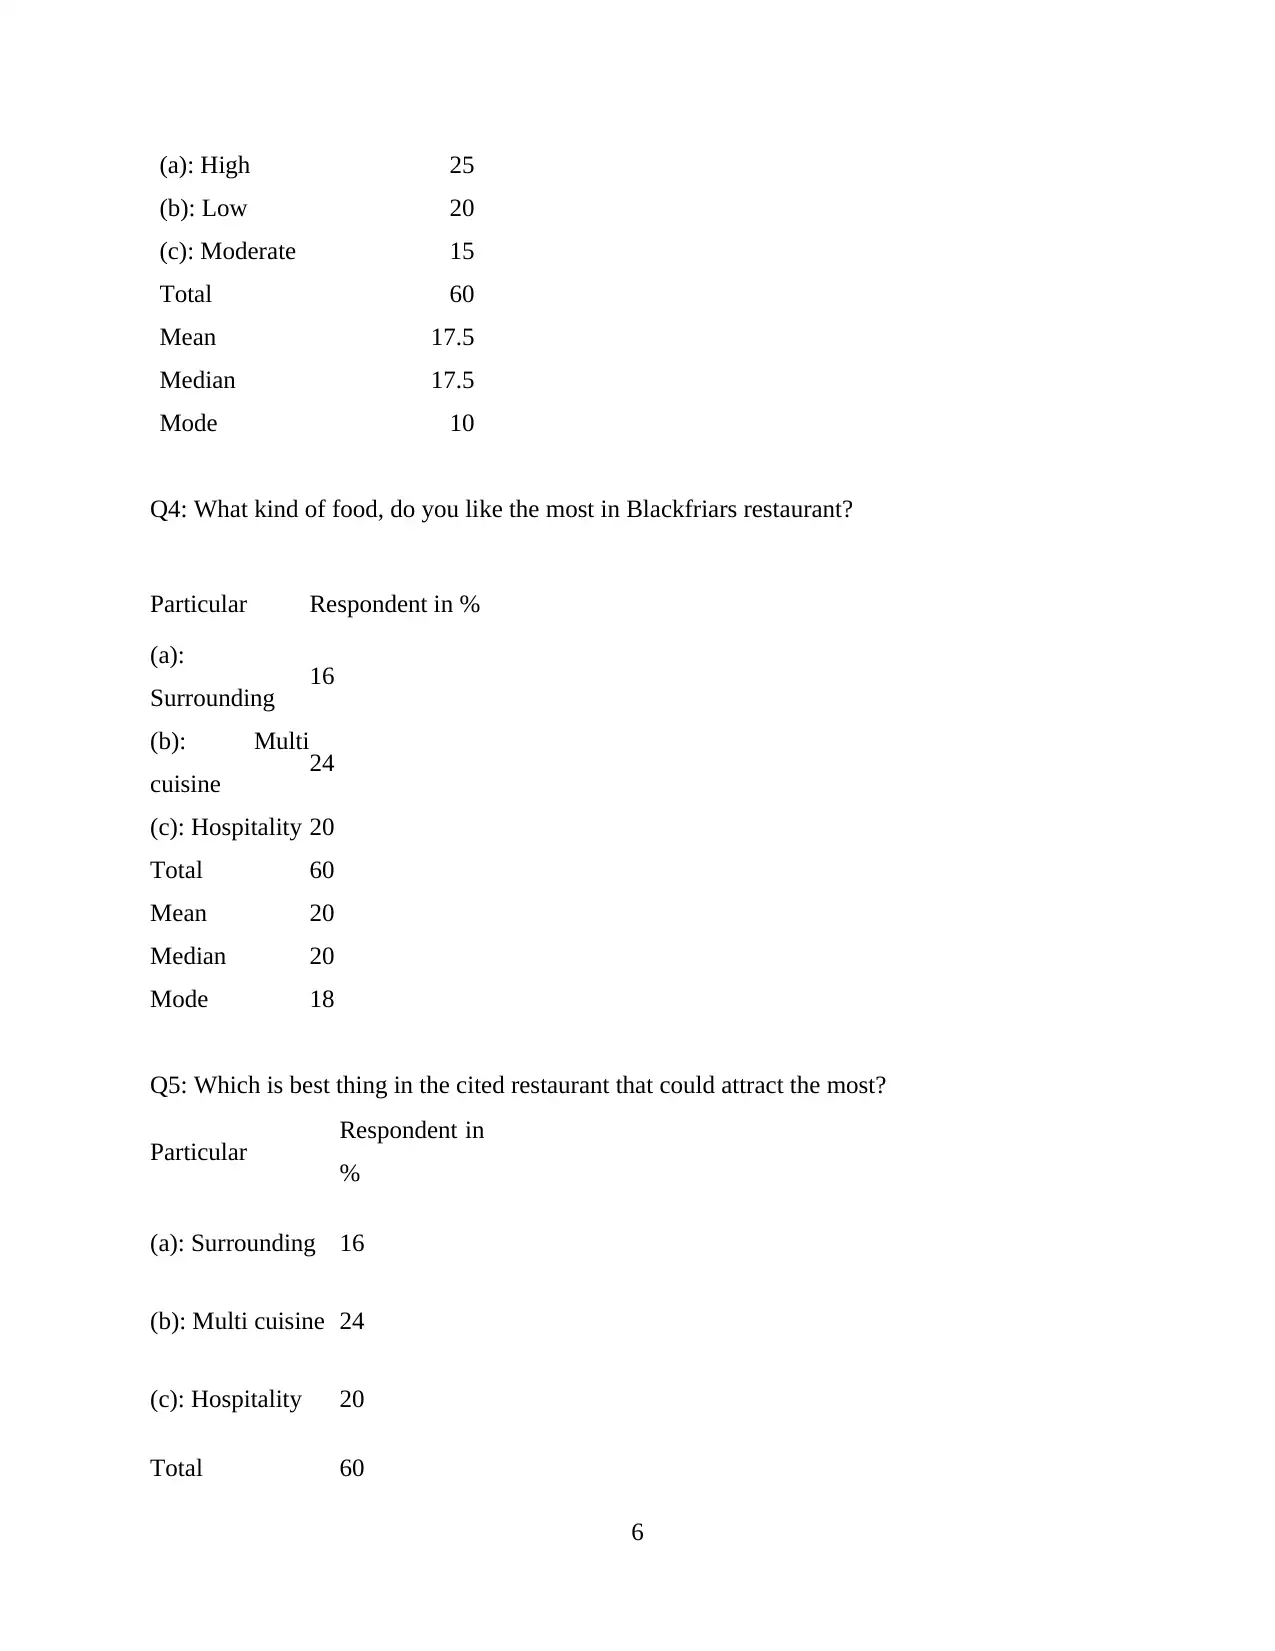
(a): High 25
(b): Low 20
(c): Moderate 15
Total 60
Mean 17.5
Median 17.5
Mode 10
Q4: What kind of food, do you like the most in Blackfriars restaurant?
Particular Respondent in %
(a):
Surrounding 16
(b): Multi
cuisine 24
(c): Hospitality 20
Total 60
Mean 20
Median 20
Mode 18
Q5: Which is best thing in the cited restaurant that could attract the most?
Particular Respondent in
%
(a): Surrounding 16
(b): Multi cuisine 24
(c): Hospitality 20
Total 60
6
⊘ This is a preview!⊘
Do you want full access?
Subscribe today to unlock all pages.
Trusted by 1+ million students worldwide
Mean 20
Median 20
Mode 18
Q6: Does any brand-new facilities, do you want to be covered?
Particular Respondent in %
(a):
Surrounding 16
(b): Multi
cuisine 24
(c): Hospitality 20
Total 60
Mean 19.33333333
Median 20
Mode 2
Q7: Does any quality of cuisine enhances the satisfaction of customers?
Particular Respondent in %
(a):
Surrounding 16
(b): Multi
cuisine 24
(c): Hospitality 19
Total 60
Mean 20
Median 19
Mode 0
Q8: Do you believe that the blackfriars restaurant able to draws the attention of customers?
7
Median 20
Mode 18
Q6: Does any brand-new facilities, do you want to be covered?
Particular Respondent in %
(a):
Surrounding 16
(b): Multi
cuisine 24
(c): Hospitality 20
Total 60
Mean 19.33333333
Median 20
Mode 2
Q7: Does any quality of cuisine enhances the satisfaction of customers?
Particular Respondent in %
(a):
Surrounding 16
(b): Multi
cuisine 24
(c): Hospitality 19
Total 60
Mean 20
Median 19
Mode 0
Q8: Do you believe that the blackfriars restaurant able to draws the attention of customers?
7
Paraphrase This Document
Need a fresh take? Get an instant paraphrase of this document with our AI Paraphraser
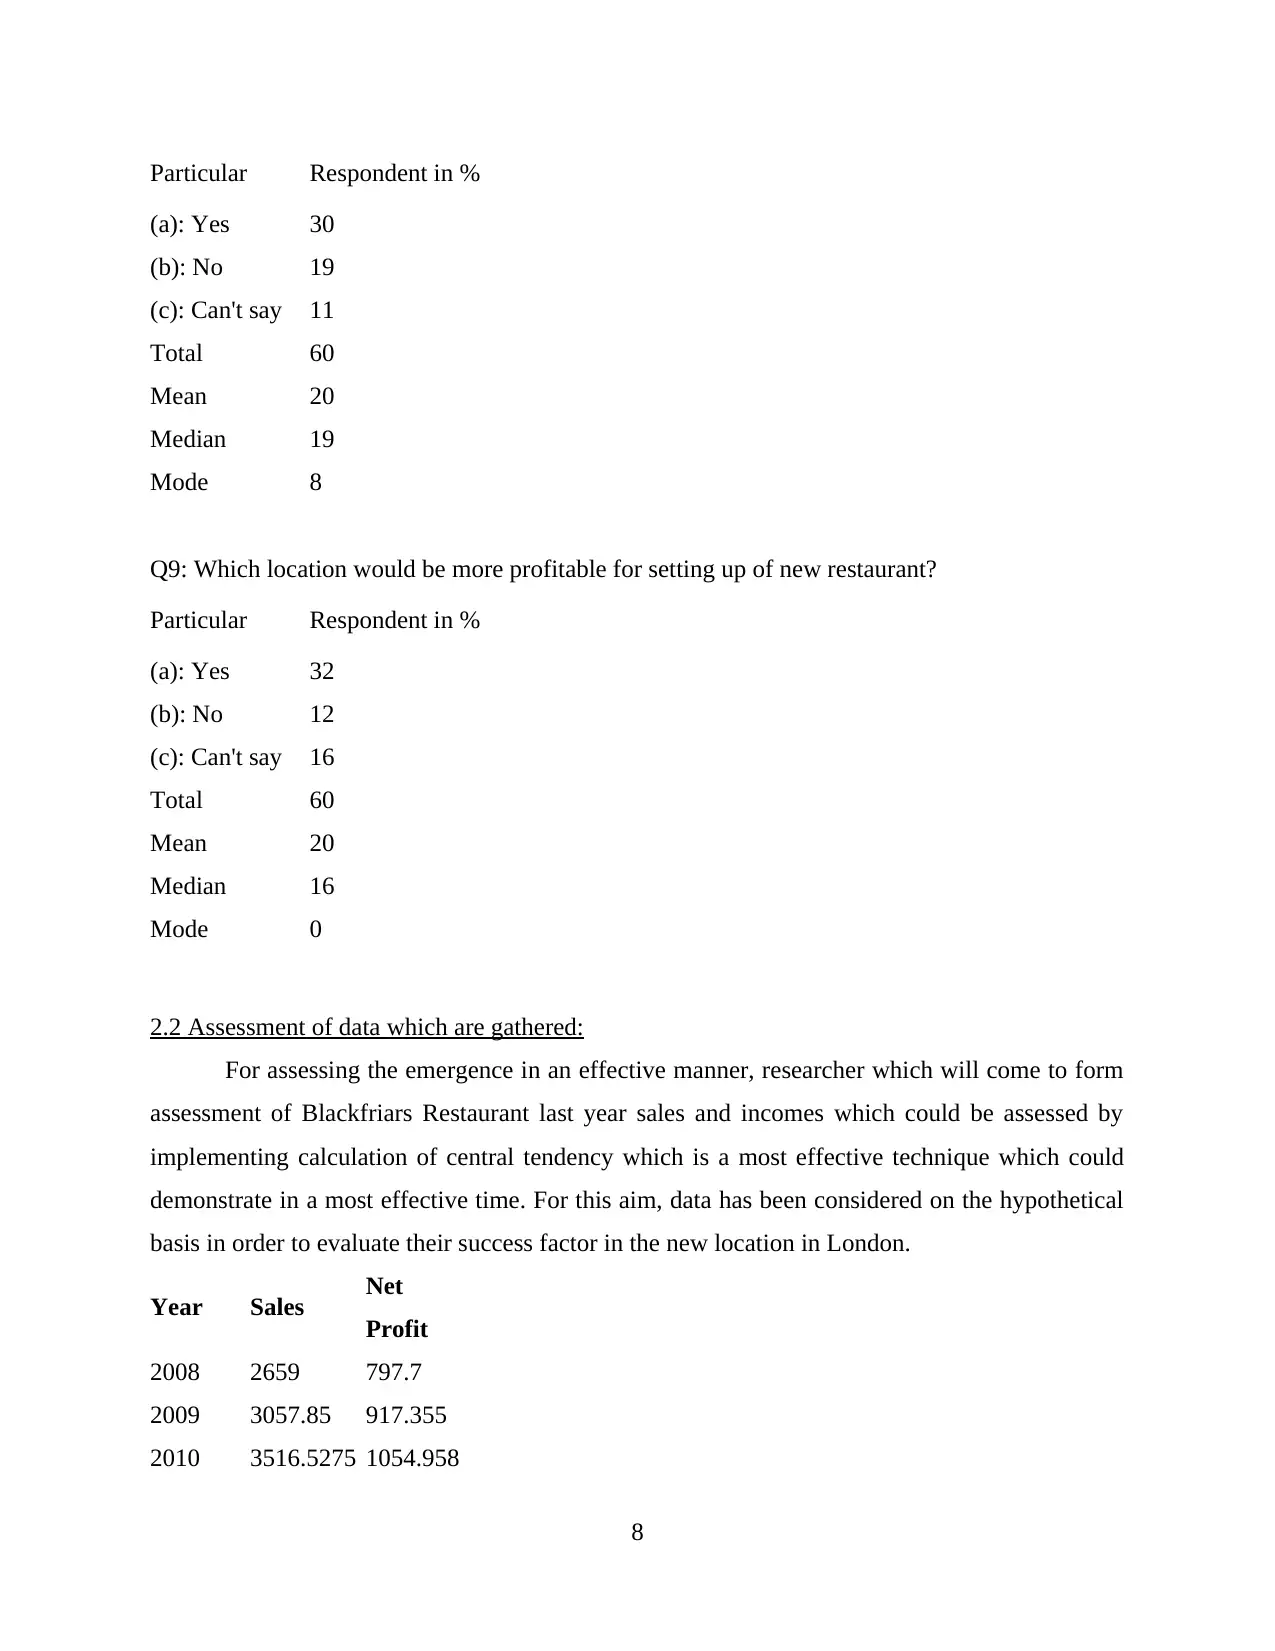
Particular Respondent in %
(a): Yes 30
(b): No 19
(c): Can't say 11
Total 60
Mean 20
Median 19
Mode 8
Q9: Which location would be more profitable for setting up of new restaurant?
Particular Respondent in %
(a): Yes 32
(b): No 12
(c): Can't say 16
Total 60
Mean 20
Median 16
Mode 0
2.2 Assessment of data which are gathered:
For assessing the emergence in an effective manner, researcher which will come to form
assessment of Blackfriars Restaurant last year sales and incomes which could be assessed by
implementing calculation of central tendency which is a most effective technique which could
demonstrate in a most effective time. For this aim, data has been considered on the hypothetical
basis in order to evaluate their success factor in the new location in London.
Year Sales Net
Profit
2008 2659 797.7
2009 3057.85 917.355
2010 3516.5275 1054.958
8
2011 4044.0066 1213.202
2012 4650.6076 1395.182
2013 5348.1988 1604.46
2014 6150.4286 1845.129
2015 7072.9929 2121.898
2016 8133.9418 2440.183
2017 9354.0331 2806.21
Sales Net Profits
Mean 5398.75868 1619.627604
Median 4999.403191499.820957
Mode 2659 797.7
Mean: This is the average set of data which is used by the organisation in order to assess the
results in an effective manner. Basically, this can be said that the company can use their business
organisation in an efficient manner (Shapiro and Stefkovich, 2016). This the average number out
of data set of observation that can be used by the organisation in an effective manner. Here,
mean of the sales and net profits are: 5398.75868 and 1619.627604.
Median: This is the middle number of data out of the set of observation. Median is the most
effective tool that can be used by the organisation in order to gain the sustainability in an
efficient manner. Here, 4999.40319 and 1499.820957 (Mean, Median, Mode and Range.,2017).
Mode: This is the most repetitive number which can be used by the organisation in an effective
manner. Here, the mode for the sales and net profits are: 2659 and 797.7
2.3 Assessing measure of dispersion:
Year Sales Net Profit
2008 2659 797.7
2009 3057.85 917.355
2010 3516.5275 1054.95825
2011 4044.0066 1213.20199
2012 4650.6076 1395.18229
9
⊘ This is a preview!⊘
Do you want full access?
Subscribe today to unlock all pages.
Trusted by 1+ million students worldwide
1 out of 24
Related Documents


Your All-in-One AI-Powered Toolkit for Academic Success.
+13062052269
info@desklib.com
Available 24*7 on WhatsApp / Email
![[object Object]](/_next/static/media/star-bottom.7253800d.svg)
Unlock your academic potential
Copyright © 2020–2026 A2Z Services. All Rights Reserved. Developed and managed by ZUCOL.