Business Decision Making Project: Blackfriars Restaurant - HND Level 5

Verified

Added on  2023/03/24

|9
|438
|64
Project
AI Summary
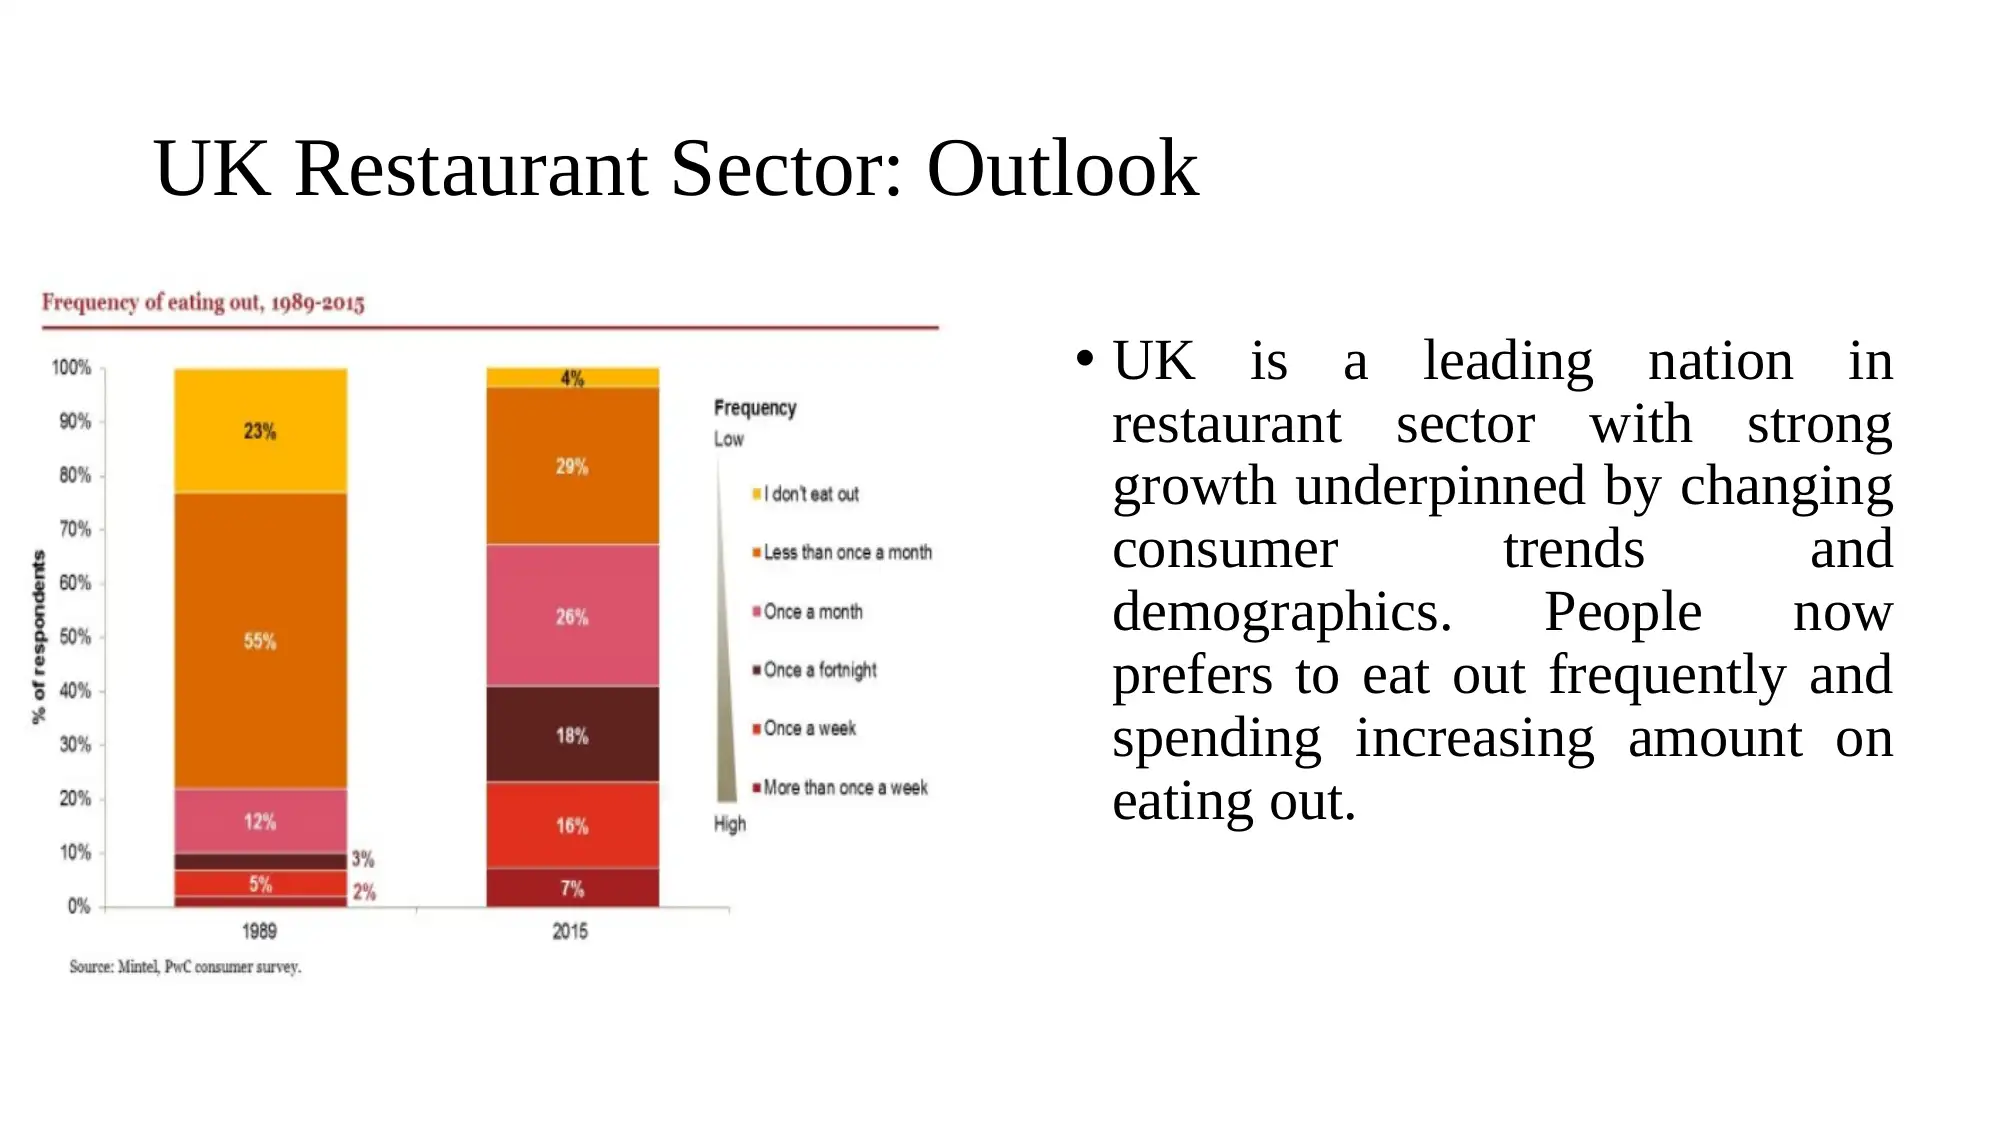
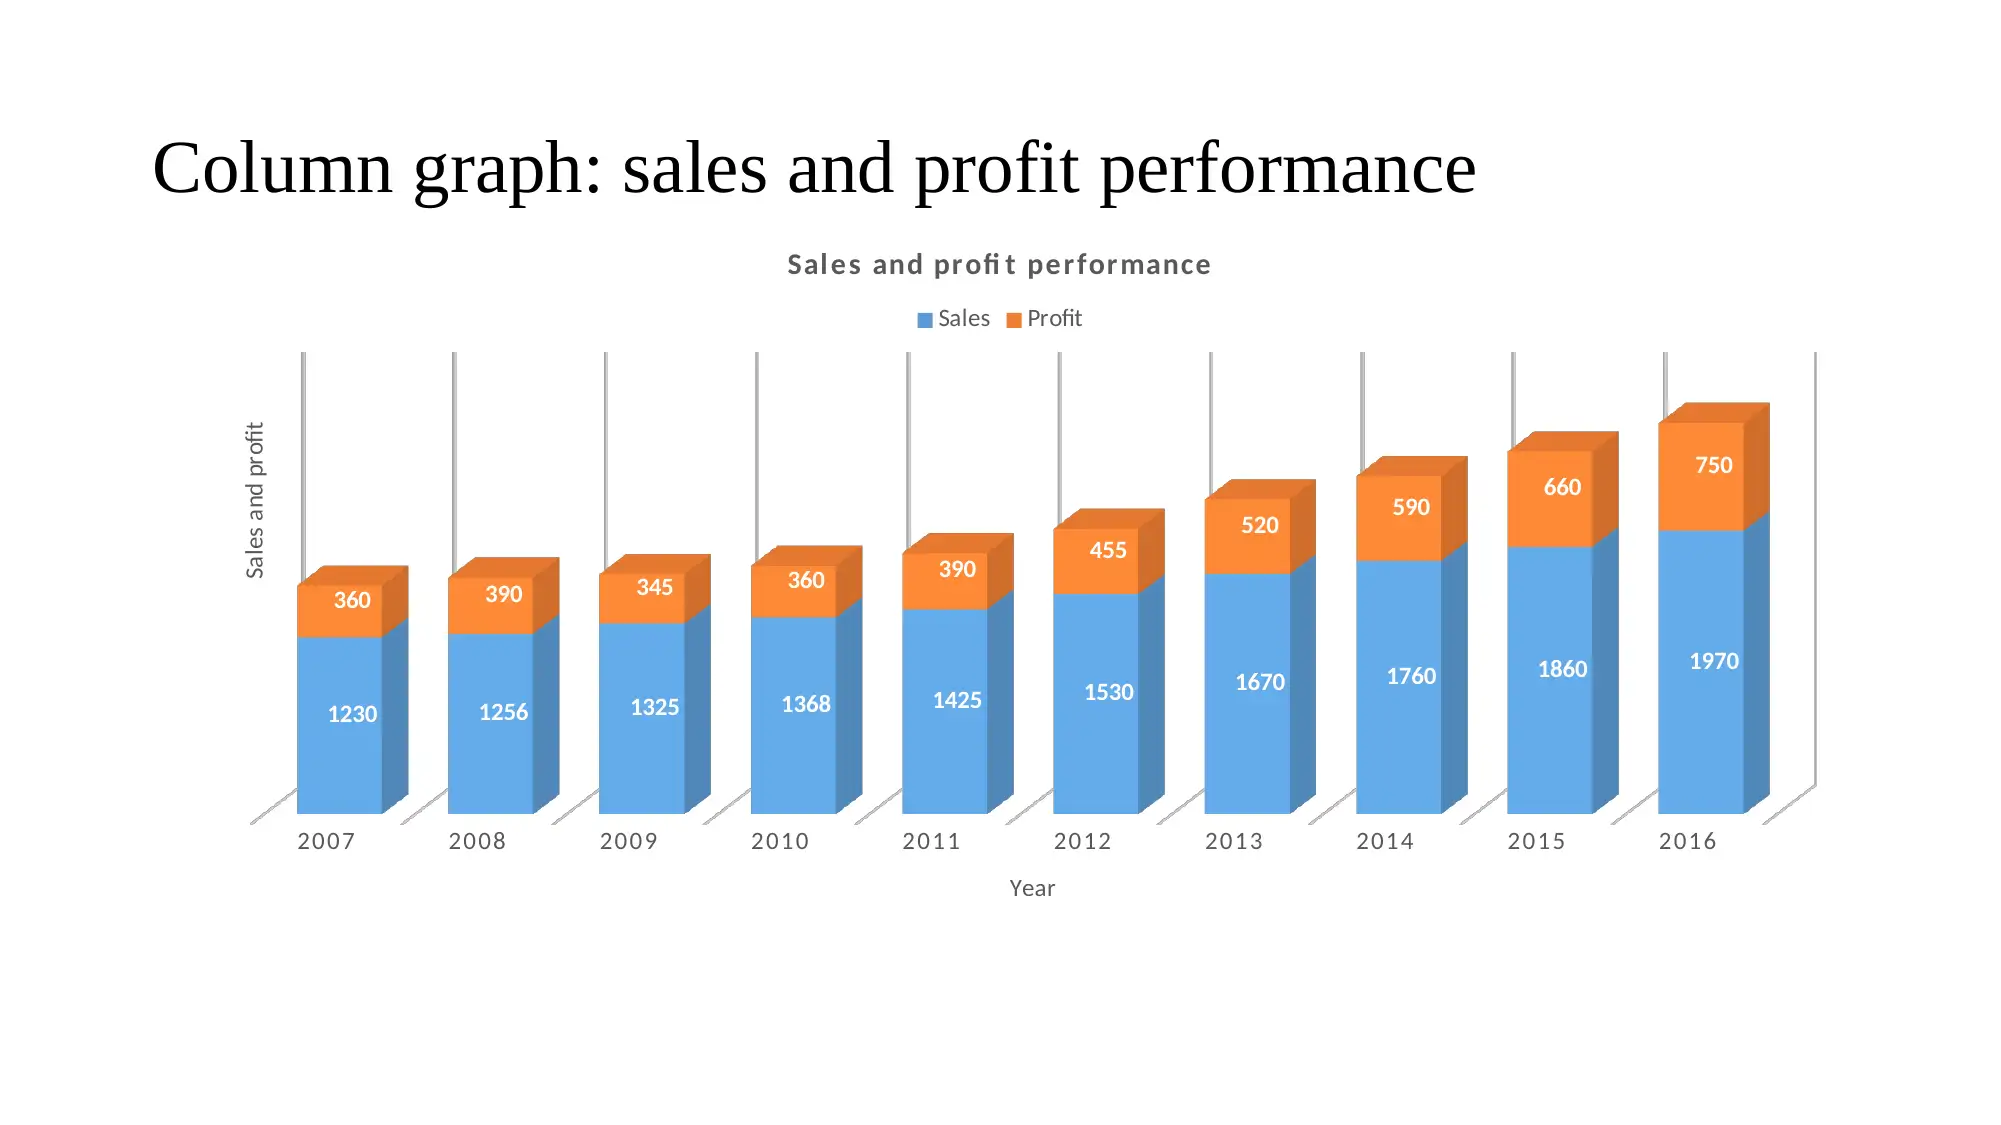
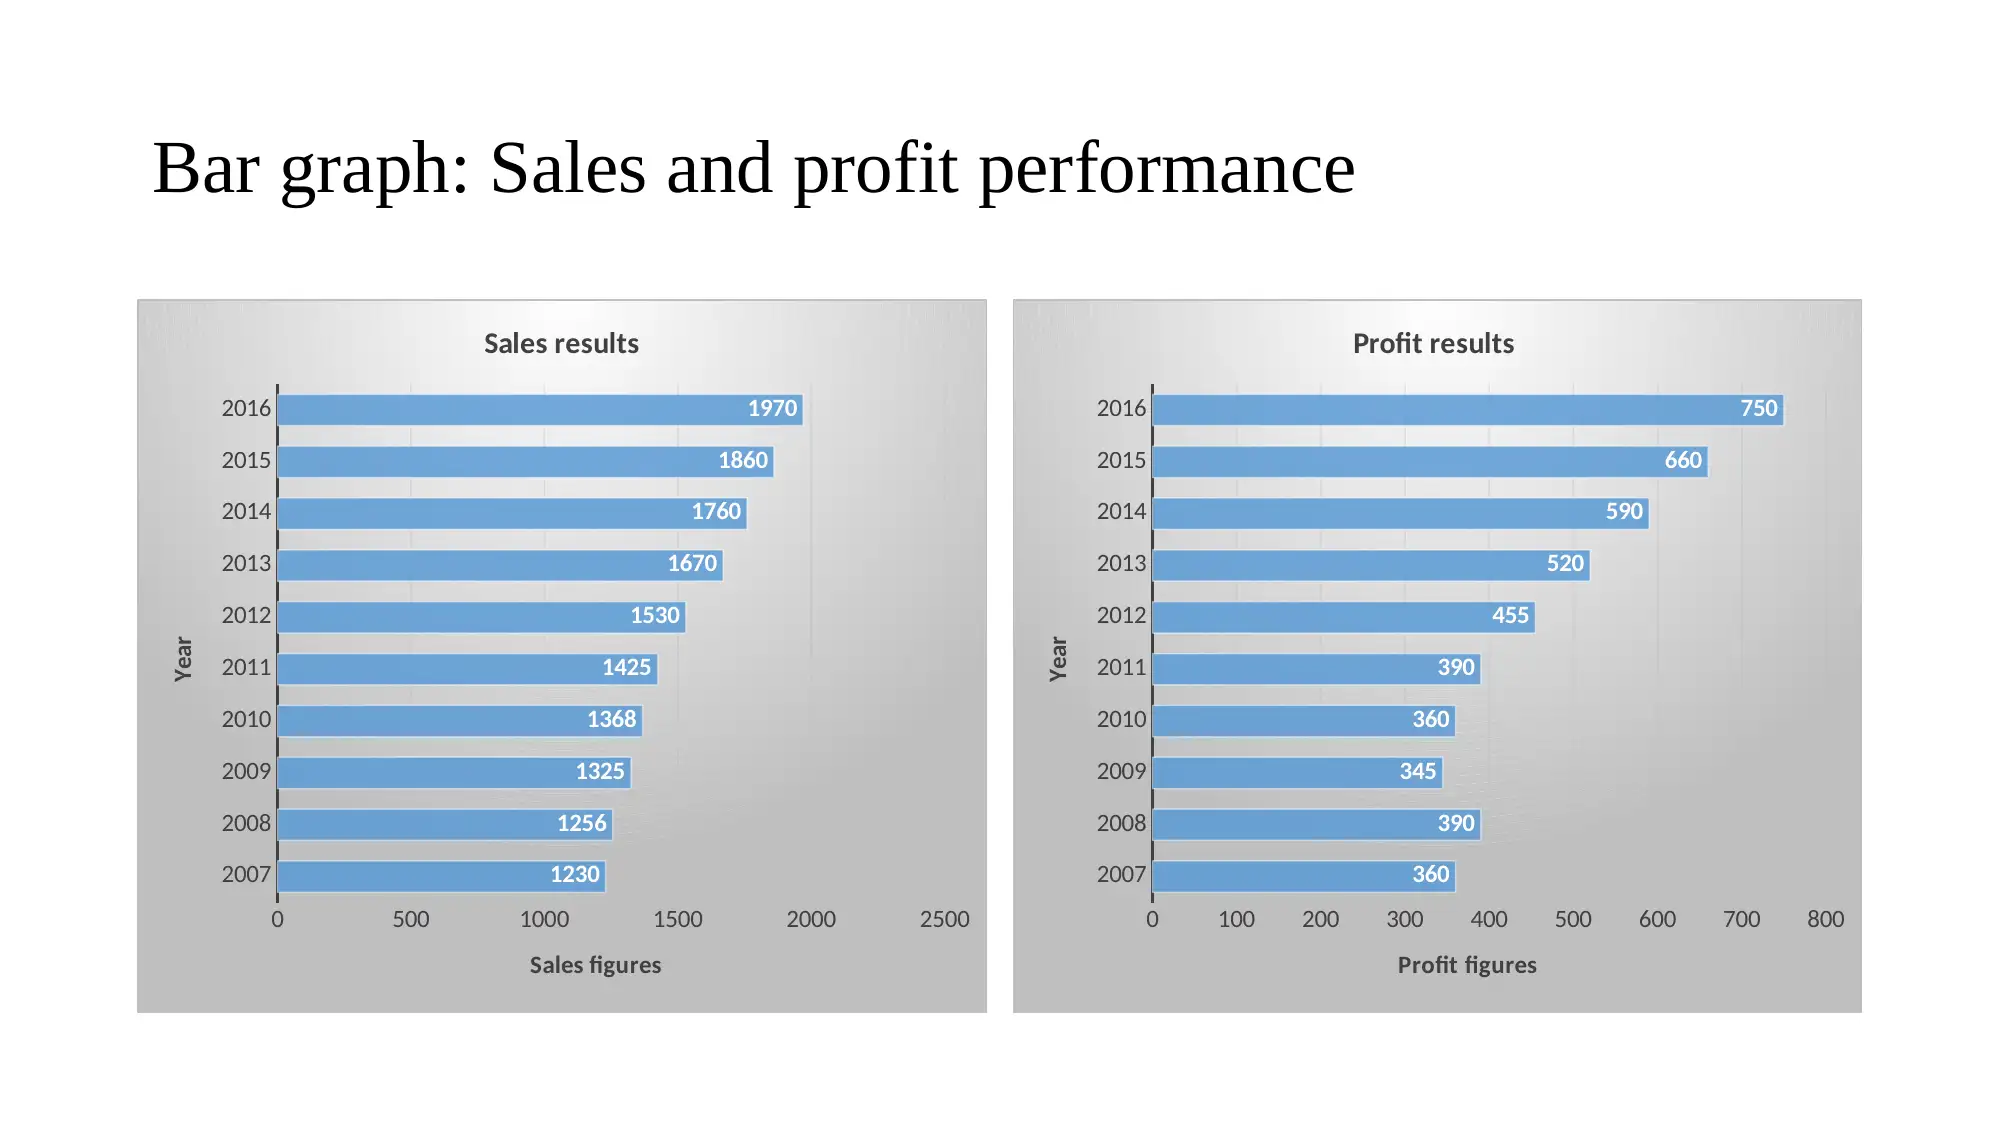
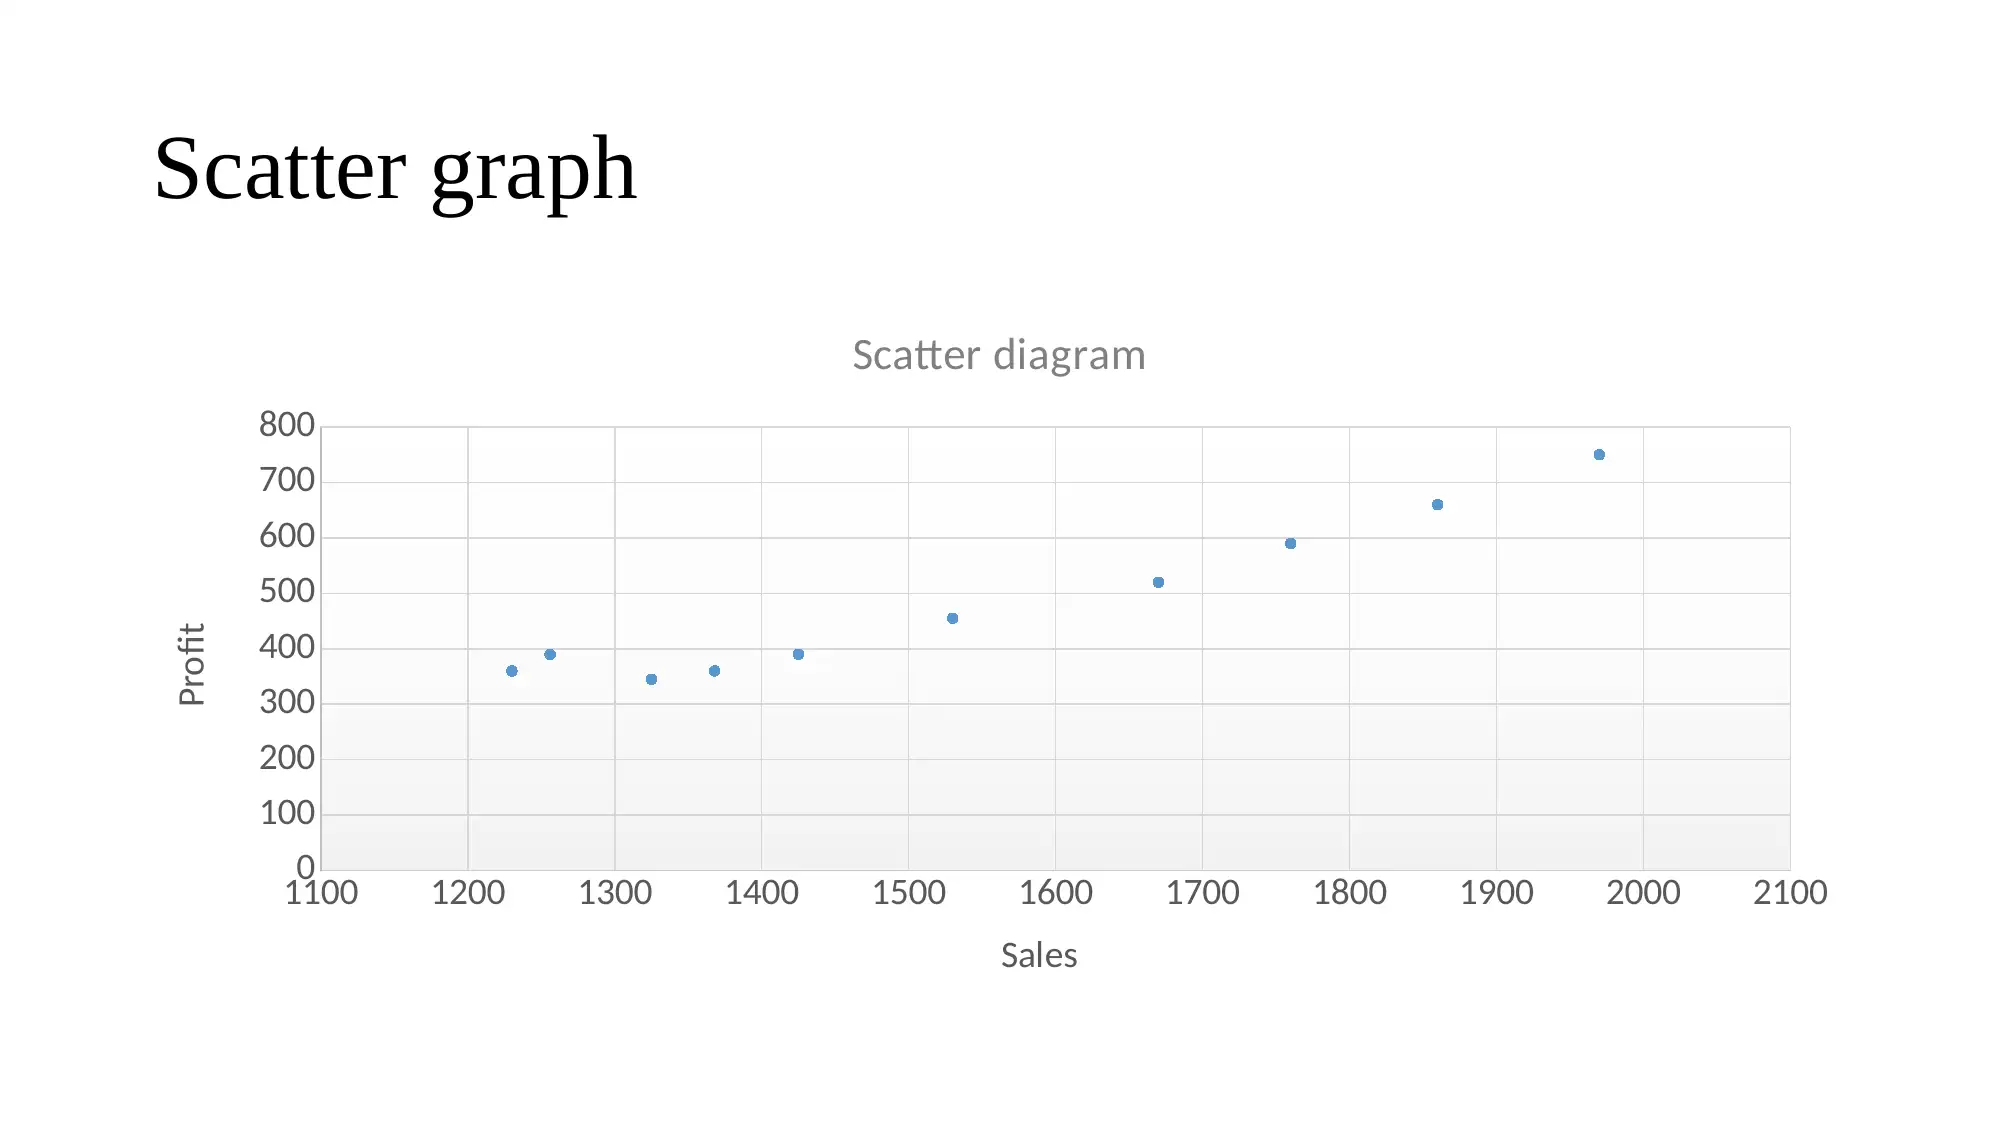
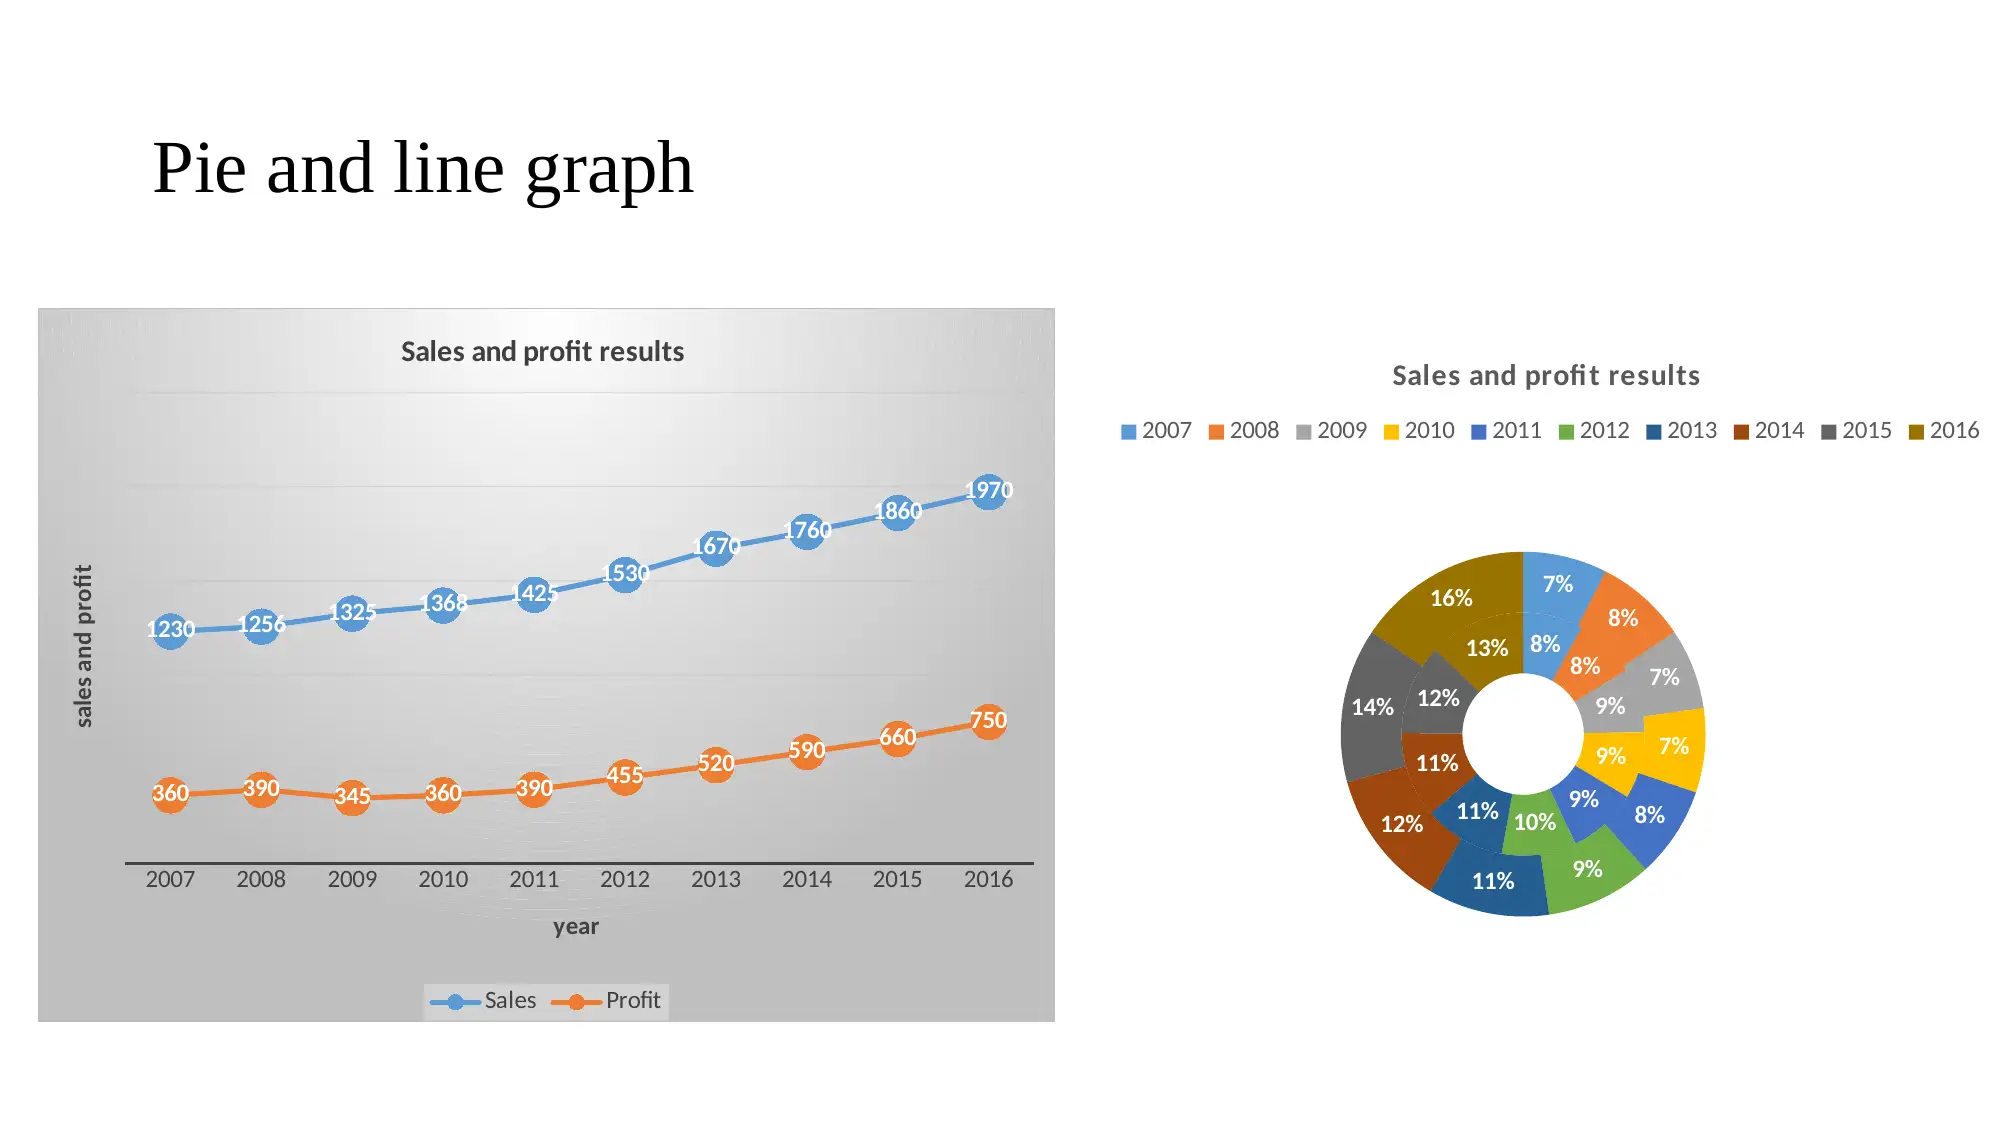
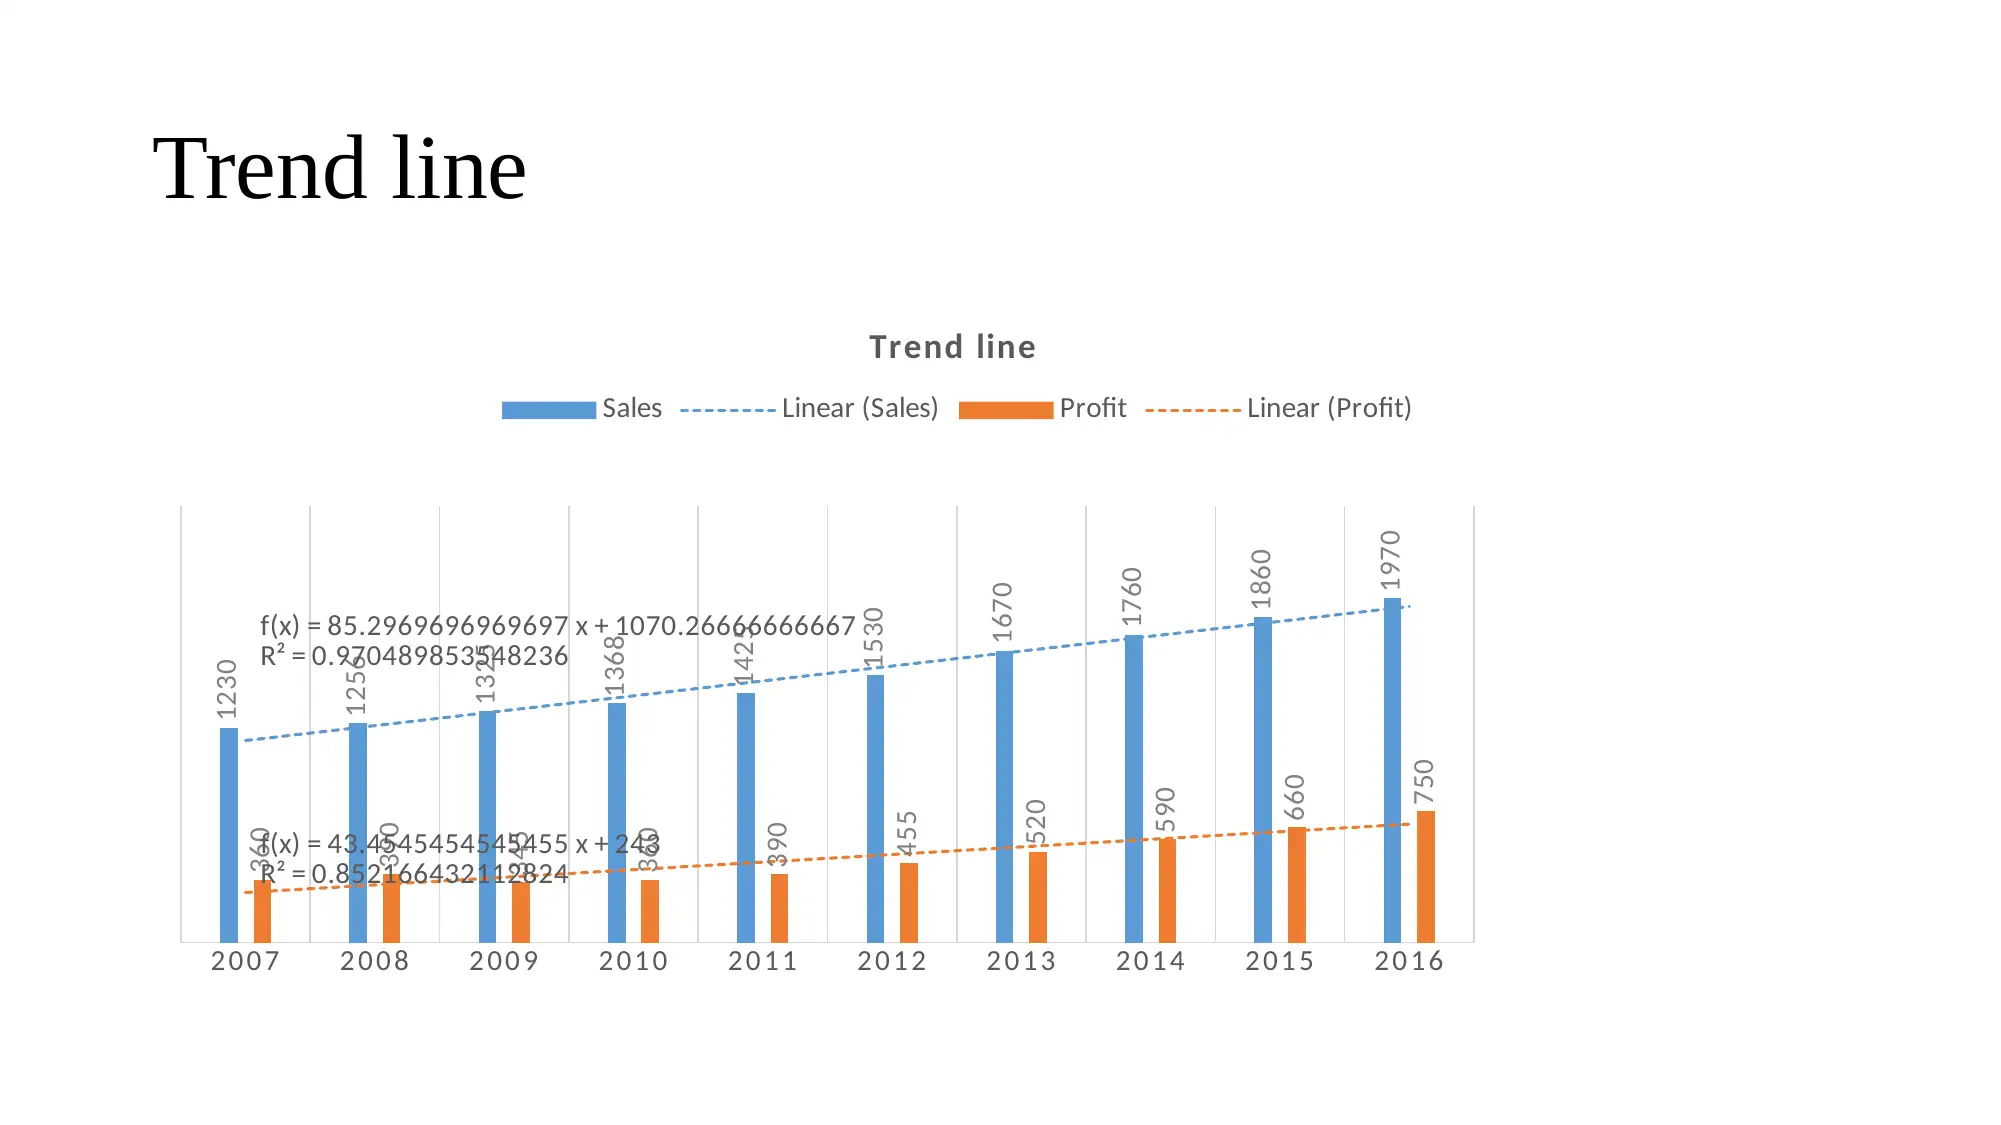
This project focuses on business decision-making for Blackfriars Restaurant, examining the UK restaurant sector's outlook and analyzing sales and profit performance. The assignment involves creating a data collection plan using both primary and secondary sources, designing a questionnaire, and employing various data analysis techniques. The student summarizes data using representative values, analyzes results to draw valid conclusions, and uses measures of dispersion to inform business decisions. The analysis includes interpreting data presented in column, bar, scatter, pie, and line graphs to understand trends and patterns. The project aims to provide a comprehensive understanding of the factors influencing the restaurant's performance and inform strategic decisions, referencing relevant academic sources.
Document Page
Business Decision Making
Blackfriars Restaurant: Opening a new
restaurant unit
tabler-icon-diamond-filled.svg

Paraphrase This Document

Need a fresh take? Get an instant paraphrase of this document with our AI Paraphraser
Document Page
UK Restaurant Sector: Outlook
UK is a leading nation in
restaurant sector with strong
growth underpinned by changing
consumer trends and
demographics. People now
prefers to eat out frequently and
spending increasing amount on
eating out.
Document Page
Column graph: sales and profit performance
2007 2008 2009 2010 2011 2012 2013 2014 2015 2016
1230 1256 1325 1368 1425 1530 1670 1760 1860 1970
360 390 345 360 390 455 520 590 660 750
Sales and profi t performance
Sales Profit
Year
Sales and profit
Document Page
Bar graph: Sales and profit performance
2007
2008
2009
2010
2011
2012
2013
2014
2015
2016
0 500 1000 1500 2000 2500
1230
1256
1325
1368
1425
1530
1670
1760
1860
1970
Sales results
Sales figures
Year
2007
2008
2009
2010
2011
2012
2013
2014
2015
2016
0 100 200 300 400 500 600 700 800
360
390
345
360
390
455
520
590
660
750
Profit results
Profit figures
Year
tabler-icon-diamond-filled.svg

Paraphrase This Document

Need a fresh take? Get an instant paraphrase of this document with our AI Paraphraser
Document Page
Scatter graph
1100 1200 1300 1400 1500 1600 1700 1800 1900 2000 2100
0
100
200
300
400
500
600
700
800
Scatter diagram
Sales
Profit
Document Page
Pie and line graph
2007 2008 2009 2010 2011 2012 2013 2014 2015 2016
1230 1256 1325 1368 1425 1530
1670 1760 1860 1970
360 390 345 360 390 455 520 590 660 750
Sales and profit results
Sales Profit
year
sales and profit
8% 8%
9%
9%
9%
10%11%
11%
12%
13%
7%
8%
7%
7%
8%
9%11%
12%
14%
16%
Sales and profit results
2007 2008 2009 2010 2011 2012 2013 2014 2015 2016
Document Page
Trend line
2 0 0 7 2 0 0 8 2 0 0 9 2 0 1 0 2 0 1 1 2 0 1 2 2 0 1 3 2 0 1 4 2 0 1 5 2 0 1 6
1230
1256
1325
1368
1425
1530
1670
1760
1860
1970
360
390
345
360
390
455
520
590
660
750
f(x) = 85.2969696969697 x + 1070.26666666667
R² = 0.970489853548236
f(x) = 43.4545454545455 x + 243
R² = 0.852166432112824
Trend line
Sales Linear (Sales) Profit Linear (Profit)
tabler-icon-diamond-filled.svg

Paraphrase This Document

Need a fresh take? Get an instant paraphrase of this document with our AI Paraphraser
Document Page
REFERENCES
Chan, R.H.F., Lee, S.T.H. and Wong, W.K., 2014. Chart Pattern
Reading—Trend, Trend Line and Trend Channel. In TECHNICAL
ANALYSIS AND FINANCIAL ASSET FORECASTING: From Simple
Tools to Advanced Techniques. 10(5). pp. 27-37.
Gigerenzer, G. and Gaissmaier, W., 2011. Heuristic decision making.
Annual review of psychology. 62. pp.451-482.
Document Page
chevron_up_icon
1 out of 9
circle_padding
hide_on_mobile
zoom_out_icon
[object Object]