Business Decision Making: Blackfriars Restaurant Expansion Analysis

Verified

Added on  2023/03/20

|17
|815
|78
Report
AI Summary
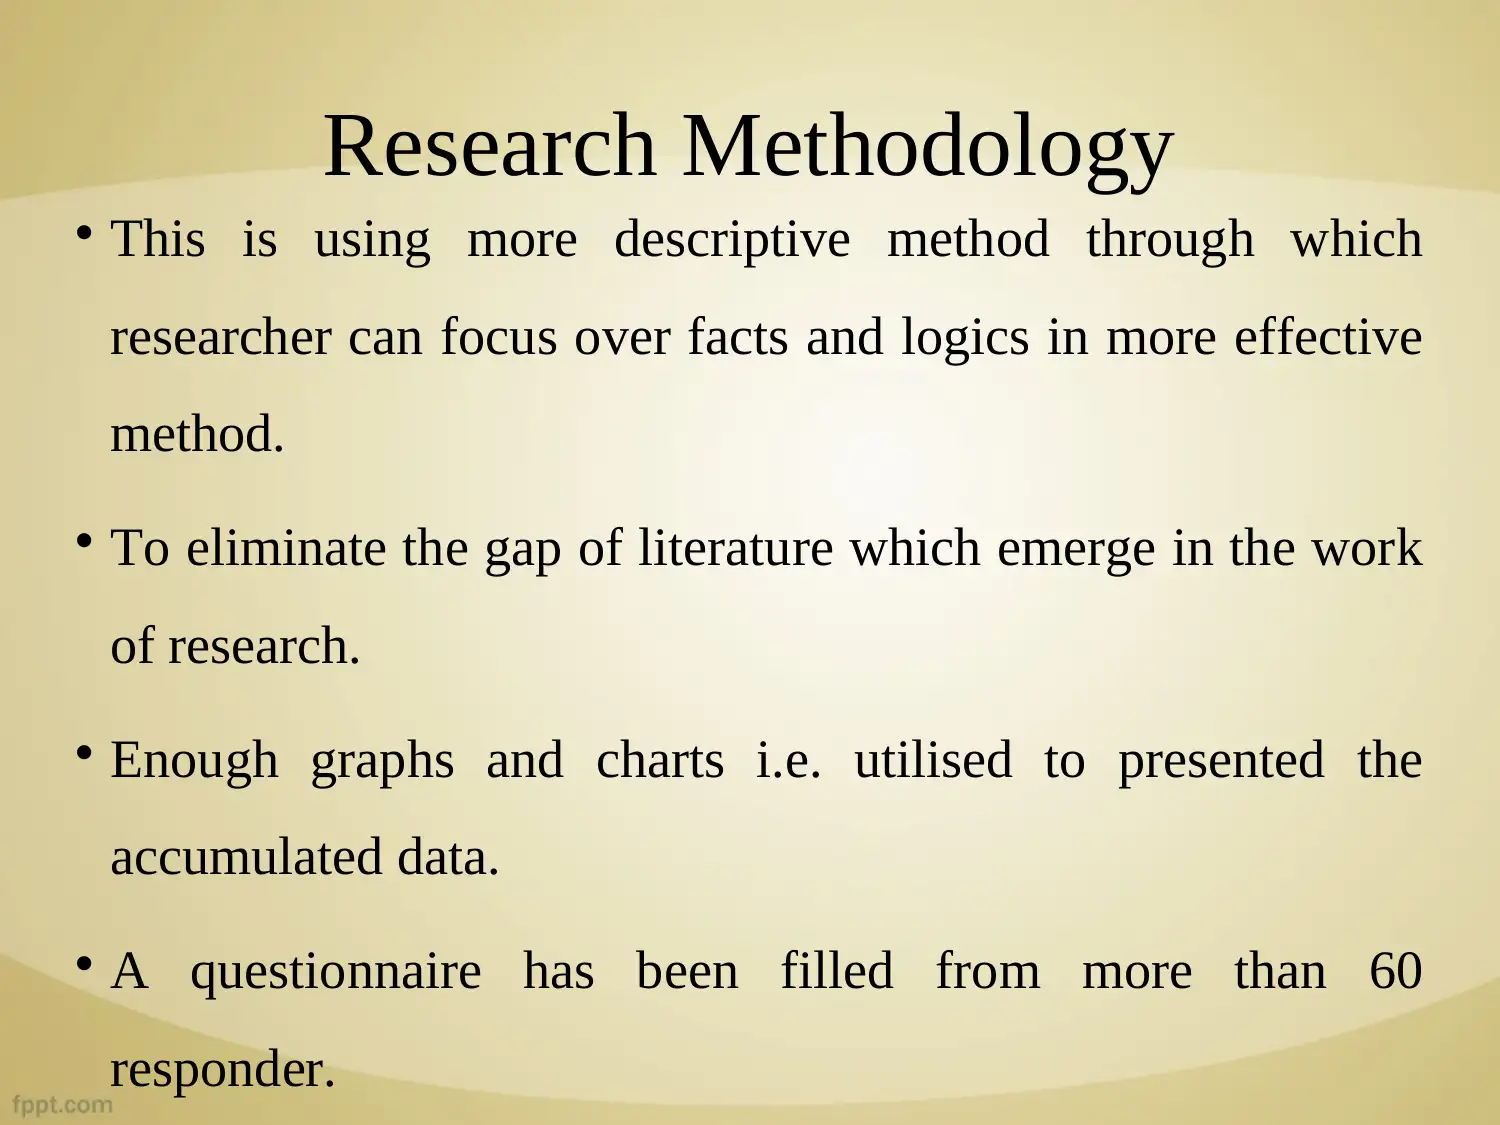
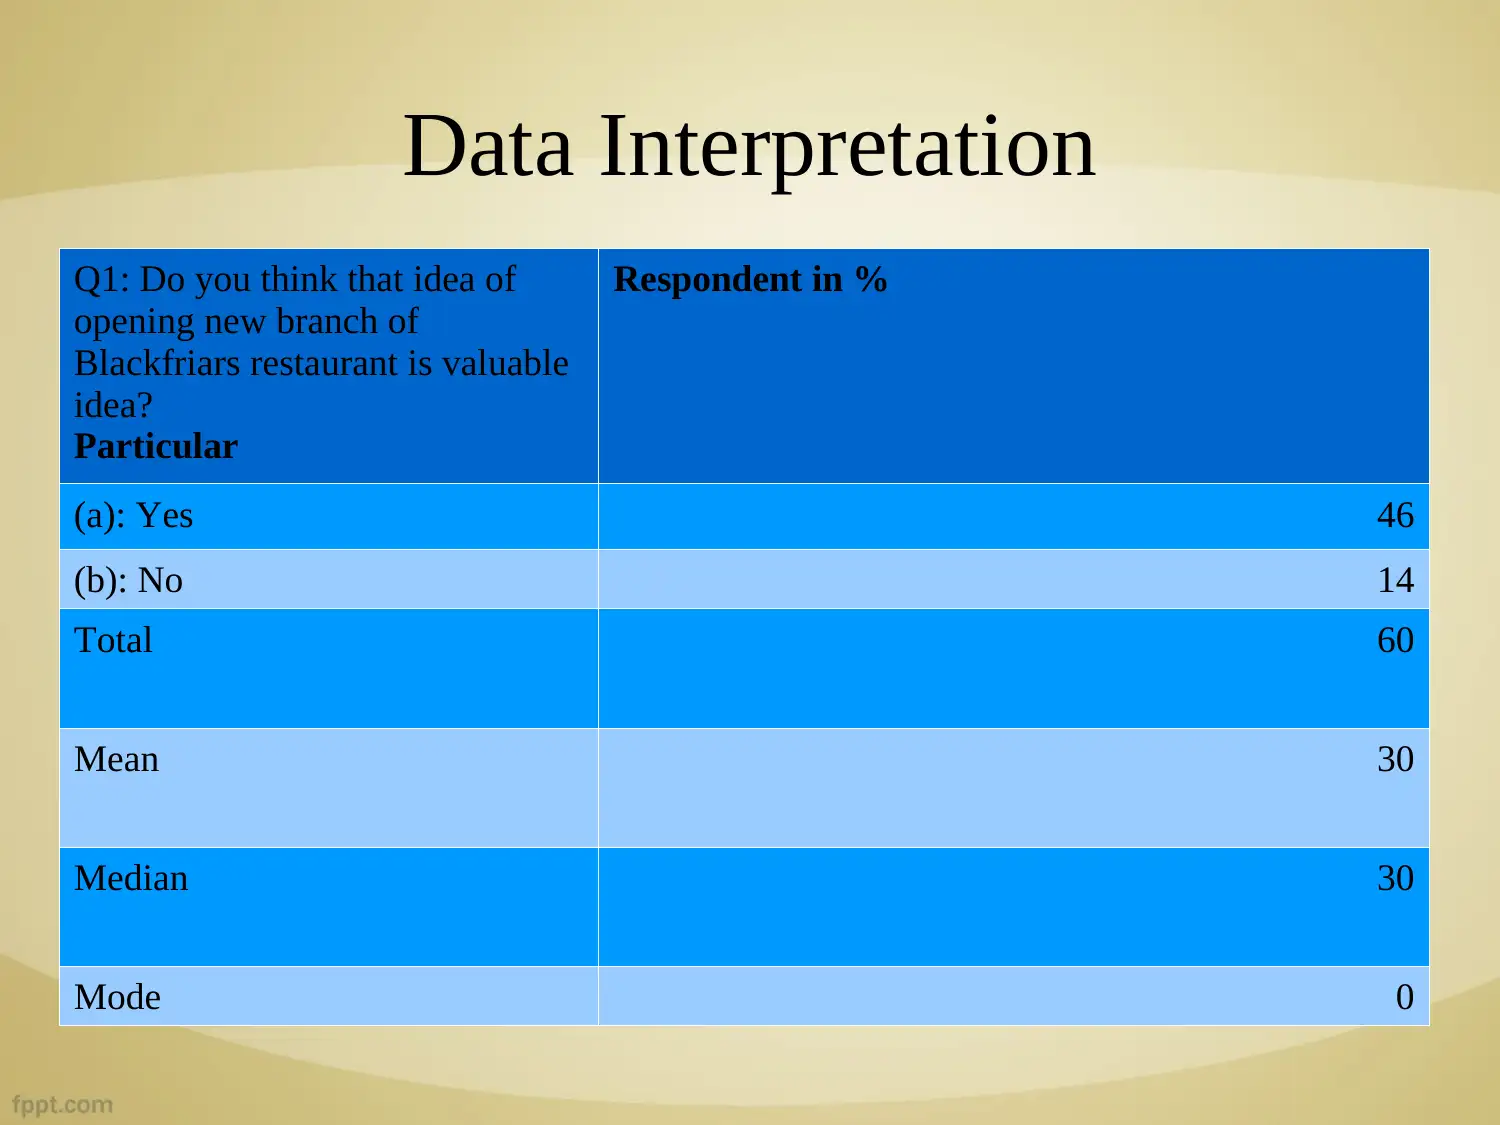
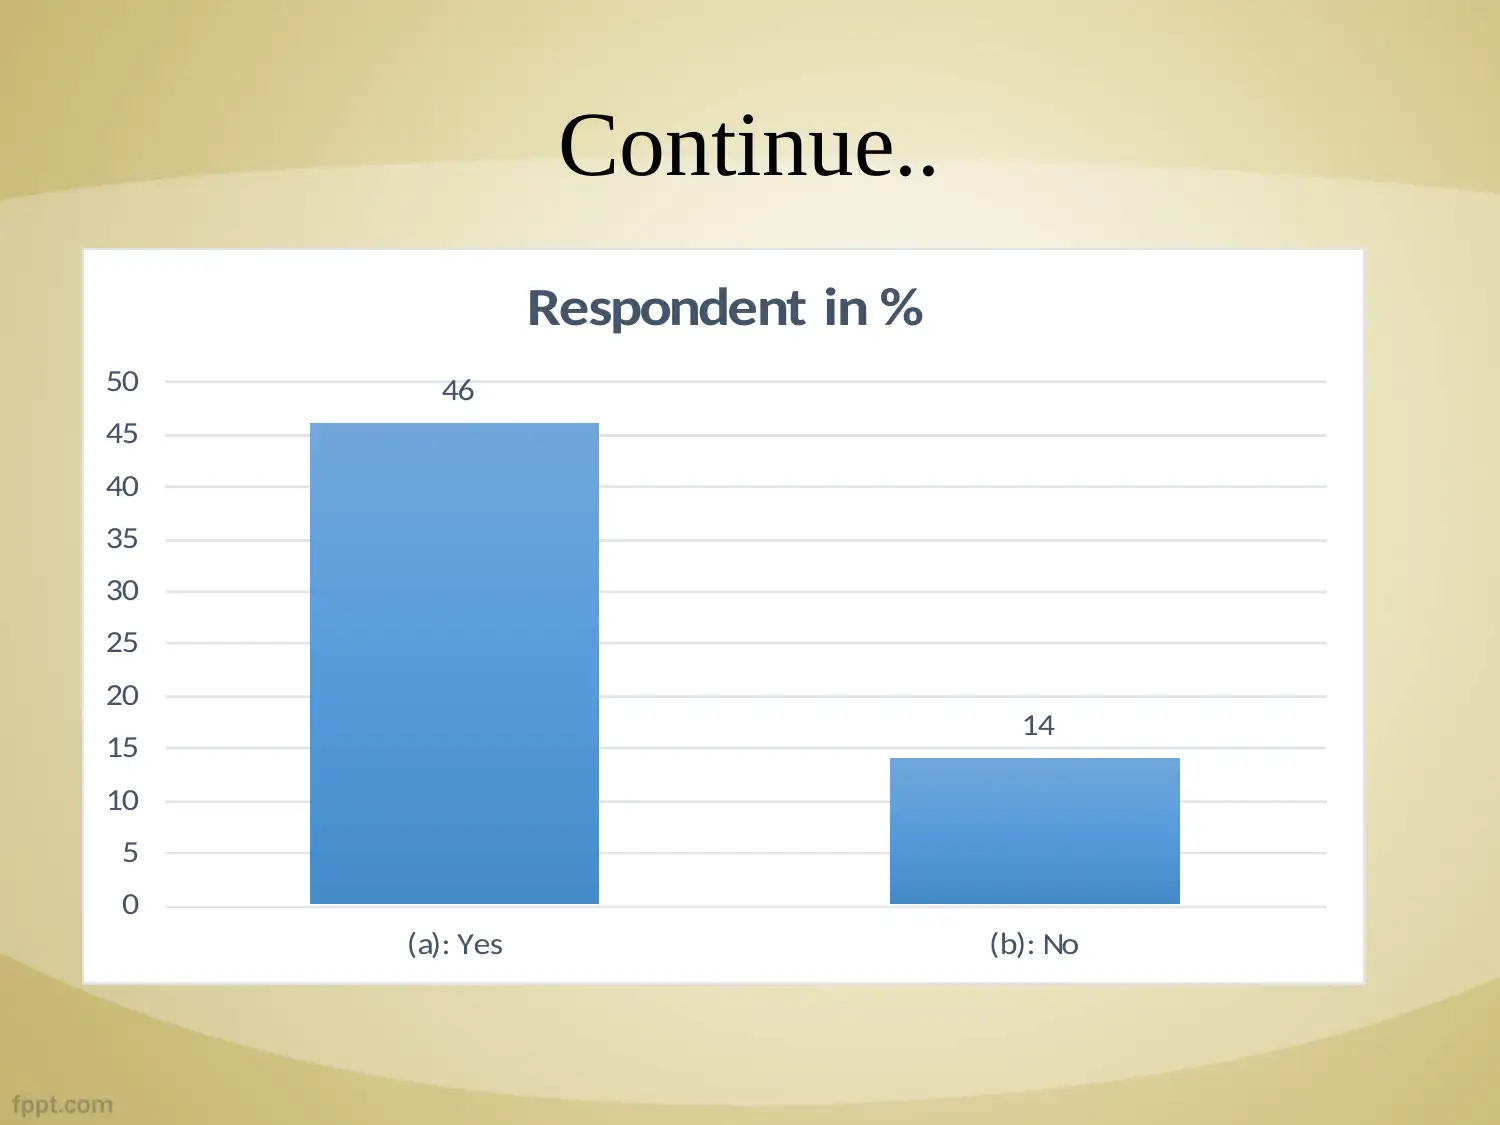
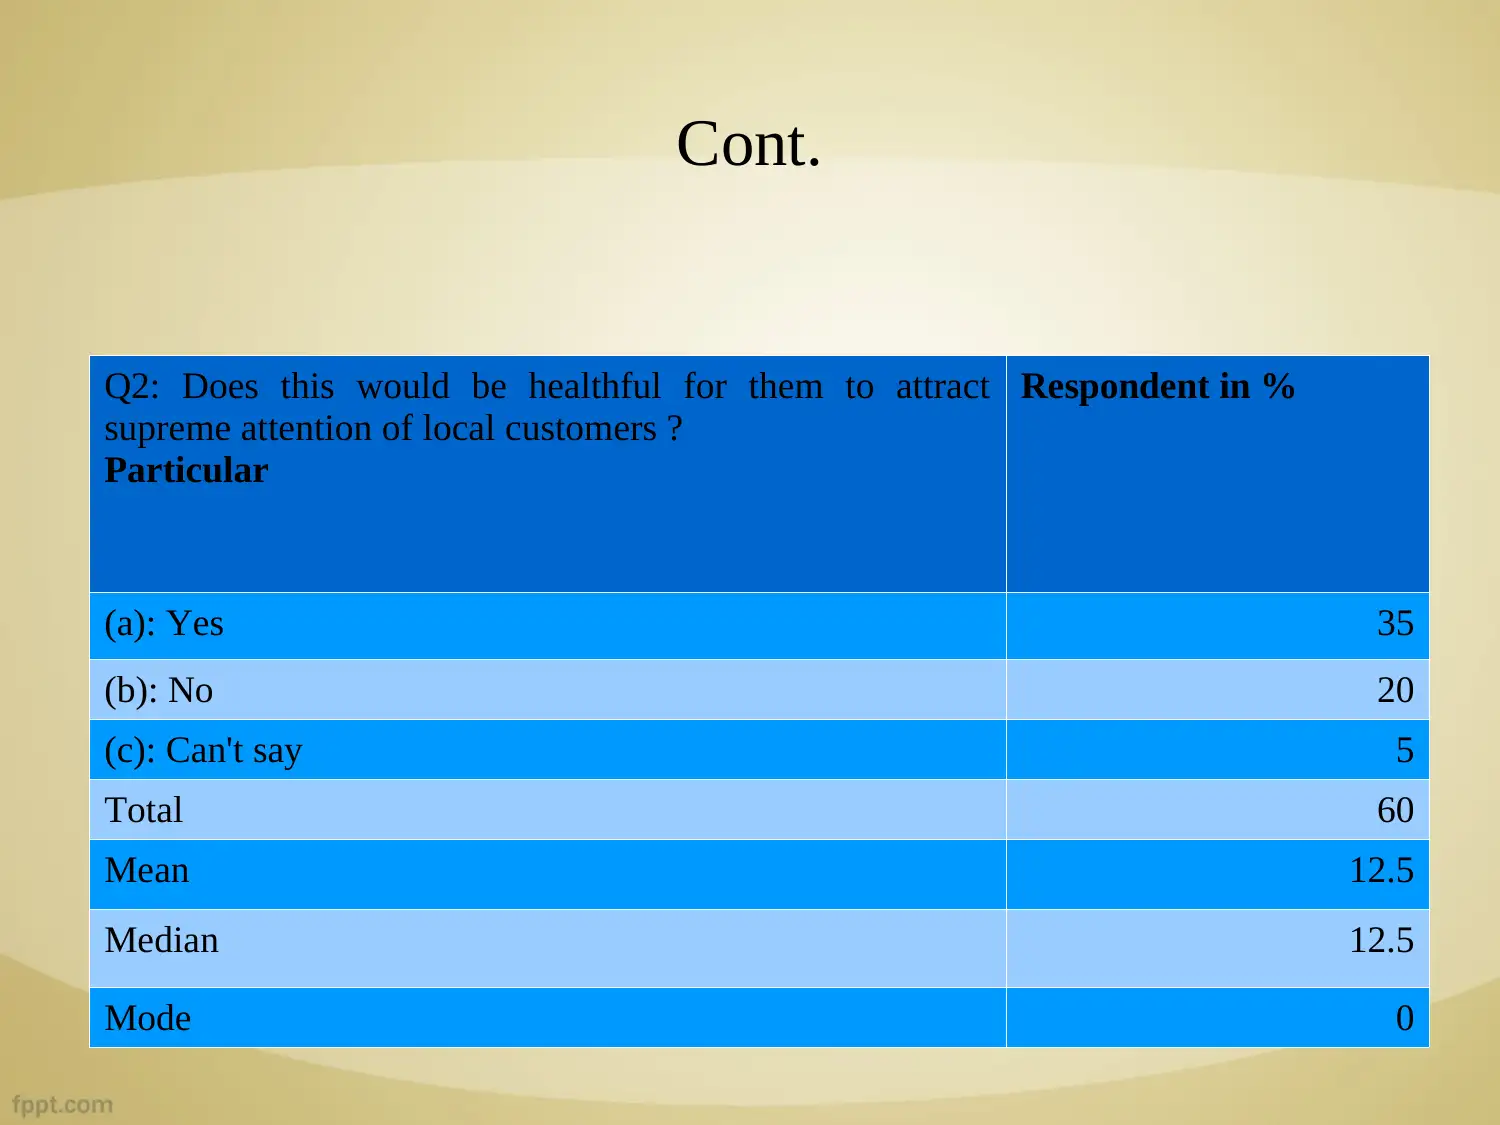
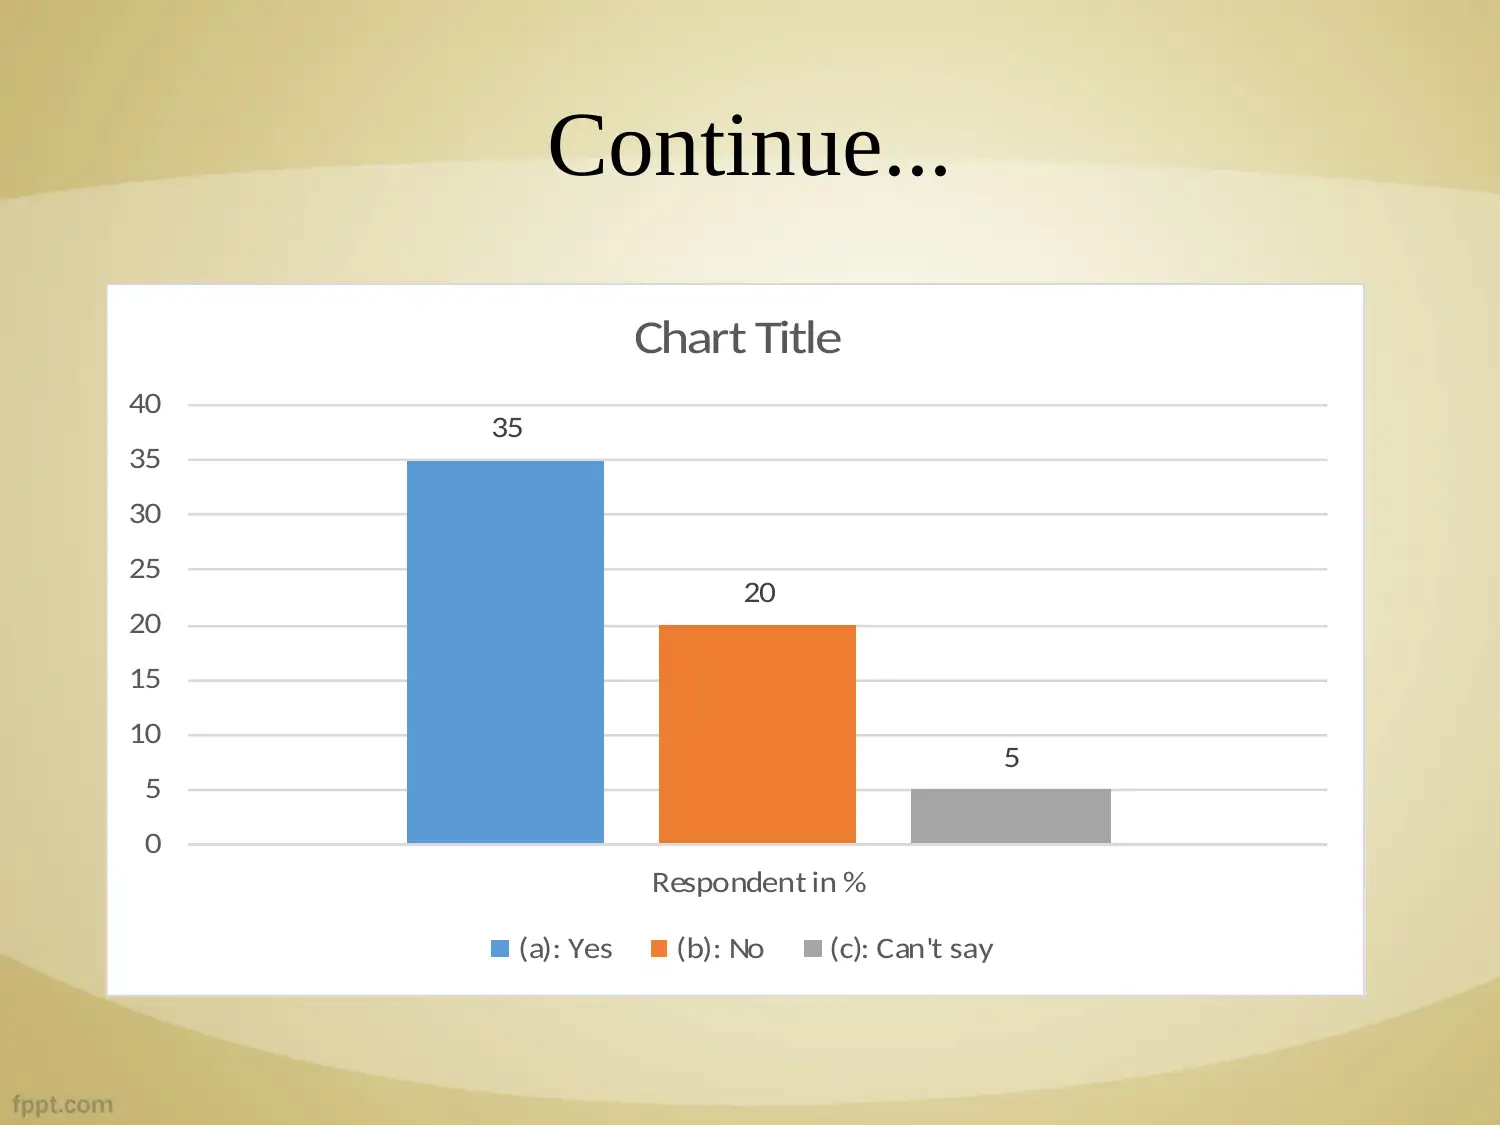
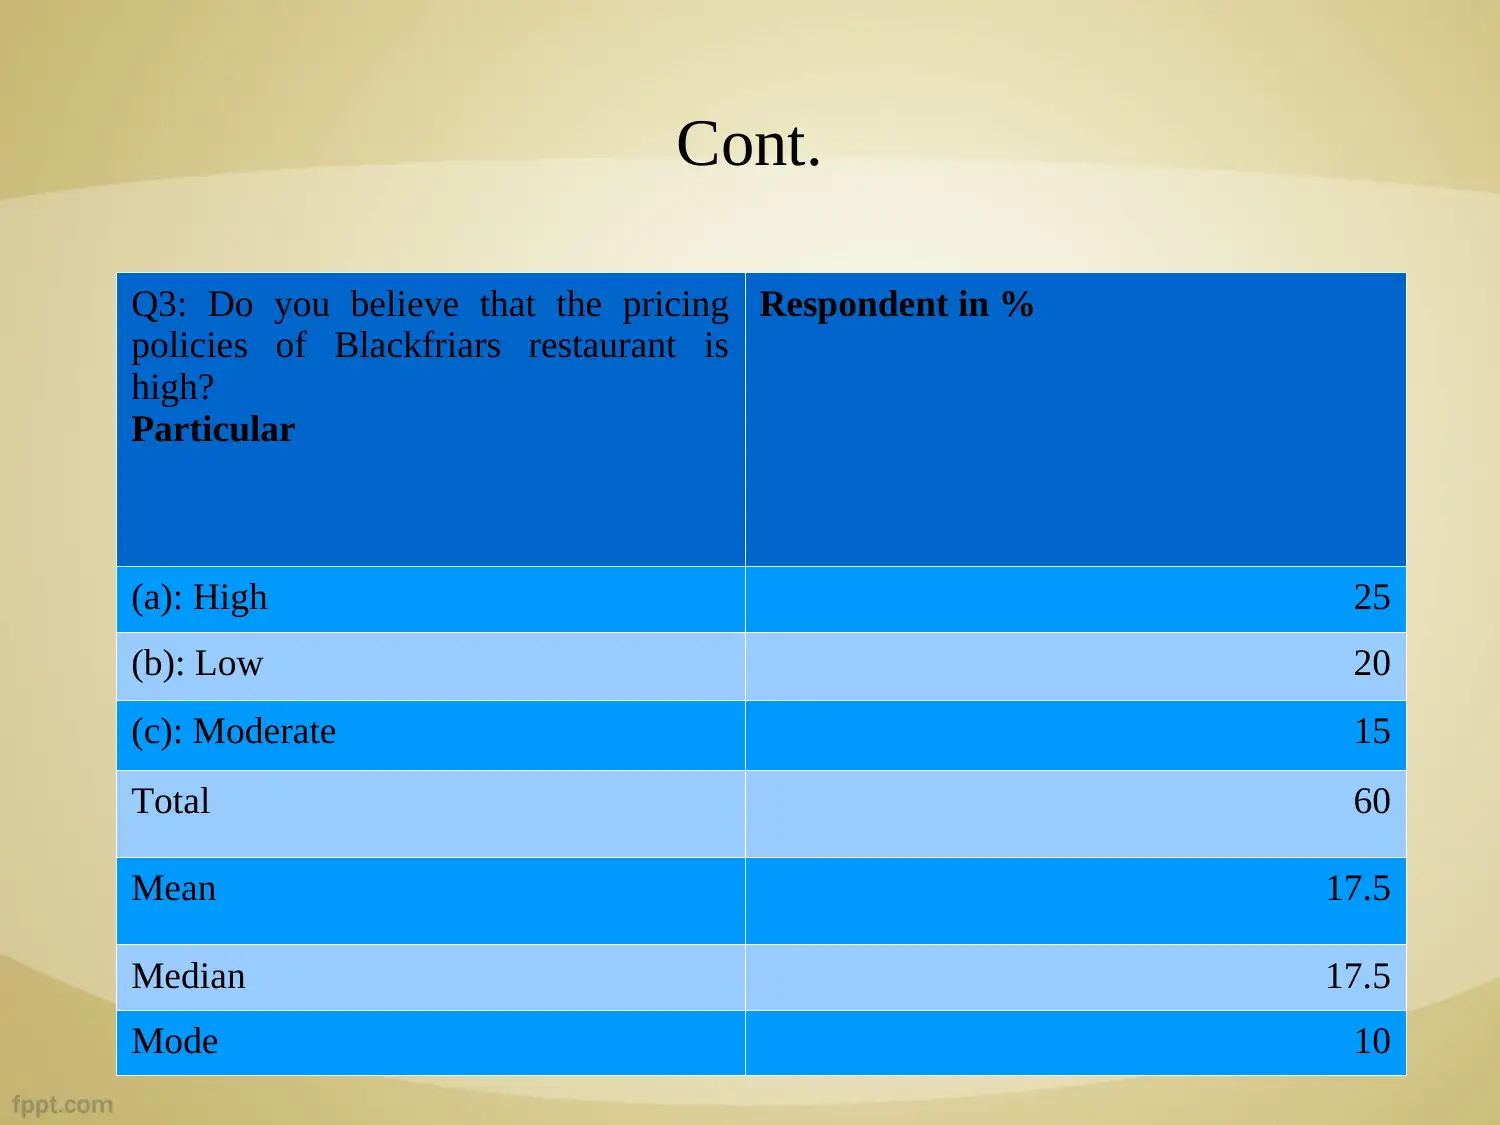
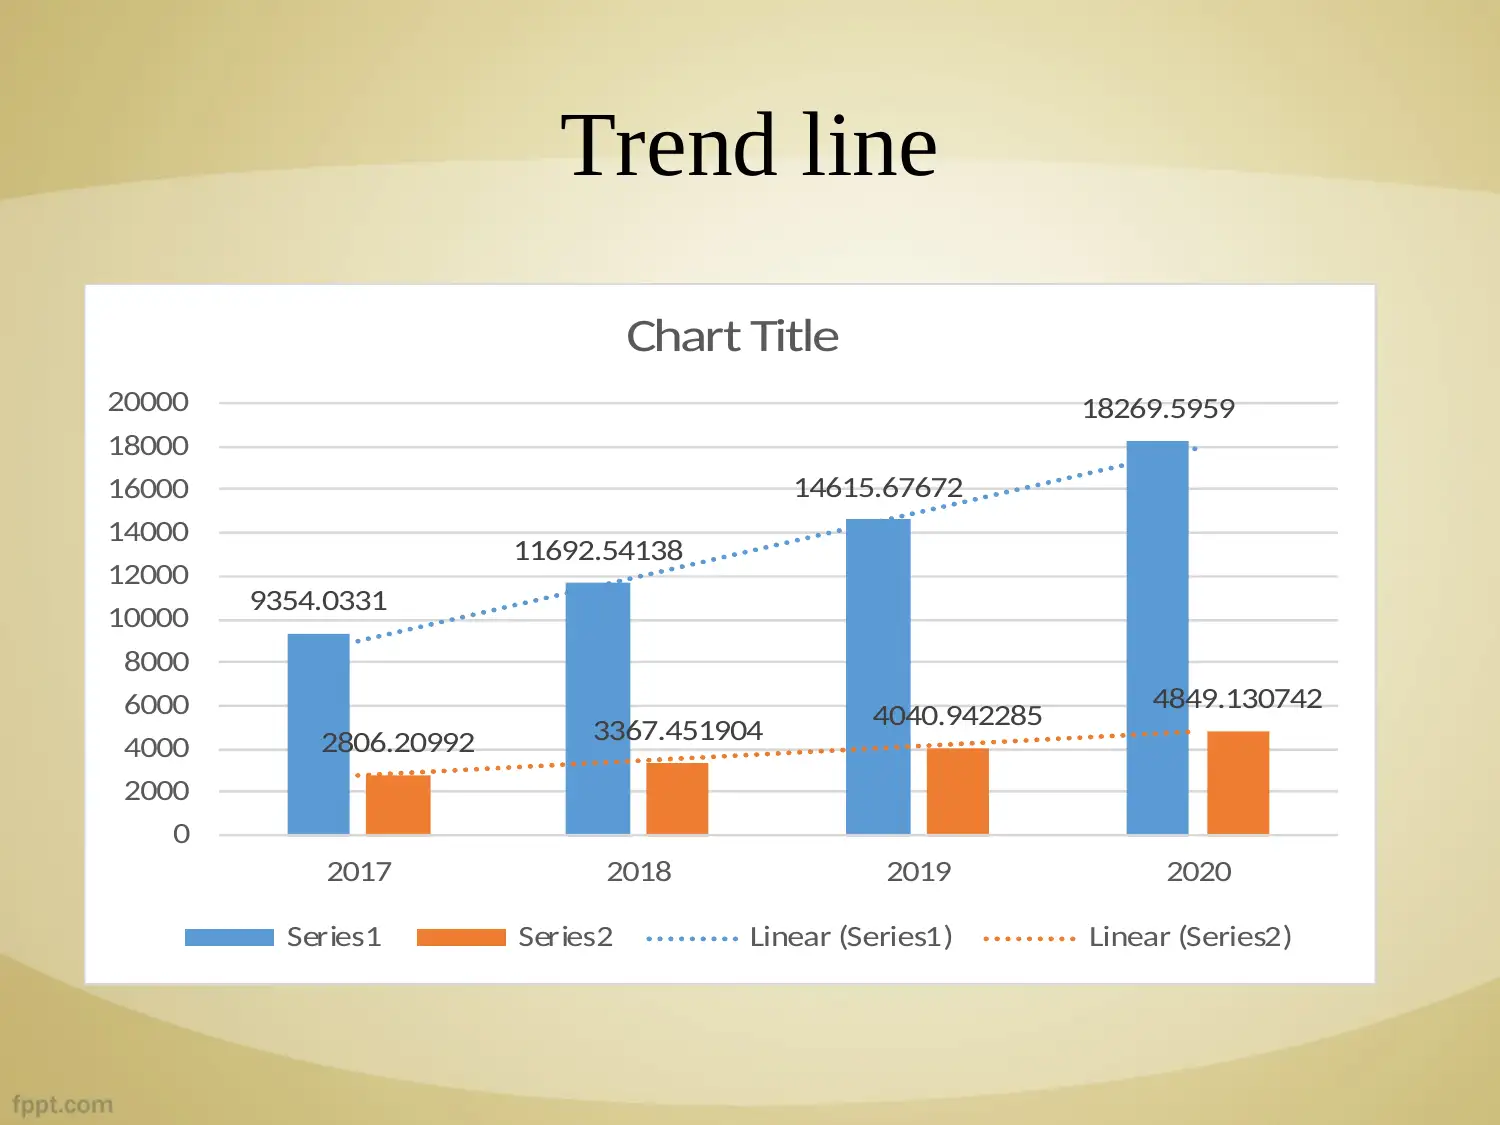
This report examines the business decision-making process related to the potential expansion of Blackfriars Restaurant, specifically focusing on opening a new branch. The objective is to gather consumer information and evaluate their perception of the new venture. The research methodology employs a descriptive approach, utilizing questionnaires administered to over 60 respondents. Data interpretation includes analysis of responses regarding the value of a new branch, its ability to attract customers, and consumer opinions on pricing. Findings indicate positive consumer sentiment towards expansion and suggestions include incorporating entertainment, prioritizing online booking, and introducing new cuisine options. The conclusion supports expansion in central London, emphasizing the need for strategic adaptations to achieve sustainability. The report includes references to relevant academic sources on business decision-making.
Document Page
Business Decision Making
Task 3.3
tabler-icon-diamond-filled.svg

Paraphrase This Document

Need a fresh take? Get an instant paraphrase of this document with our AI Paraphraser
Document Page
Covered content
Introduction
Objective
Research methodology
Data interpretation
Finding
Suggestion
Conclusion
References
Document Page
Introduction
Business decision making is the tool which is used by the
organisation in order to gain the sustainable development.
However, business decision making is the most effective
tool that are used by the organization in order to get the core
competencies.
Document Page
Objective
This is fundamental for the researcher to accumulate
information from consumer in regard of starting a new
restaurant business.
The response and feedback would be collecting to
evaluate the perception of consumer.
tabler-icon-diamond-filled.svg

Paraphrase This Document

Need a fresh take? Get an instant paraphrase of this document with our AI Paraphraser
Document Page
Research Methodology
This is using more descriptive method through which
researcher can focus over facts and logics in more effective
method.
To eliminate the gap of literature which emerge in the work
of research.
Enough graphs and charts i.e. utilised to presented the
accumulated data.
A questionnaire has been filled from more than 60
responder.
Document Page
Data Interpretation
Q1: Do you think that idea of
opening new branch of
Blackfriars restaurant is valuable
idea?
Particular
Respondent in %
(a): Yes 46
(b): No 14
Total 60
Mean 30
Median 30
Mode 0
Document Page
Continue..
46
14
0
5
10
15
20
25
30
35
40
45
50
(a): Yes (b): No
Respondent in %
46
14
0
5
10
15
20
25
30
35
40
45
50
(a): Yes (b): No
Respondent in %
tabler-icon-diamond-filled.svg

Paraphrase This Document

Need a fresh take? Get an instant paraphrase of this document with our AI Paraphraser
Document Page
Cont.
Q2: Does this would be healthful for them to attract
supreme attention of local customers ?
Particular
Respondent in %
(a): Yes 35
(b): No 20
(c): Can't say 5
Total 60
Mean 12.5
Median 12.5
Mode 0
Document Page
Continue...
35
20
5
0
5
10
15
20
25
30
35
40
Respondent in %
Chart Title
(a): Yes (b): No (c): Can't say
35
20
5
0
5
10
15
20
25
30
35
40
Respondent in %
Chart Title
(a): Yes (b): No (c): Can't say
Document Page
Cont.
Q3: Do you believe that the pricing
policies of Blackfriars restaurant is
high?
Particular
Respondent in %
(a): High 25
(b): Low 20
(c): Moderate 15
Total 60
Mean 17.5
Median 17.5
Mode 10
tabler-icon-diamond-filled.svg

Paraphrase This Document

Need a fresh take? Get an instant paraphrase of this document with our AI Paraphraser
Document Page
Pie-chart
35
20
5
0
5
10
15
20
25
30
35
40
Respondent in %
Chart Title
(a): Yes (b): No (c): Can't say
35
20
5
0
5
10
15
20
25
30
35
40
Respondent in %
Chart Title
(a): Yes (b): No (c): Can't say
Document Page
Trend line
9354.0331
11692.54138
14615.67672
18269.5959
2806.20992 3367.451904 4040.942285 4849.130742
0
2000
4000
6000
8000
10000
12000
14000
16000
18000
20000
2017 2018 2019 2020
Chart Title
Series1 Series2 Linear (Series1) Linear (Series2)
9354.0331
11692.54138
14615.67672
18269.5959
2806.20992 3367.451904 4040.942285 4849.130742
0
2000
4000
6000
8000
10000
12000
14000
16000
18000
20000
2017 2018 2019 2020
Chart Title
Series1 Series2 Linear (Series1) Linear (Series2)
chevron_up_icon
1 out of 17
circle_padding
hide_on_mobile
zoom_out_icon
[object Object]