Report: Business Valuation and Financial Analysis of Blackmores
VerifiedAdded on 2023/06/04
|26
|8567
|90
Report
AI Summary
This report provides a comprehensive financial analysis and business valuation of Blackmores Limited, an Australian health supplement company. It begins with an introduction to the company and its financial context. The report then delves into a prospective analysis, forecasting future financial performance, including sales growth, profit margin, asset turnover, and dividend payout. Various valuation models, such as the Dividend Discount Model (DDM), Residual Income Model (RIM), Residual Operating Income Model (ROIM), and Discounted Cash Flow Model (DCF), are employed to estimate the company's value. A sensitivity analysis is conducted to assess the impact of different variables on the valuation. The report also discusses management applications, including opportunities for growth in the Asian market, revenue generation, and innovation, as well as challenges such as market focus and competition. Finally, it recommends measures for the business to adopt, supported by references and appendices that include forecasting data and model outputs. The report aims to provide insights into Blackmores' financial health and strategic recommendations for sustainable growth.
Running head: BUSINESS VALUATION AND FINANCIAL ANALYSIS
Business Valuation and Financial Analysis
Name of the Student:
Name of the University:
Author’s Note
Business Valuation and Financial Analysis
Name of the Student:
Name of the University:
Author’s Note
Paraphrase This Document
Need a fresh take? Get an instant paraphrase of this document with our AI Paraphraser
1
BUSINESS VALUATION AND FINANCIAL ANALYSIS
Table of Contents
1. Introduction..............................................................................................................................................3
2. Blackmore’s Prospective Analysis...........................................................................................................4
2.1 Future Financial Performance of Blackmores........................................................................................4
2.1.1 Growth Rate of Sales.......................................................................................................................4
2.1.2 Profit Margin.......................................................................................................................................6
2.1.3 Asset Turnover................................................................................................................................7
2.1.4 Net Dividend Payout.......................................................................................................................8
2.1.5 Cost of Debt after Tax.....................................................................................................................9
2.2 Valuation of Blackmores........................................................................................................................9
2.2.1 Assumptions for the Valuations.........................................................................................................10
2.2.2 Four Valuation Model...................................................................................................................10
2.2.2.1 Divided Discount Model (DDM)................................................................................................11
2.2.2.2 Residual Income Model (RIM)...................................................................................................11
2.2.2.3 Residual Operating Income Model (ROIM)...............................................................................11
2.2.2.4 Discounted Cash Flow Model (DCM)........................................................................................11
2.3. Sensitivity Analysis.............................................................................................................................12
2.3.1. Sales Growth................................................................................................................................13
2.3.2. Profit Margin (PM).......................................................................................................................14
2.3.3. Asset Turnover (ATO)..................................................................................................................14
2.3.4. Weighted Average Cost of Capital (WACC)................................................................................14
3. Management Application for Blackmores Ltd........................................................................................15
3.1. Opportunities.......................................................................................................................................15
3.1.1. Growth Opportunities in Asian Market........................................................................................15
3.1.2. Revenue Generation and Brand Loyalty.......................................................................................15
3.1.3. Innovation and Product Development...........................................................................................16
3.2. Challenges...........................................................................................................................................16
3.2.1. Focus on Australia Market............................................................................................................16
2
BUSINESS VALUATION AND FINANCIAL ANALYSIS
3.2.2. Competitors..................................................................................................................................17
3.2.3. Increase in the Costs of the Business............................................................................................18
3.3. Measures to be Adopted by the Business.............................................................................................18
4. Reference...............................................................................................................................................19
5. Appendix................................................................................................................................................22
⊘ This is a preview!⊘
Do you want full access?
Subscribe today to unlock all pages.
Trusted by 1+ million students worldwide
3
BUSINESS VALUATION AND FINANCIAL ANALYSIS
1. Introduction
The managements of the business organizations have to deal with different types of business
operations in order to ensure the smooth running of the companies and thus, they are needed to put equal
attention to each dimensions of the business operations of the companies. One of such aspects or
dimensions is the Accounting and Financial Operations of the companies. It needs to be mentioned that
the success of the business organizations largely depends on the financial performance of the companies
(Vogel 2014). In order to ensure the effective financial performamce of the business organizations, it is
the prime responsibility of the upper level management to develop effective financial strategies by taking
into consideration all the relevant financial as well as accounting aspects. This aspect indicates towards
the vast responsibilities of the financial managers of the business organizations related to some of the
crucial areas of accounting and finance. For this reason, the major considerable areas by the finance
managers of the companies are the future financial performance of the companies, analysis as well as
evaluation of the stock prices of the companies with the aim to evaluate the financial performance,
valuation of different aspects of the business like asset valuation and recommendations with the aim to
formulate effective financial strategies for the businesses’ sustainable growth (Cucchiella, D’Adamo and
Gastaldi 2015). At the time of the analysis and evaluation of these important factors, the finance managers
of the business organizations are needed to take into consideration certain factors like historical data
related to the financial performance of the companies, the financial performance of the industries in which
the companies are operating, economic environment of the countries in which the companies are
operating, nature of the business, the style of strategic development of the managements of the companies
and others; and all these aspects are used as basis of financial forecast as well as analysis of the financial
performance of the companies (Trugman 2016).
This report focuses on the financial performance as well as financial forecast of one of the major
Australian companies, Blackmores Limited (Blackmores). The main aim of this report is the analysis as
well as evaluation of the future financial performance of Blakemores along with analyzing and evaluating
the stock price, business valuation so that effective strategies can be recommended. In order to achieve
this objective, this report takes into account aspects like historical financial data of Blakemores, present
situation of the industry, economic development, nature of business and others. Blakemores is a major
Australian health supplement company operates in the health supplement industry of Australia. The
company was founded in the year of 1930 and it is headquartered at Sydney, Australia
(blackmores.com.au 2018). Different parts of the report consider the financial analysis and forecast the
company.
Paraphrase This Document
Need a fresh take? Get an instant paraphrase of this document with our AI Paraphraser
4
BUSINESS VALUATION AND FINANCIAL ANALYSIS
2. Blackmore’s Prospective Analysis
It is an essential part of this report as this part of the report takes into consideration the prediction
of the future financial performance of Blakemores and the main aim of this is the estimation of the value
of the organizations with the use of various models for business valuation along with the sensitivity
analysis. In order to achieve these objectives, this report takes into consideration the financial statements
of the Blakemores from the year 2013 to 2018.
2.1 Future Financial Performance of Blackmores
This part of the report takes into consideration the future financial performance of Blakemores by
considering all the relevant aspects like historical data, industry condition, economic condition and others.
2.1.1 Growth Rate of Sales
2014
2015
2016
2017
2018
2019
2020
2021
2022
2023
-30.00% -20.00% -10.00% 0.00% 10.00% 20.00% 30.00% 40.00% 50.00% 60.00%
6.17%
36.01%
52.08%
-23.01%
8.87%
2.50%
2.50%
2.50%
2.50%
2.50%
Sales Growth Rate
Forecasted
Actual
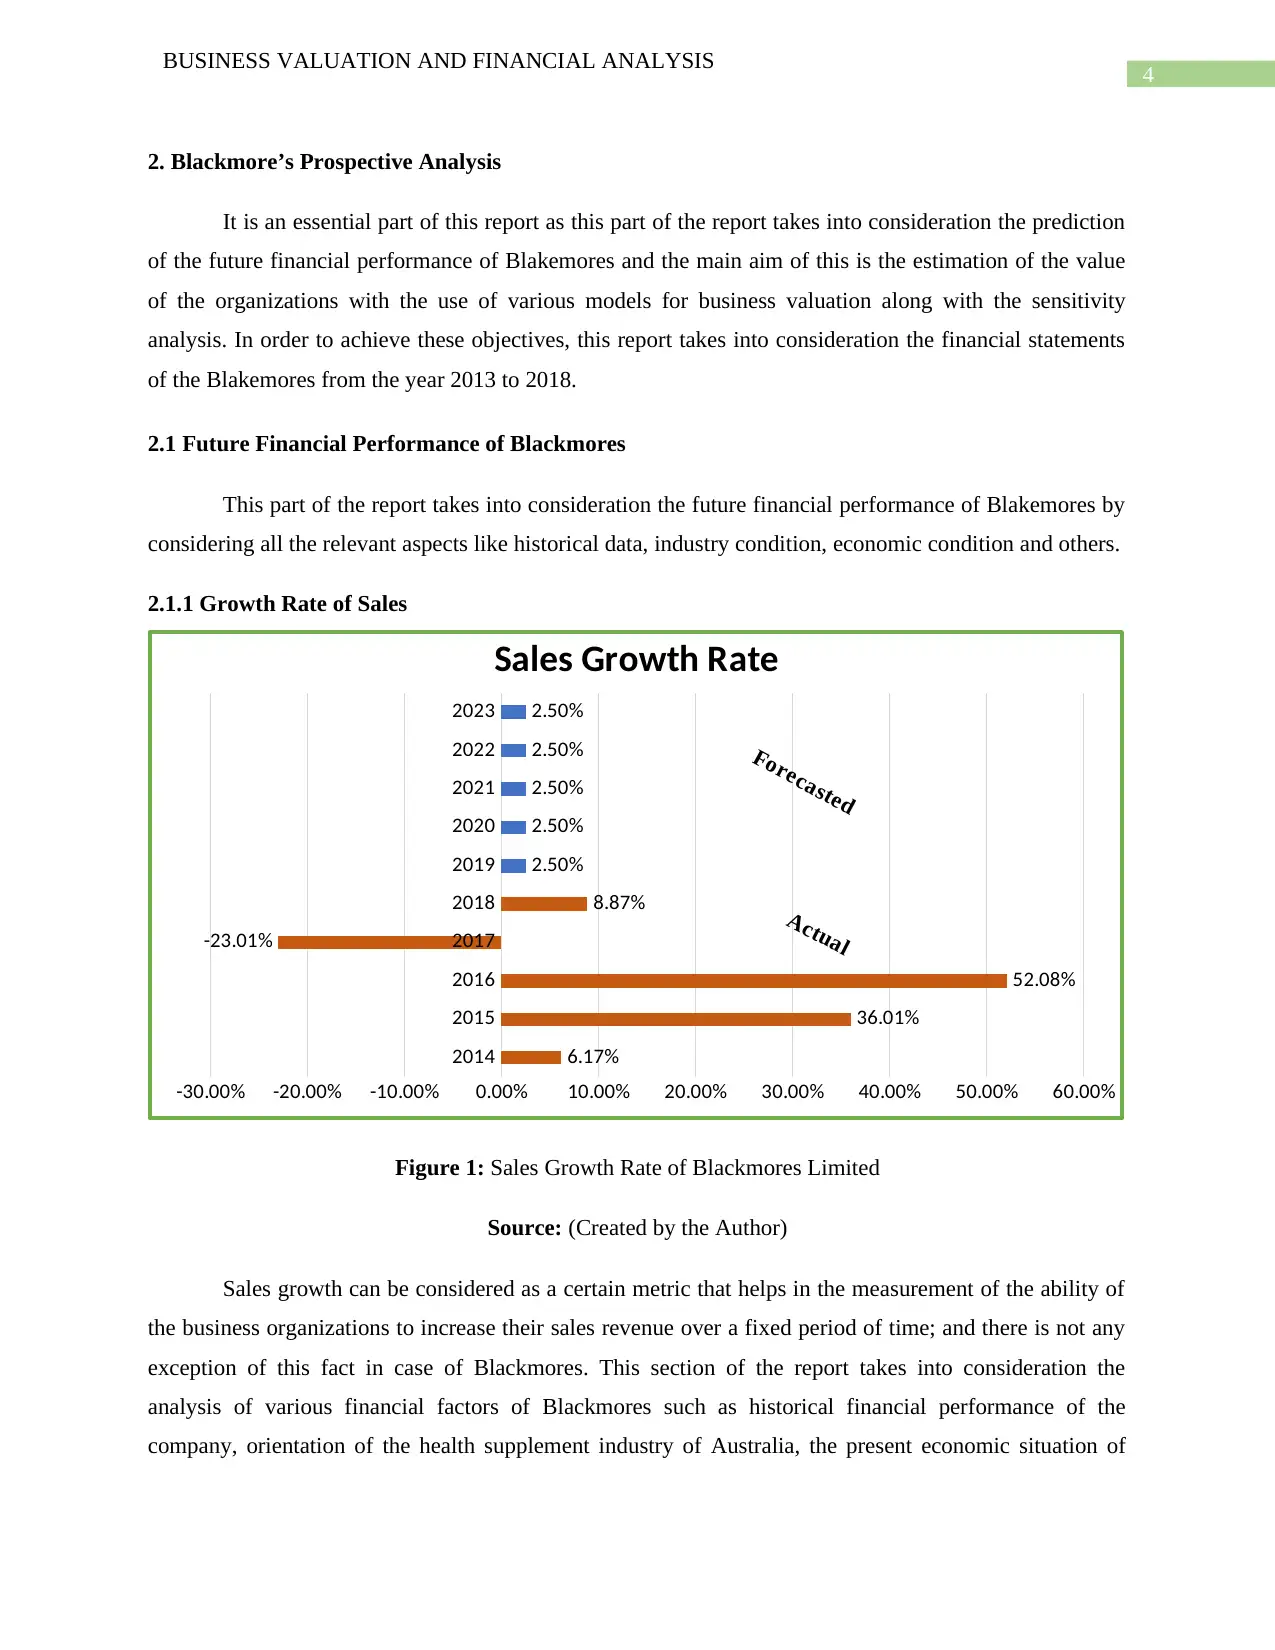
Figure 1: Sales Growth Rate of Blackmores Limited
Source: (Created by the Author)
Sales growth can be considered as a certain metric that helps in the measurement of the ability of
the business organizations to increase their sales revenue over a fixed period of time; and there is not any
exception of this fact in case of Blackmores. This section of the report takes into consideration the
analysis of various financial factors of Blackmores such as historical financial performance of the
company, orientation of the health supplement industry of Australia, the present economic situation of
BUSINESS VALUATION AND FINANCIAL ANALYSIS
2. Blackmore’s Prospective Analysis
It is an essential part of this report as this part of the report takes into consideration the prediction
of the future financial performance of Blakemores and the main aim of this is the estimation of the value
of the organizations with the use of various models for business valuation along with the sensitivity
analysis. In order to achieve these objectives, this report takes into consideration the financial statements
of the Blakemores from the year 2013 to 2018.
2.1 Future Financial Performance of Blackmores
This part of the report takes into consideration the future financial performance of Blakemores by
considering all the relevant aspects like historical data, industry condition, economic condition and others.
2.1.1 Growth Rate of Sales
2014
2015
2016
2017
2018
2019
2020
2021
2022
2023
-30.00% -20.00% -10.00% 0.00% 10.00% 20.00% 30.00% 40.00% 50.00% 60.00%
6.17%
36.01%
52.08%
-23.01%
8.87%
2.50%
2.50%
2.50%
2.50%
2.50%
Sales Growth Rate
Forecasted
Actual
Figure 1: Sales Growth Rate of Blackmores Limited
Source: (Created by the Author)
Sales growth can be considered as a certain metric that helps in the measurement of the ability of
the business organizations to increase their sales revenue over a fixed period of time; and there is not any
exception of this fact in case of Blackmores. This section of the report takes into consideration the
analysis of various financial factors of Blackmores such as historical financial performance of the
company, orientation of the health supplement industry of Australia, the present economic situation of
5
BUSINESS VALUATION AND FINANCIAL ANALYSIS
Australia, the nature of the business of Blackmores and others as all these aspects are required for
forecasting the sales growth of Blackmores for the next five years (Wales, Parida and Patel 2013).
The above figure indicates towards the fact that the growth of the sales of Blackmores is steady at
2.5% from the year 2019 to 2023. Steadiness in sales growth can be considered as a good indicator for the
sustainability of the company as it provides the motivation to the potential investors in invest in
Blackmores in the presence of steady sales growth. It can be observed from the historical performance of
Blackmores over the years that there have been some major fluctuations in the growth of the sales for the
company. As per the above table, the year 2014 witnessed small growth on sales that is 6.17%, but the
opposite situation can be seen in the year 2015 as the company registered huge growth in sales as
compared to 2014 that is 36.01%. As per the same trend, Blackmores registered growth in sales in the year
2016 that is 52.08%. The presence of some major contributors to this growth can be seen in Blackmores
like the expansion of the business of the company in China in the year 2015 as it has strengthen the
opportunity for investment in the company (Delen, Kuzey and Uyar 2013).
In addition, in the sale year, Blackmores added 170 new products too their product portfolio in
order to cater to the ever increasing demand of the customers. Apart from this, as a part of the strategy to
decrease the number of competitors, Blackmores acquired some major companies in the same industry
that led to the increase in sales. For example, Blackmores made the 100% acquisition of the shares of New
Century Herbals Pty Ltd and Global Therapeutics in the year 2016 in order to increase the sales growth by
increasing the amount of customers. Moreover, the nature of the product of Blackmores along with the
nature of the market provides the company with the opportunity to increase the sales. In addition,
expansion in China has majorly helped the company in increasing the sales due to the huge population of
the country (Coad, Segarra and Teruel 2016).
⊘ This is a preview!⊘
Do you want full access?
Subscribe today to unlock all pages.
Trusted by 1+ million students worldwide
6
BUSINESS VALUATION AND FINANCIAL ANALYSIS
2.1.2 Profit Margin
2014 2015 2016 2017 2018 2019 2020 2021 2022 2023
0.00%
2.00%
4.00%
6.00%
8.00%
10.00%
12.00%
14.00%
16.00%
7.33%
9.87%
13.95%
10.51%
11.52%
9.50%
6.00% 6.00% 6.00% 6.00%
Profit Margin
ForecastedActual
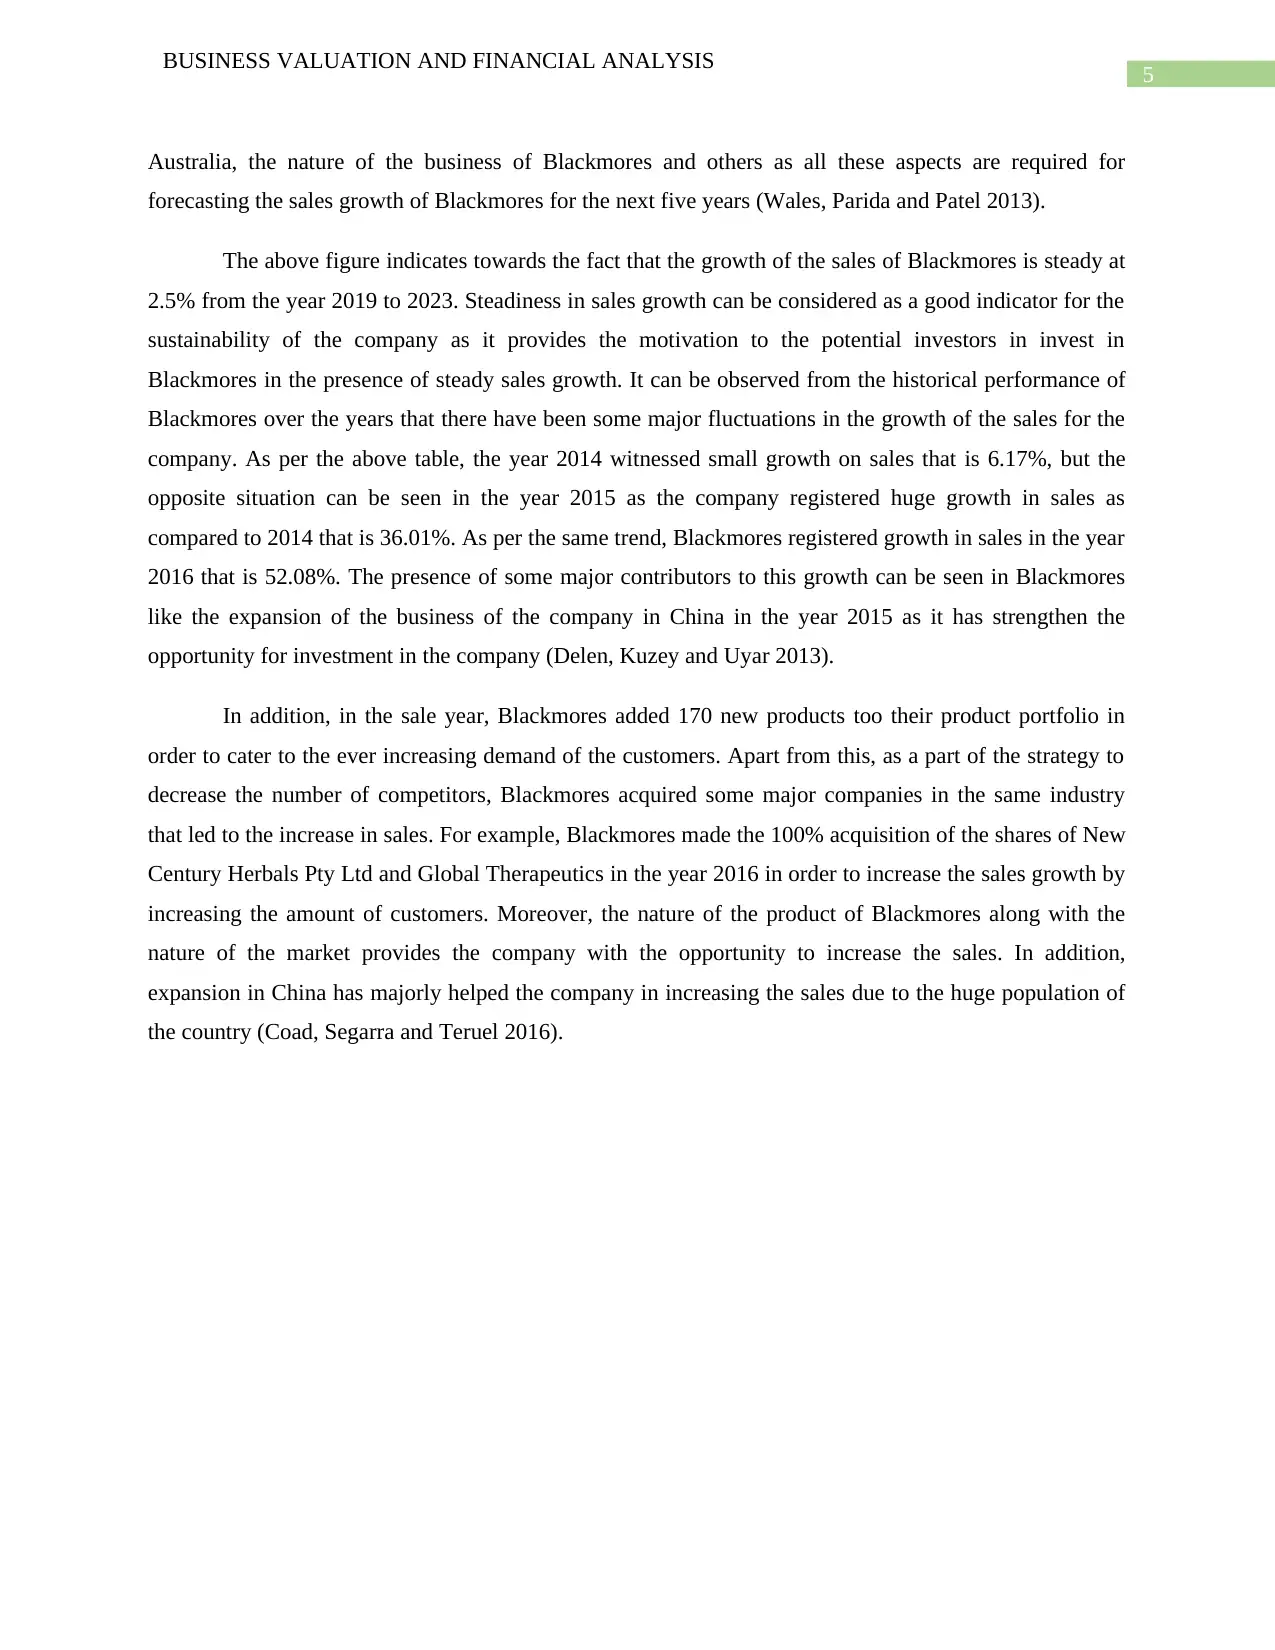
Figure 2: Profit Margin of Blackmores Limited
Source: (Created by the Author)
Profit margin is considered as another major indicator for the financial performance of the
companies and there is not any exception of this fact in case of Blackmores (Heikal, Khaddafi and
Ummah 2014). It is required to be mentioned that the management of the company considers Cost of
Goods Sold (COGS) as one of the major costs of their business as it contributes towards more than 30%
sales for Blackmores. For this reason, COGS has the uppermost impact on the profit margin of
Blackmores. Economy Forecast Agency has indicated towards the fact that there will be minor drop in the
exchange rate of AUD/CNY in the next five years and the effect of this will lead to the increase in COGS
for Blackmores. From the point of view of the sales, the result of depreciation of AUD against CNY will
cause in the increase in sales along with the increase in the other costs simultaneously (Delen, Kuzey and
Uyar 2013). The fact is observable from the profit margin forecast in figure 2 that there will be decrease in
the profit margin for Blackmores in the coming two years, but the profit margin will be steady after those
two years.
BUSINESS VALUATION AND FINANCIAL ANALYSIS
2.1.2 Profit Margin
2014 2015 2016 2017 2018 2019 2020 2021 2022 2023
0.00%
2.00%
4.00%
6.00%
8.00%
10.00%
12.00%
14.00%
16.00%
7.33%
9.87%
13.95%
10.51%
11.52%
9.50%
6.00% 6.00% 6.00% 6.00%
Profit Margin
ForecastedActual
Figure 2: Profit Margin of Blackmores Limited
Source: (Created by the Author)
Profit margin is considered as another major indicator for the financial performance of the
companies and there is not any exception of this fact in case of Blackmores (Heikal, Khaddafi and
Ummah 2014). It is required to be mentioned that the management of the company considers Cost of
Goods Sold (COGS) as one of the major costs of their business as it contributes towards more than 30%
sales for Blackmores. For this reason, COGS has the uppermost impact on the profit margin of
Blackmores. Economy Forecast Agency has indicated towards the fact that there will be minor drop in the
exchange rate of AUD/CNY in the next five years and the effect of this will lead to the increase in COGS
for Blackmores. From the point of view of the sales, the result of depreciation of AUD against CNY will
cause in the increase in sales along with the increase in the other costs simultaneously (Delen, Kuzey and
Uyar 2013). The fact is observable from the profit margin forecast in figure 2 that there will be decrease in
the profit margin for Blackmores in the coming two years, but the profit margin will be steady after those
two years.
Paraphrase This Document
Need a fresh take? Get an instant paraphrase of this document with our AI Paraphraser
7
BUSINESS VALUATION AND FINANCIAL ANALYSIS
2.1.3 Asset Turnover
2014 2015 2016 2017 2018 2019 2020 2021 2022 2023
0.00
0.50
1.00
1.50
2.00
2.50
3.00
1.48
1.78
1.97
1.31 1.37
2.50 2.50 2.50 2.50 2.50
Assets Turnover Ratio
ForecastedActual
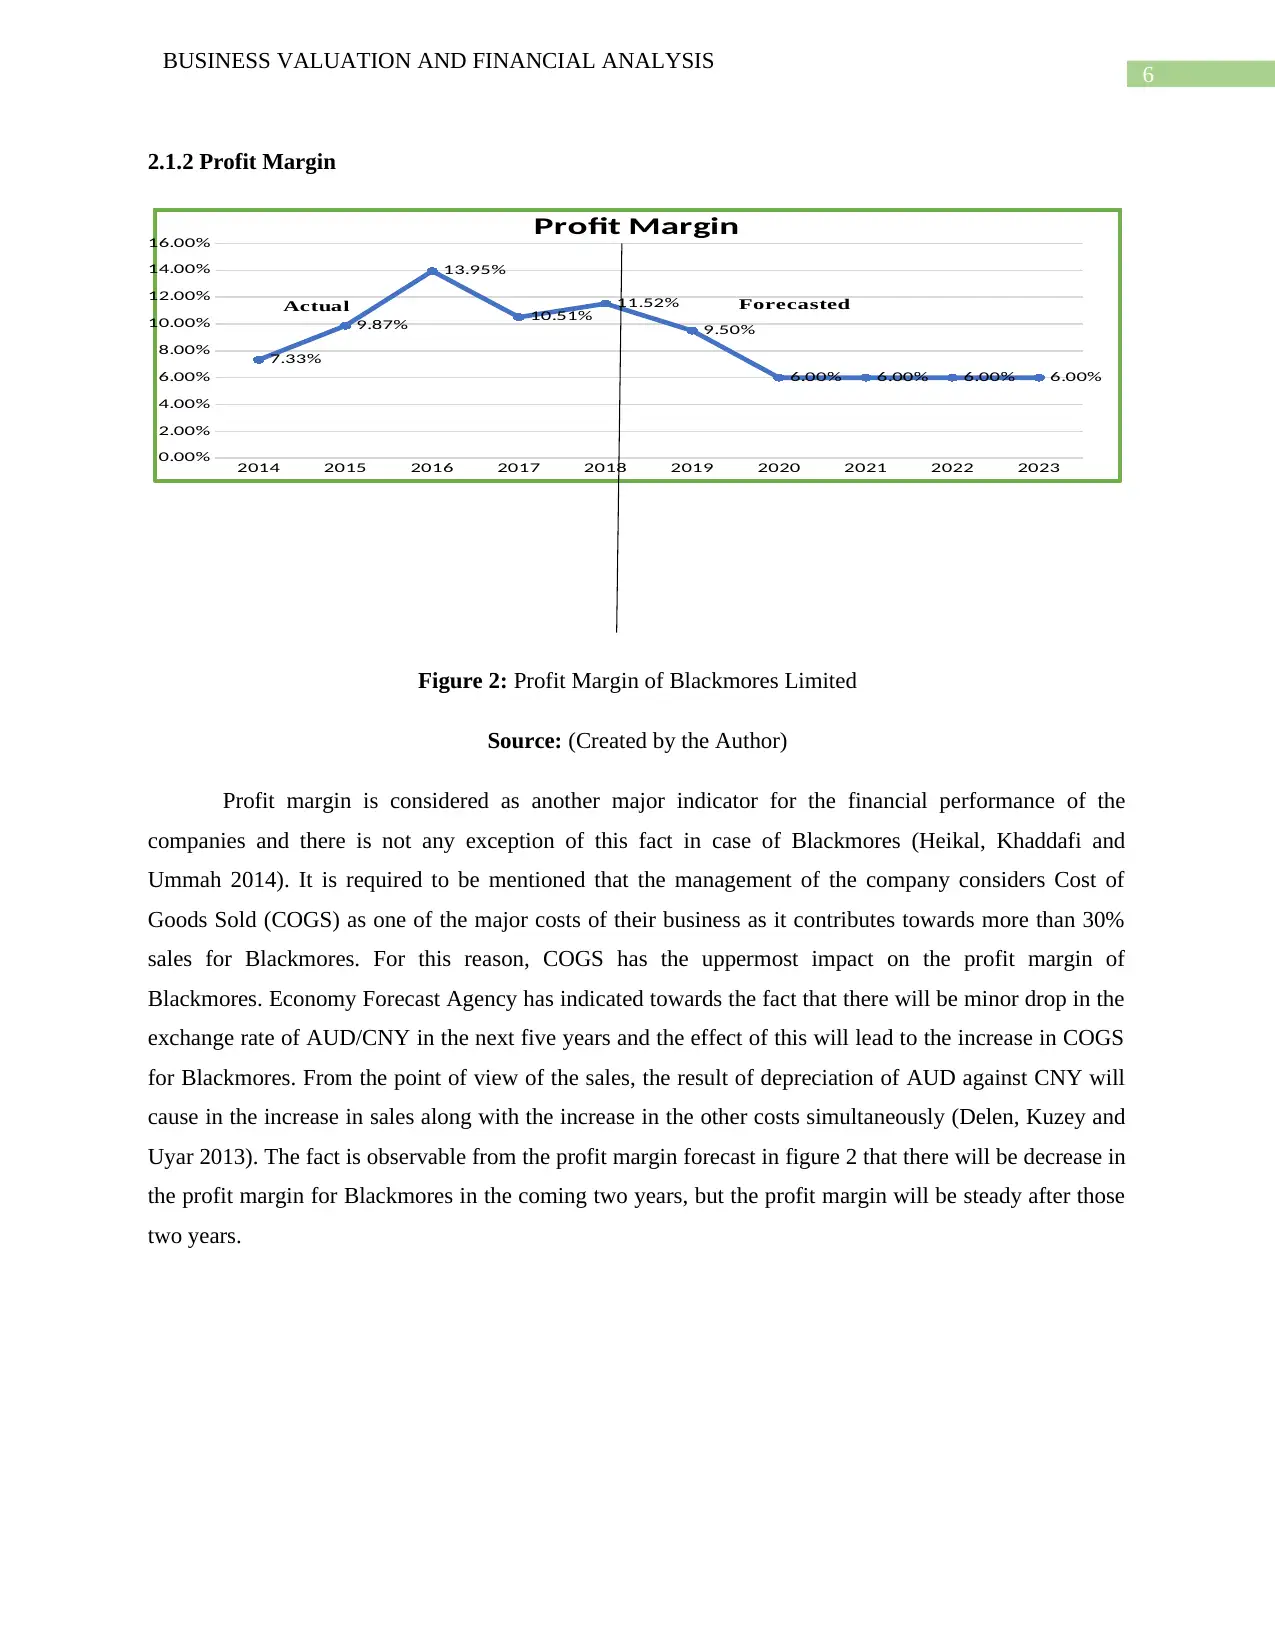
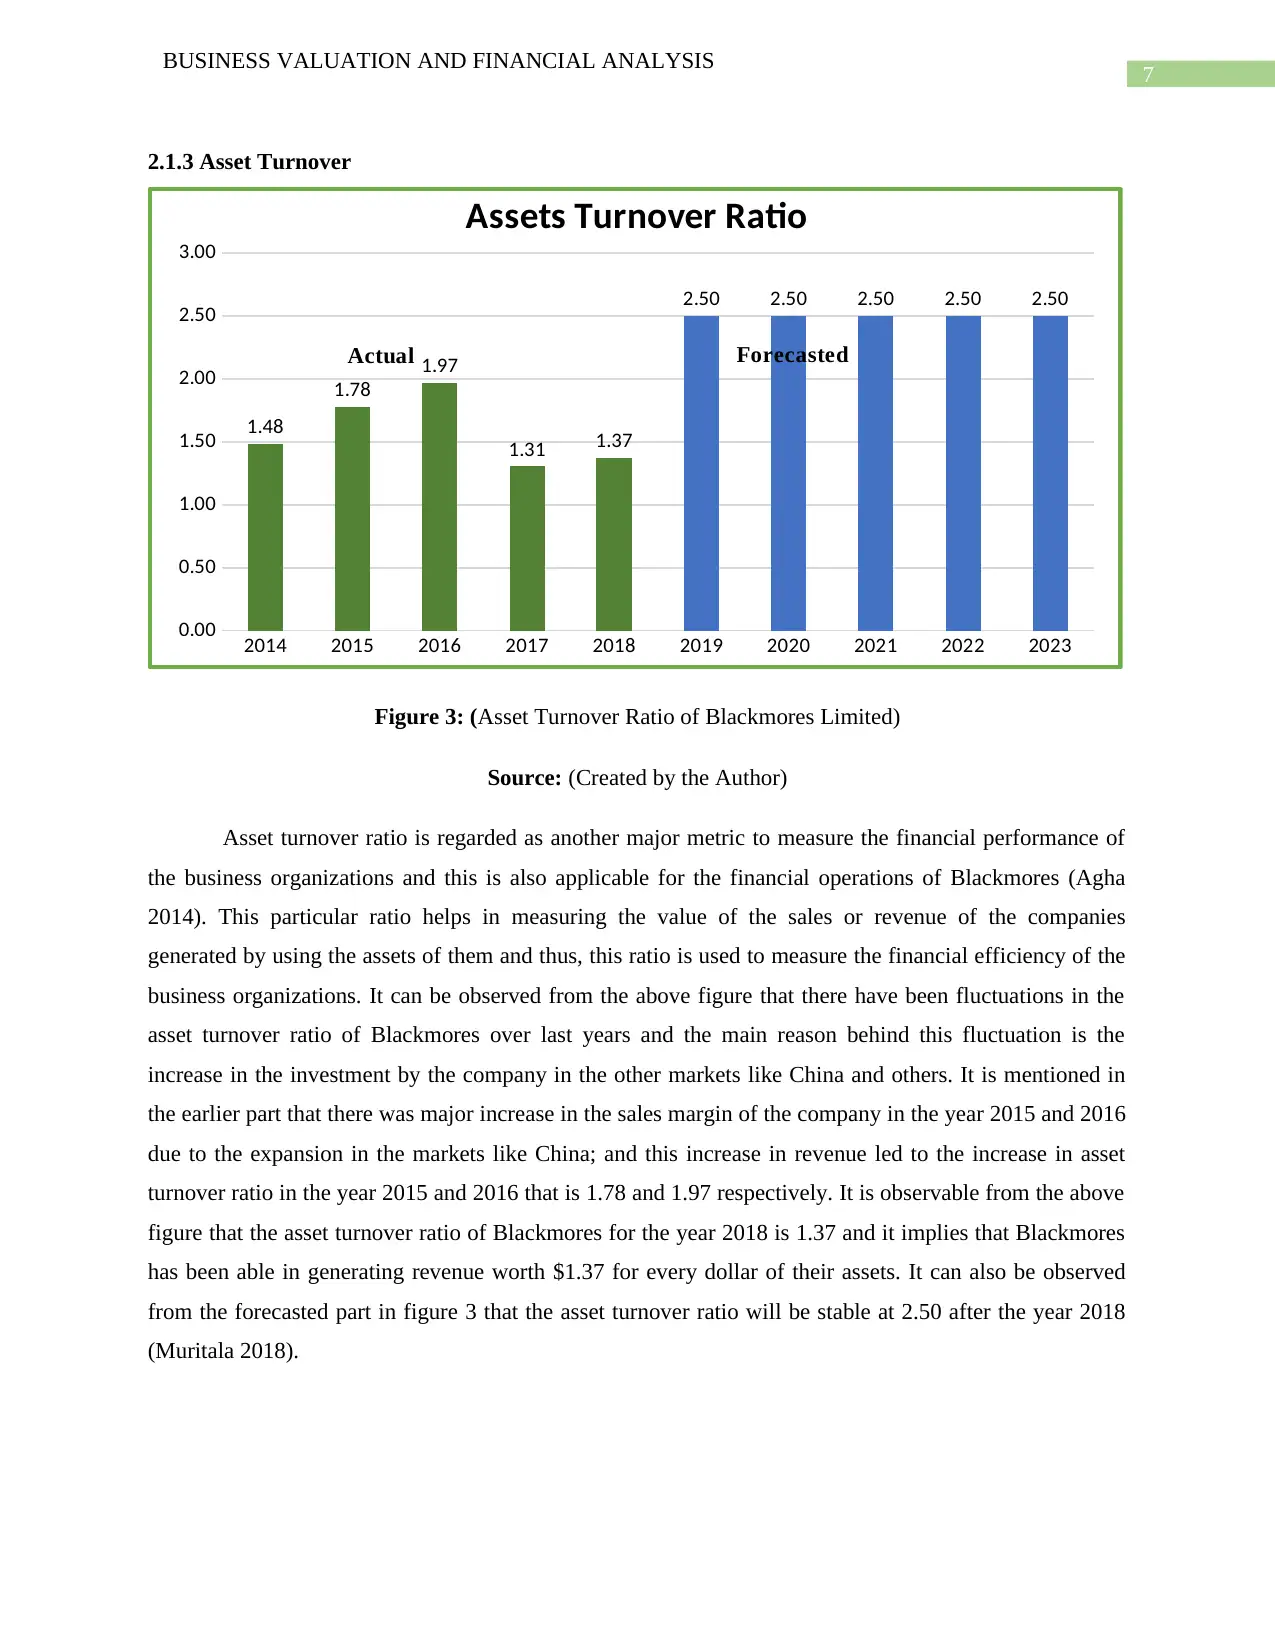
Figure 3: (Asset Turnover Ratio of Blackmores Limited)
Source: (Created by the Author)
Asset turnover ratio is regarded as another major metric to measure the financial performance of
the business organizations and this is also applicable for the financial operations of Blackmores (Agha
2014). This particular ratio helps in measuring the value of the sales or revenue of the companies
generated by using the assets of them and thus, this ratio is used to measure the financial efficiency of the
business organizations. It can be observed from the above figure that there have been fluctuations in the
asset turnover ratio of Blackmores over last years and the main reason behind this fluctuation is the
increase in the investment by the company in the other markets like China and others. It is mentioned in
the earlier part that there was major increase in the sales margin of the company in the year 2015 and 2016
due to the expansion in the markets like China; and this increase in revenue led to the increase in asset
turnover ratio in the year 2015 and 2016 that is 1.78 and 1.97 respectively. It is observable from the above
figure that the asset turnover ratio of Blackmores for the year 2018 is 1.37 and it implies that Blackmores
has been able in generating revenue worth $1.37 for every dollar of their assets. It can also be observed
from the forecasted part in figure 3 that the asset turnover ratio will be stable at 2.50 after the year 2018
(Muritala 2018).
BUSINESS VALUATION AND FINANCIAL ANALYSIS
2.1.3 Asset Turnover
2014 2015 2016 2017 2018 2019 2020 2021 2022 2023
0.00
0.50
1.00
1.50
2.00
2.50
3.00
1.48
1.78
1.97
1.31 1.37
2.50 2.50 2.50 2.50 2.50
Assets Turnover Ratio
ForecastedActual
Figure 3: (Asset Turnover Ratio of Blackmores Limited)
Source: (Created by the Author)
Asset turnover ratio is regarded as another major metric to measure the financial performance of
the business organizations and this is also applicable for the financial operations of Blackmores (Agha
2014). This particular ratio helps in measuring the value of the sales or revenue of the companies
generated by using the assets of them and thus, this ratio is used to measure the financial efficiency of the
business organizations. It can be observed from the above figure that there have been fluctuations in the
asset turnover ratio of Blackmores over last years and the main reason behind this fluctuation is the
increase in the investment by the company in the other markets like China and others. It is mentioned in
the earlier part that there was major increase in the sales margin of the company in the year 2015 and 2016
due to the expansion in the markets like China; and this increase in revenue led to the increase in asset
turnover ratio in the year 2015 and 2016 that is 1.78 and 1.97 respectively. It is observable from the above
figure that the asset turnover ratio of Blackmores for the year 2018 is 1.37 and it implies that Blackmores
has been able in generating revenue worth $1.37 for every dollar of their assets. It can also be observed
from the forecasted part in figure 3 that the asset turnover ratio will be stable at 2.50 after the year 2018
(Muritala 2018).
8
BUSINESS VALUATION AND FINANCIAL ANALYSIS
2.1.4 Net Dividend Payout
2014 2015 2016 2017 2018 2019 2020 2021 2022 2023
0.00%
20.00%
40.00%
60.00%
80.00%
100.00%
120.00%
84.91%
55.75% 57.69%
100.93%
72.17% 68.00% 68.00% 68.00% 68.00% 68.00%
Net Dividend Payout
Forecaste
d
Actual
Figure 4: (Net Dividend Payout for Blackmores Limited)
Source: (Created by the Author)
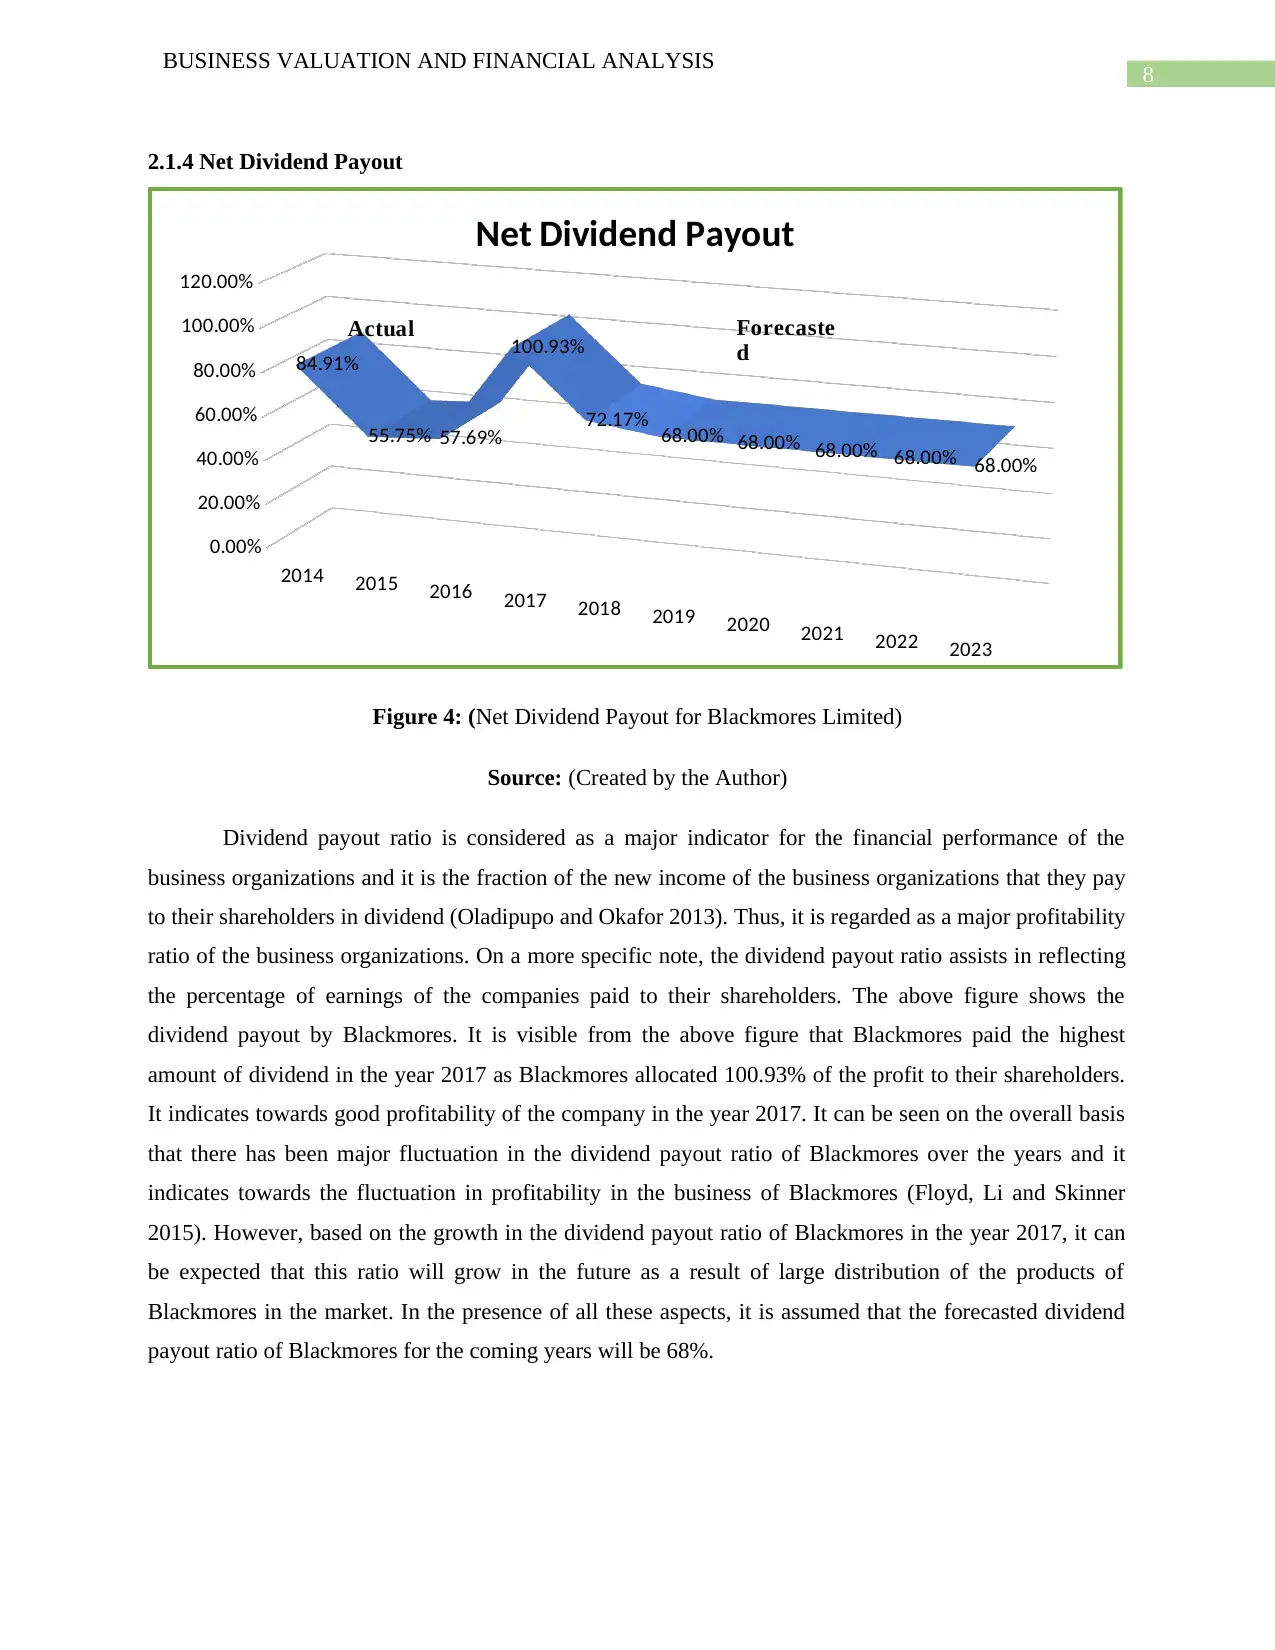
Dividend payout ratio is considered as a major indicator for the financial performance of the
business organizations and it is the fraction of the new income of the business organizations that they pay
to their shareholders in dividend (Oladipupo and Okafor 2013). Thus, it is regarded as a major profitability
ratio of the business organizations. On a more specific note, the dividend payout ratio assists in reflecting
the percentage of earnings of the companies paid to their shareholders. The above figure shows the
dividend payout by Blackmores. It is visible from the above figure that Blackmores paid the highest
amount of dividend in the year 2017 as Blackmores allocated 100.93% of the profit to their shareholders.
It indicates towards good profitability of the company in the year 2017. It can be seen on the overall basis
that there has been major fluctuation in the dividend payout ratio of Blackmores over the years and it
indicates towards the fluctuation in profitability in the business of Blackmores (Floyd, Li and Skinner
2015). However, based on the growth in the dividend payout ratio of Blackmores in the year 2017, it can
be expected that this ratio will grow in the future as a result of large distribution of the products of
Blackmores in the market. In the presence of all these aspects, it is assumed that the forecasted dividend
payout ratio of Blackmores for the coming years will be 68%.
BUSINESS VALUATION AND FINANCIAL ANALYSIS
2.1.4 Net Dividend Payout
2014 2015 2016 2017 2018 2019 2020 2021 2022 2023
0.00%
20.00%
40.00%
60.00%
80.00%
100.00%
120.00%
84.91%
55.75% 57.69%
100.93%
72.17% 68.00% 68.00% 68.00% 68.00% 68.00%
Net Dividend Payout
Forecaste
d
Actual
Figure 4: (Net Dividend Payout for Blackmores Limited)
Source: (Created by the Author)
Dividend payout ratio is considered as a major indicator for the financial performance of the
business organizations and it is the fraction of the new income of the business organizations that they pay
to their shareholders in dividend (Oladipupo and Okafor 2013). Thus, it is regarded as a major profitability
ratio of the business organizations. On a more specific note, the dividend payout ratio assists in reflecting
the percentage of earnings of the companies paid to their shareholders. The above figure shows the
dividend payout by Blackmores. It is visible from the above figure that Blackmores paid the highest
amount of dividend in the year 2017 as Blackmores allocated 100.93% of the profit to their shareholders.
It indicates towards good profitability of the company in the year 2017. It can be seen on the overall basis
that there has been major fluctuation in the dividend payout ratio of Blackmores over the years and it
indicates towards the fluctuation in profitability in the business of Blackmores (Floyd, Li and Skinner
2015). However, based on the growth in the dividend payout ratio of Blackmores in the year 2017, it can
be expected that this ratio will grow in the future as a result of large distribution of the products of
Blackmores in the market. In the presence of all these aspects, it is assumed that the forecasted dividend
payout ratio of Blackmores for the coming years will be 68%.
⊘ This is a preview!⊘
Do you want full access?
Subscribe today to unlock all pages.
Trusted by 1+ million students worldwide
9
BUSINESS VALUATION AND FINANCIAL ANALYSIS
2.1.5 Cost of Debt after Tax
2014 2015 2016 2017 2018 2019 2020 2021 2022 2023
0.00%
1.00%
2.00%
3.00%
4.00%
5.00%
6.00%
7.00%
4.92%
6.12%
2.87%
4.05% 3.54% 3.50% 3.50% 3.50% 3.50%
0.00%
Cost of Debt after Tax
Forecaste
dActual
Figure 5: Cost of Debt after Tax of Blackmores Limited
Source: (Created by the Author)
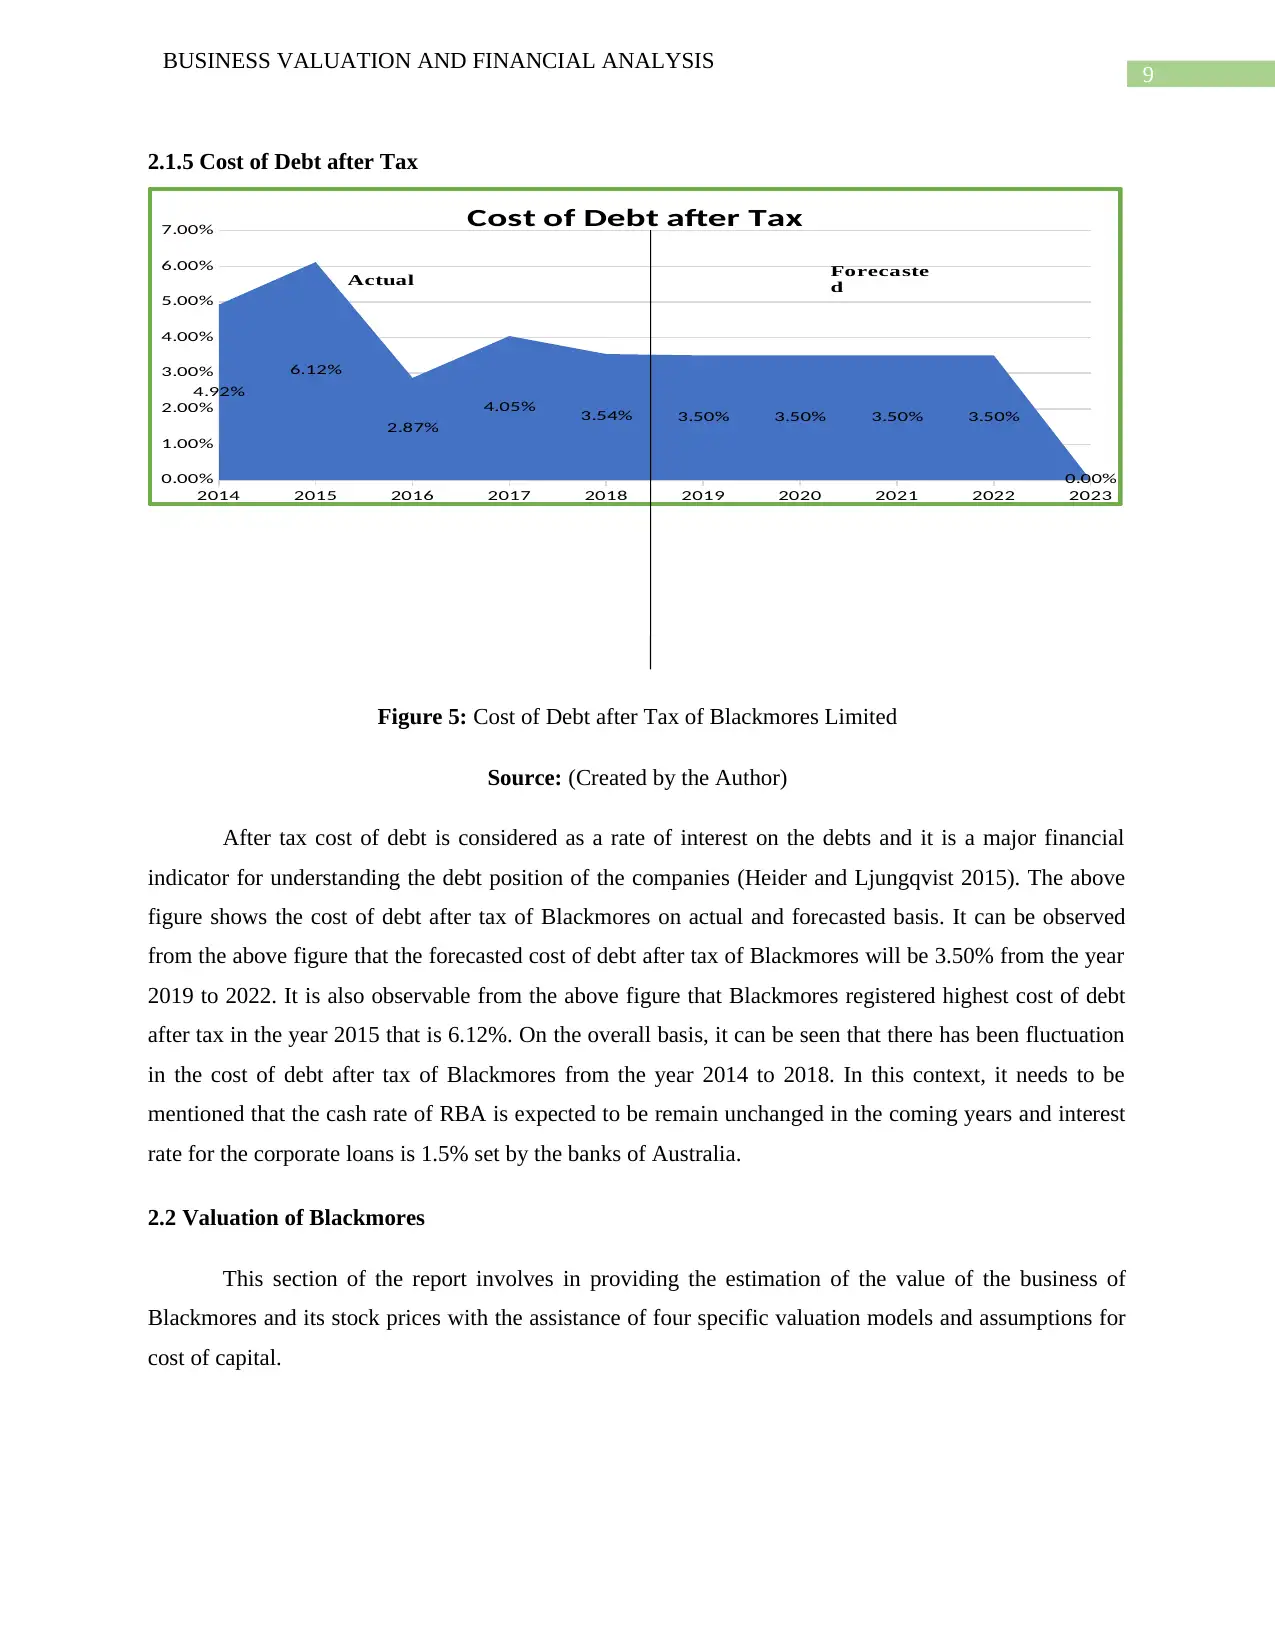
After tax cost of debt is considered as a rate of interest on the debts and it is a major financial
indicator for understanding the debt position of the companies (Heider and Ljungqvist 2015). The above
figure shows the cost of debt after tax of Blackmores on actual and forecasted basis. It can be observed
from the above figure that the forecasted cost of debt after tax of Blackmores will be 3.50% from the year
2019 to 2022. It is also observable from the above figure that Blackmores registered highest cost of debt
after tax in the year 2015 that is 6.12%. On the overall basis, it can be seen that there has been fluctuation
in the cost of debt after tax of Blackmores from the year 2014 to 2018. In this context, it needs to be
mentioned that the cash rate of RBA is expected to be remain unchanged in the coming years and interest
rate for the corporate loans is 1.5% set by the banks of Australia.
2.2 Valuation of Blackmores
This section of the report involves in providing the estimation of the value of the business of
Blackmores and its stock prices with the assistance of four specific valuation models and assumptions for
cost of capital.
BUSINESS VALUATION AND FINANCIAL ANALYSIS
2.1.5 Cost of Debt after Tax
2014 2015 2016 2017 2018 2019 2020 2021 2022 2023
0.00%
1.00%
2.00%
3.00%
4.00%
5.00%
6.00%
7.00%
4.92%
6.12%
2.87%
4.05% 3.54% 3.50% 3.50% 3.50% 3.50%
0.00%
Cost of Debt after Tax
Forecaste
dActual
Figure 5: Cost of Debt after Tax of Blackmores Limited
Source: (Created by the Author)
After tax cost of debt is considered as a rate of interest on the debts and it is a major financial
indicator for understanding the debt position of the companies (Heider and Ljungqvist 2015). The above
figure shows the cost of debt after tax of Blackmores on actual and forecasted basis. It can be observed
from the above figure that the forecasted cost of debt after tax of Blackmores will be 3.50% from the year
2019 to 2022. It is also observable from the above figure that Blackmores registered highest cost of debt
after tax in the year 2015 that is 6.12%. On the overall basis, it can be seen that there has been fluctuation
in the cost of debt after tax of Blackmores from the year 2014 to 2018. In this context, it needs to be
mentioned that the cash rate of RBA is expected to be remain unchanged in the coming years and interest
rate for the corporate loans is 1.5% set by the banks of Australia.
2.2 Valuation of Blackmores
This section of the report involves in providing the estimation of the value of the business of
Blackmores and its stock prices with the assistance of four specific valuation models and assumptions for
cost of capital.
Paraphrase This Document
Need a fresh take? Get an instant paraphrase of this document with our AI Paraphraser
10
BUSINESS VALUATION AND FINANCIAL ANALYSIS
2.2.1 Assumptions for the Valuations
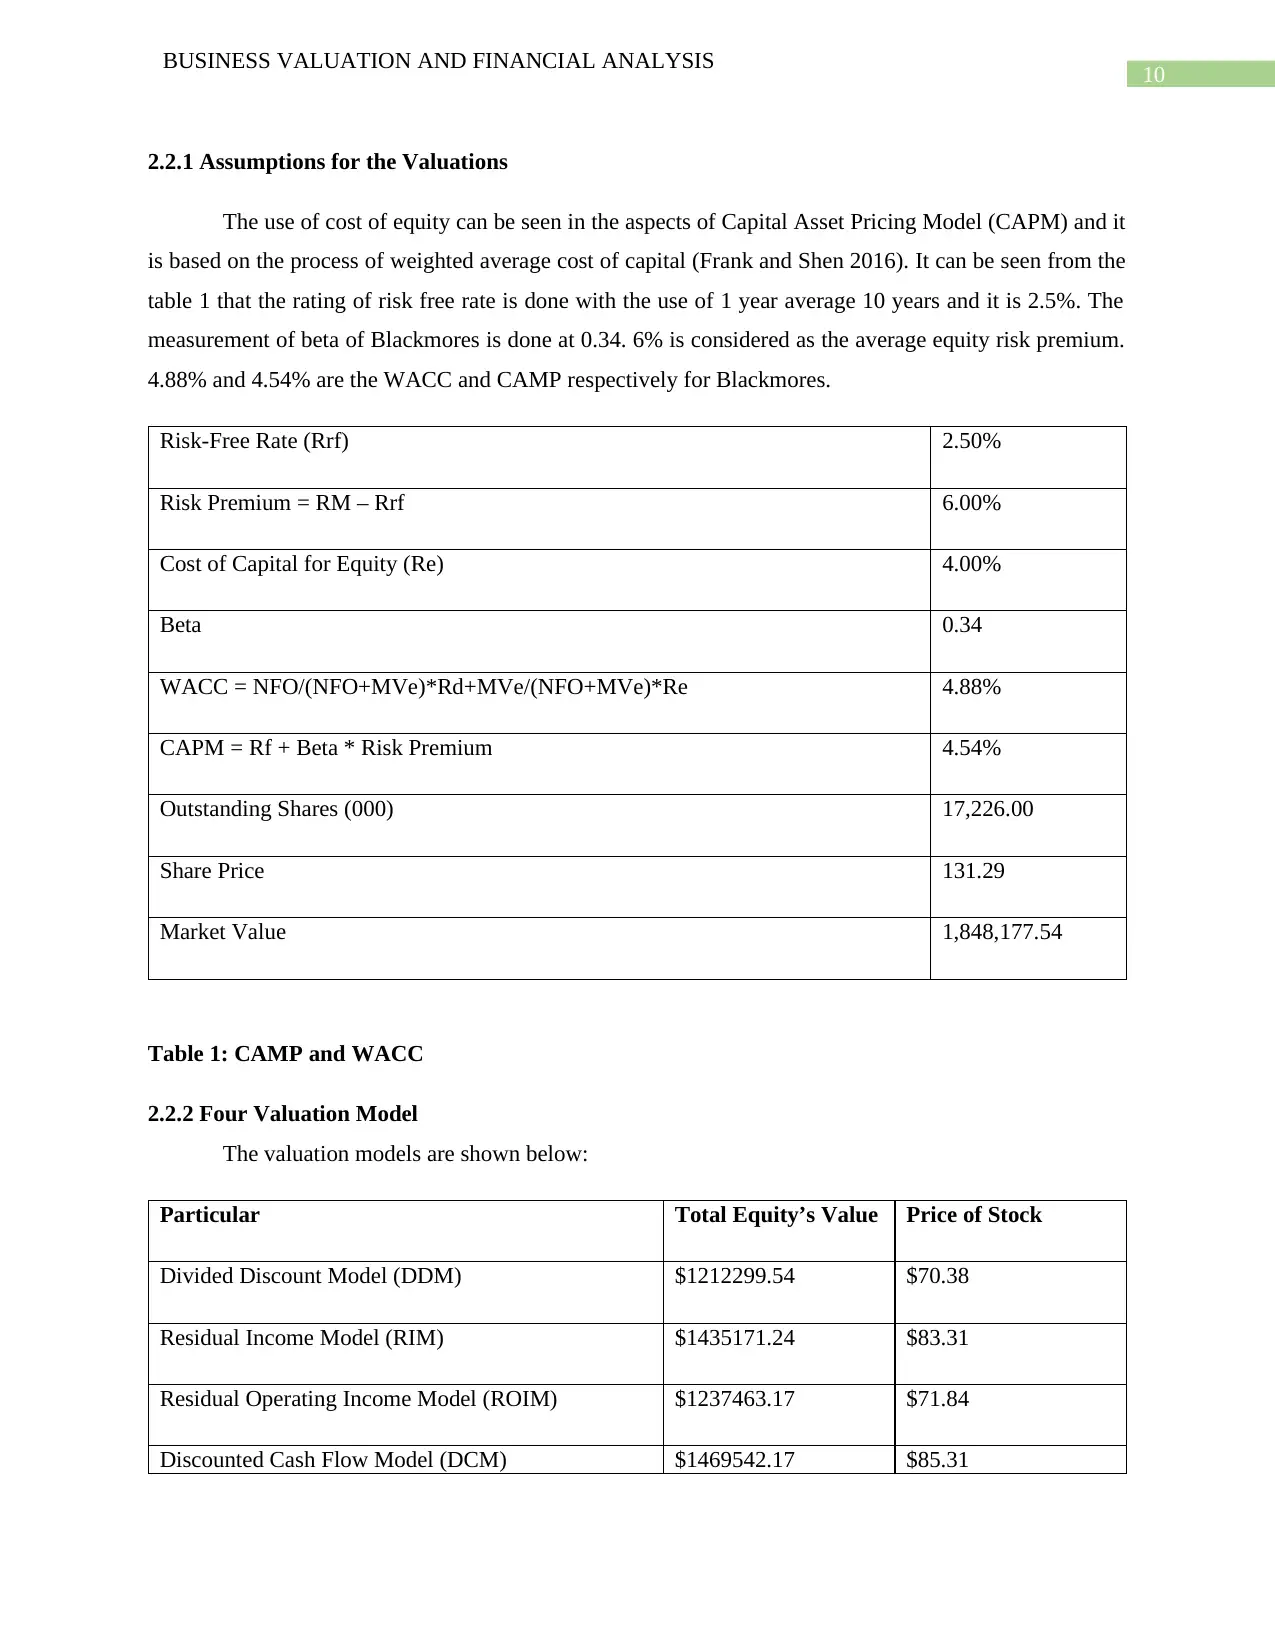
The use of cost of equity can be seen in the aspects of Capital Asset Pricing Model (CAPM) and it
is based on the process of weighted average cost of capital (Frank and Shen 2016). It can be seen from the
table 1 that the rating of risk free rate is done with the use of 1 year average 10 years and it is 2.5%. The
measurement of beta of Blackmores is done at 0.34. 6% is considered as the average equity risk premium.
4.88% and 4.54% are the WACC and CAMP respectively for Blackmores.
Risk-Free Rate (Rrf) 2.50%
Risk Premium = RM – Rrf 6.00%
Cost of Capital for Equity (Re) 4.00%
Beta 0.34
WACC = NFO/(NFO+MVe)*Rd+MVe/(NFO+MVe)*Re 4.88%
CAPM = Rf + Beta * Risk Premium 4.54%
Outstanding Shares (000) 17,226.00
Share Price 131.29
Market Value 1,848,177.54
Table 1: CAMP and WACC
2.2.2 Four Valuation Model
The valuation models are shown below:
Particular Total Equity’s Value Price of Stock
Divided Discount Model (DDM) $1212299.54 $70.38
Residual Income Model (RIM) $1435171.24 $83.31
Residual Operating Income Model (ROIM) $1237463.17 $71.84
Discounted Cash Flow Model (DCM) $1469542.17 $85.31
BUSINESS VALUATION AND FINANCIAL ANALYSIS
2.2.1 Assumptions for the Valuations
The use of cost of equity can be seen in the aspects of Capital Asset Pricing Model (CAPM) and it
is based on the process of weighted average cost of capital (Frank and Shen 2016). It can be seen from the
table 1 that the rating of risk free rate is done with the use of 1 year average 10 years and it is 2.5%. The
measurement of beta of Blackmores is done at 0.34. 6% is considered as the average equity risk premium.
4.88% and 4.54% are the WACC and CAMP respectively for Blackmores.
Risk-Free Rate (Rrf) 2.50%
Risk Premium = RM – Rrf 6.00%
Cost of Capital for Equity (Re) 4.00%
Beta 0.34
WACC = NFO/(NFO+MVe)*Rd+MVe/(NFO+MVe)*Re 4.88%
CAPM = Rf + Beta * Risk Premium 4.54%
Outstanding Shares (000) 17,226.00
Share Price 131.29
Market Value 1,848,177.54
Table 1: CAMP and WACC
2.2.2 Four Valuation Model
The valuation models are shown below:
Particular Total Equity’s Value Price of Stock
Divided Discount Model (DDM) $1212299.54 $70.38
Residual Income Model (RIM) $1435171.24 $83.31
Residual Operating Income Model (ROIM) $1237463.17 $71.84
Discounted Cash Flow Model (DCM) $1469542.17 $85.31
11
BUSINESS VALUATION AND FINANCIAL ANALYSIS
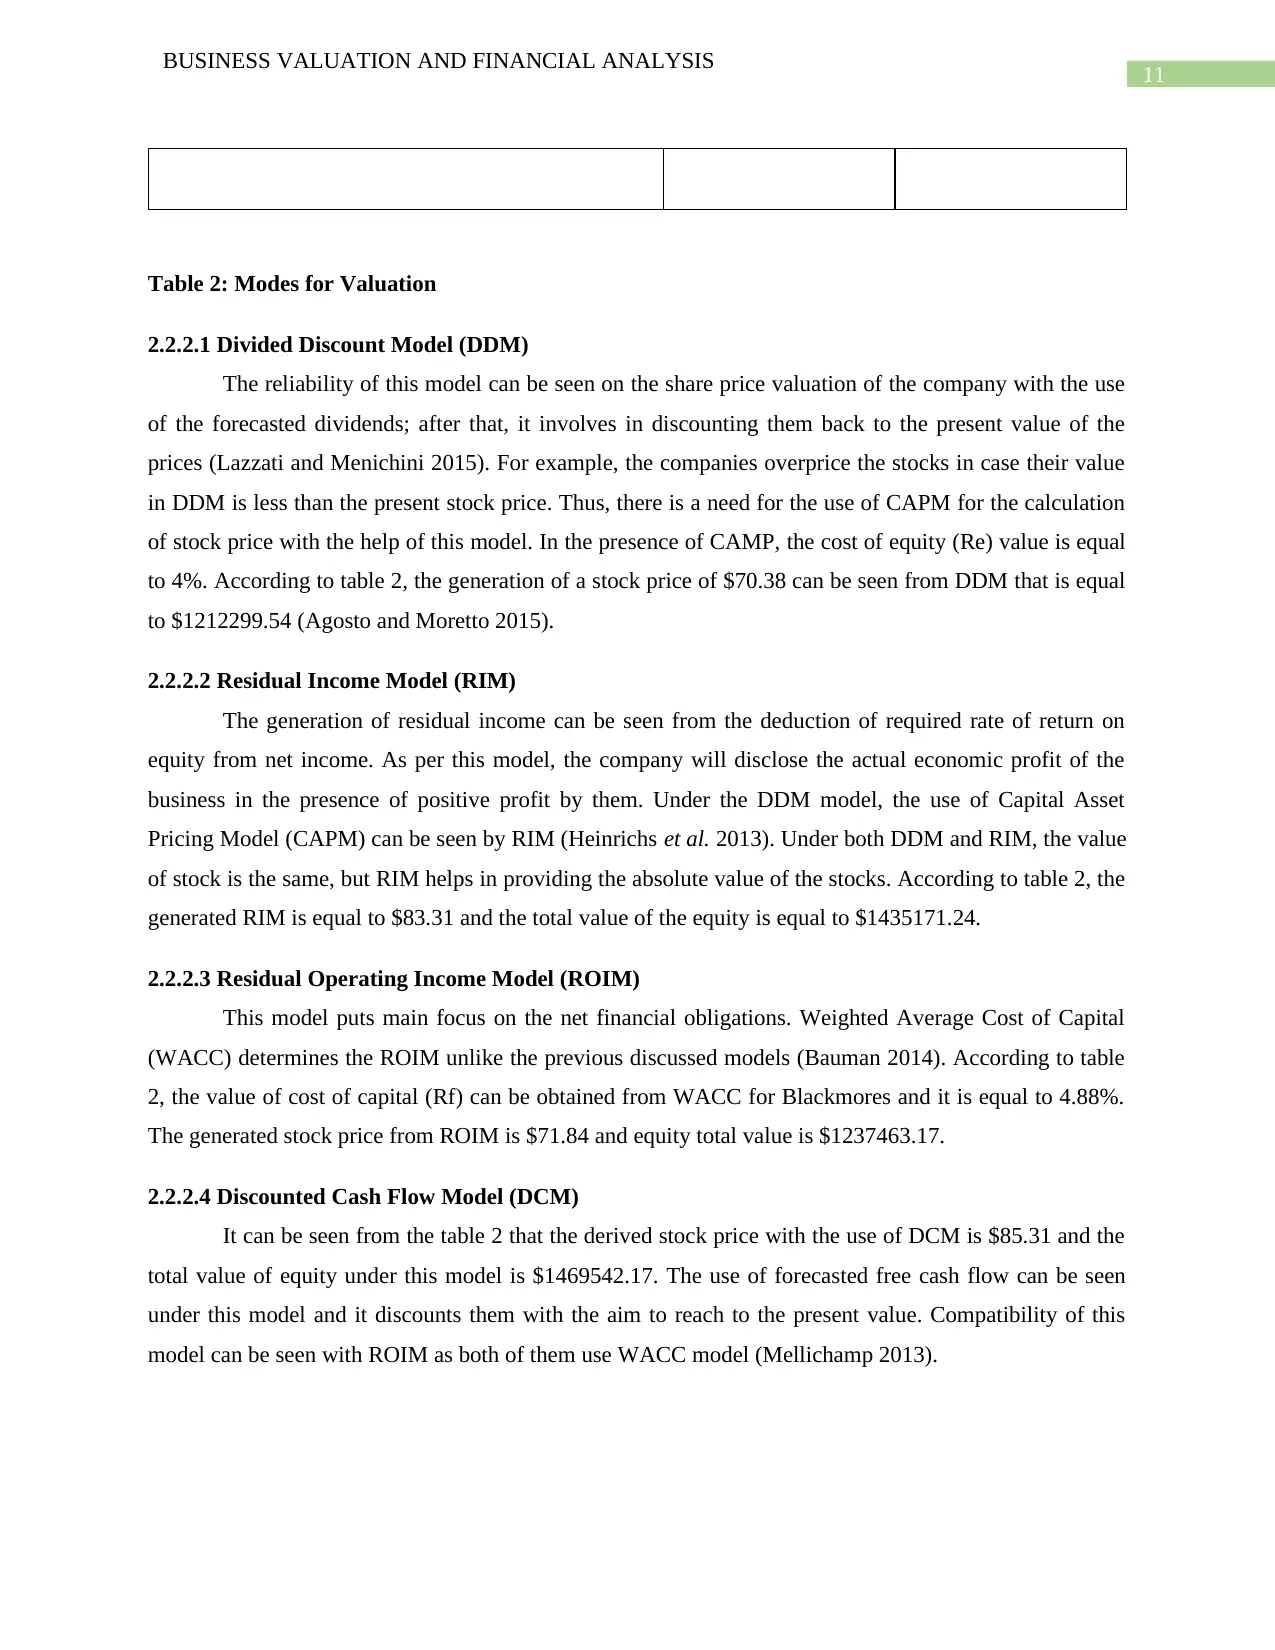
Table 2: Modes for Valuation
2.2.2.1 Divided Discount Model (DDM)
The reliability of this model can be seen on the share price valuation of the company with the use
of the forecasted dividends; after that, it involves in discounting them back to the present value of the
prices (Lazzati and Menichini 2015). For example, the companies overprice the stocks in case their value
in DDM is less than the present stock price. Thus, there is a need for the use of CAPM for the calculation
of stock price with the help of this model. In the presence of CAMP, the cost of equity (Re) value is equal
to 4%. According to table 2, the generation of a stock price of $70.38 can be seen from DDM that is equal
to $1212299.54 (Agosto and Moretto 2015).
2.2.2.2 Residual Income Model (RIM)
The generation of residual income can be seen from the deduction of required rate of return on
equity from net income. As per this model, the company will disclose the actual economic profit of the
business in the presence of positive profit by them. Under the DDM model, the use of Capital Asset
Pricing Model (CAPM) can be seen by RIM (Heinrichs et al. 2013). Under both DDM and RIM, the value
of stock is the same, but RIM helps in providing the absolute value of the stocks. According to table 2, the
generated RIM is equal to $83.31 and the total value of the equity is equal to $1435171.24.
2.2.2.3 Residual Operating Income Model (ROIM)
This model puts main focus on the net financial obligations. Weighted Average Cost of Capital
(WACC) determines the ROIM unlike the previous discussed models (Bauman 2014). According to table
2, the value of cost of capital (Rf) can be obtained from WACC for Blackmores and it is equal to 4.88%.
The generated stock price from ROIM is $71.84 and equity total value is $1237463.17.
2.2.2.4 Discounted Cash Flow Model (DCM)
It can be seen from the table 2 that the derived stock price with the use of DCM is $85.31 and the
total value of equity under this model is $1469542.17. The use of forecasted free cash flow can be seen
under this model and it discounts them with the aim to reach to the present value. Compatibility of this
model can be seen with ROIM as both of them use WACC model (Mellichamp 2013).
BUSINESS VALUATION AND FINANCIAL ANALYSIS
Table 2: Modes for Valuation
2.2.2.1 Divided Discount Model (DDM)
The reliability of this model can be seen on the share price valuation of the company with the use
of the forecasted dividends; after that, it involves in discounting them back to the present value of the
prices (Lazzati and Menichini 2015). For example, the companies overprice the stocks in case their value
in DDM is less than the present stock price. Thus, there is a need for the use of CAPM for the calculation
of stock price with the help of this model. In the presence of CAMP, the cost of equity (Re) value is equal
to 4%. According to table 2, the generation of a stock price of $70.38 can be seen from DDM that is equal
to $1212299.54 (Agosto and Moretto 2015).
2.2.2.2 Residual Income Model (RIM)
The generation of residual income can be seen from the deduction of required rate of return on
equity from net income. As per this model, the company will disclose the actual economic profit of the
business in the presence of positive profit by them. Under the DDM model, the use of Capital Asset
Pricing Model (CAPM) can be seen by RIM (Heinrichs et al. 2013). Under both DDM and RIM, the value
of stock is the same, but RIM helps in providing the absolute value of the stocks. According to table 2, the
generated RIM is equal to $83.31 and the total value of the equity is equal to $1435171.24.
2.2.2.3 Residual Operating Income Model (ROIM)
This model puts main focus on the net financial obligations. Weighted Average Cost of Capital
(WACC) determines the ROIM unlike the previous discussed models (Bauman 2014). According to table
2, the value of cost of capital (Rf) can be obtained from WACC for Blackmores and it is equal to 4.88%.
The generated stock price from ROIM is $71.84 and equity total value is $1237463.17.
2.2.2.4 Discounted Cash Flow Model (DCM)
It can be seen from the table 2 that the derived stock price with the use of DCM is $85.31 and the
total value of equity under this model is $1469542.17. The use of forecasted free cash flow can be seen
under this model and it discounts them with the aim to reach to the present value. Compatibility of this
model can be seen with ROIM as both of them use WACC model (Mellichamp 2013).
⊘ This is a preview!⊘
Do you want full access?
Subscribe today to unlock all pages.
Trusted by 1+ million students worldwide
1 out of 26
Related Documents


Your All-in-One AI-Powered Toolkit for Academic Success.
+13062052269
info@desklib.com
Available 24*7 on WhatsApp / Email
![[object Object]](/_next/static/media/star-bottom.7253800d.svg)
Unlock your academic potential
Copyright © 2020–2026 A2Z Services. All Rights Reserved. Developed and managed by ZUCOL.