Project Report: Business Valuation and Analysis of Blackmores Limited
VerifiedAdded on 2023/06/07
|20
|4175
|64
Project
AI Summary
This project report provides a detailed business valuation and financial analysis of Blackmores Limited, an Australian health supplements company. The report examines the company's financial performance from 2013 to 2018, utilizing financial statements to conduct ratio analysis, including profitability, liquidity, and asset turnover ratios. It explores the impact of major expenses like raw materials, employee benefits, and selling/administrative costs on profit margins. The analysis also includes a cash flow assessment, covering liquidity and solvency, along with an evaluation of financial risk and cash flow management. The report concludes with an overview of the company's performance, emphasizing the importance of external and industry factors. The overall performance of Blackmores Limited was best in the year 2016.
Running Head: Business Valuation and Analysis
1
Project Report: Business Valuation and Analysis
1
Project Report: Business Valuation and Analysis
Paraphrase This Document
Need a fresh take? Get an instant paraphrase of this document with our AI Paraphraser
Business Valuation and Analysis 2
Contents
Introduction.......................................................................................................................3
Company overview...........................................................................................................3
Ratio analysis....................................................................................................................3
Impact of major expenses on profit margin..................................................................7
Ratio trend....................................................................................................................9
Cash flow analysis............................................................................................................9
Financial risk and cash flow management..................................................................11
Conclusion......................................................................................................................11
References.......................................................................................................................12
Appendix:.......................................................................................................................13
Business Valuation and Analysis 3
Introduction:
Identifying the financial performance and non financial performance of a business sis one of
crucial element in order to forecast the future performance and evaluate the total worth of a business.
The report has been prepared to evaluate the overall financial performance of an Australian company
named by Balckmores limited. The financial data from 2013 to 2018 has taken into concern to
measure the actual performance of the business. The reformatting of financial statement of the
company has been done in order to identify the operating and financial performance of the business.
And the ratio analysis and cash flow analysis has been done to identify the financial condition of the
company.
Company overview:
Blackmores limited is an Australian company which operates in the health supplements. It has
been founded in 1930 at Australia. It was the first health product shop in the Brisbane, Australia. The
market capitalization of the company is around $ 2 billion. 843 people are employed by the company
and the company mainly manufactures the herbal supplements, extensive range of vitamins etc which
are sold across the Australian, Asian and Europe market (annual report, 2017).
Ratio analysis:
Ratio analysis is a process which focuses on the main items of the final financial statements
of a business to evaluate the performance and make decision about the company. In case of
Blackmores, the financial ratios of the company from 2014-2018 has been calculated through
transforming the final financial statement into the operating and financial activities of the business.
The liquidity and profitability ratios of the business have been calculated which are as follows:
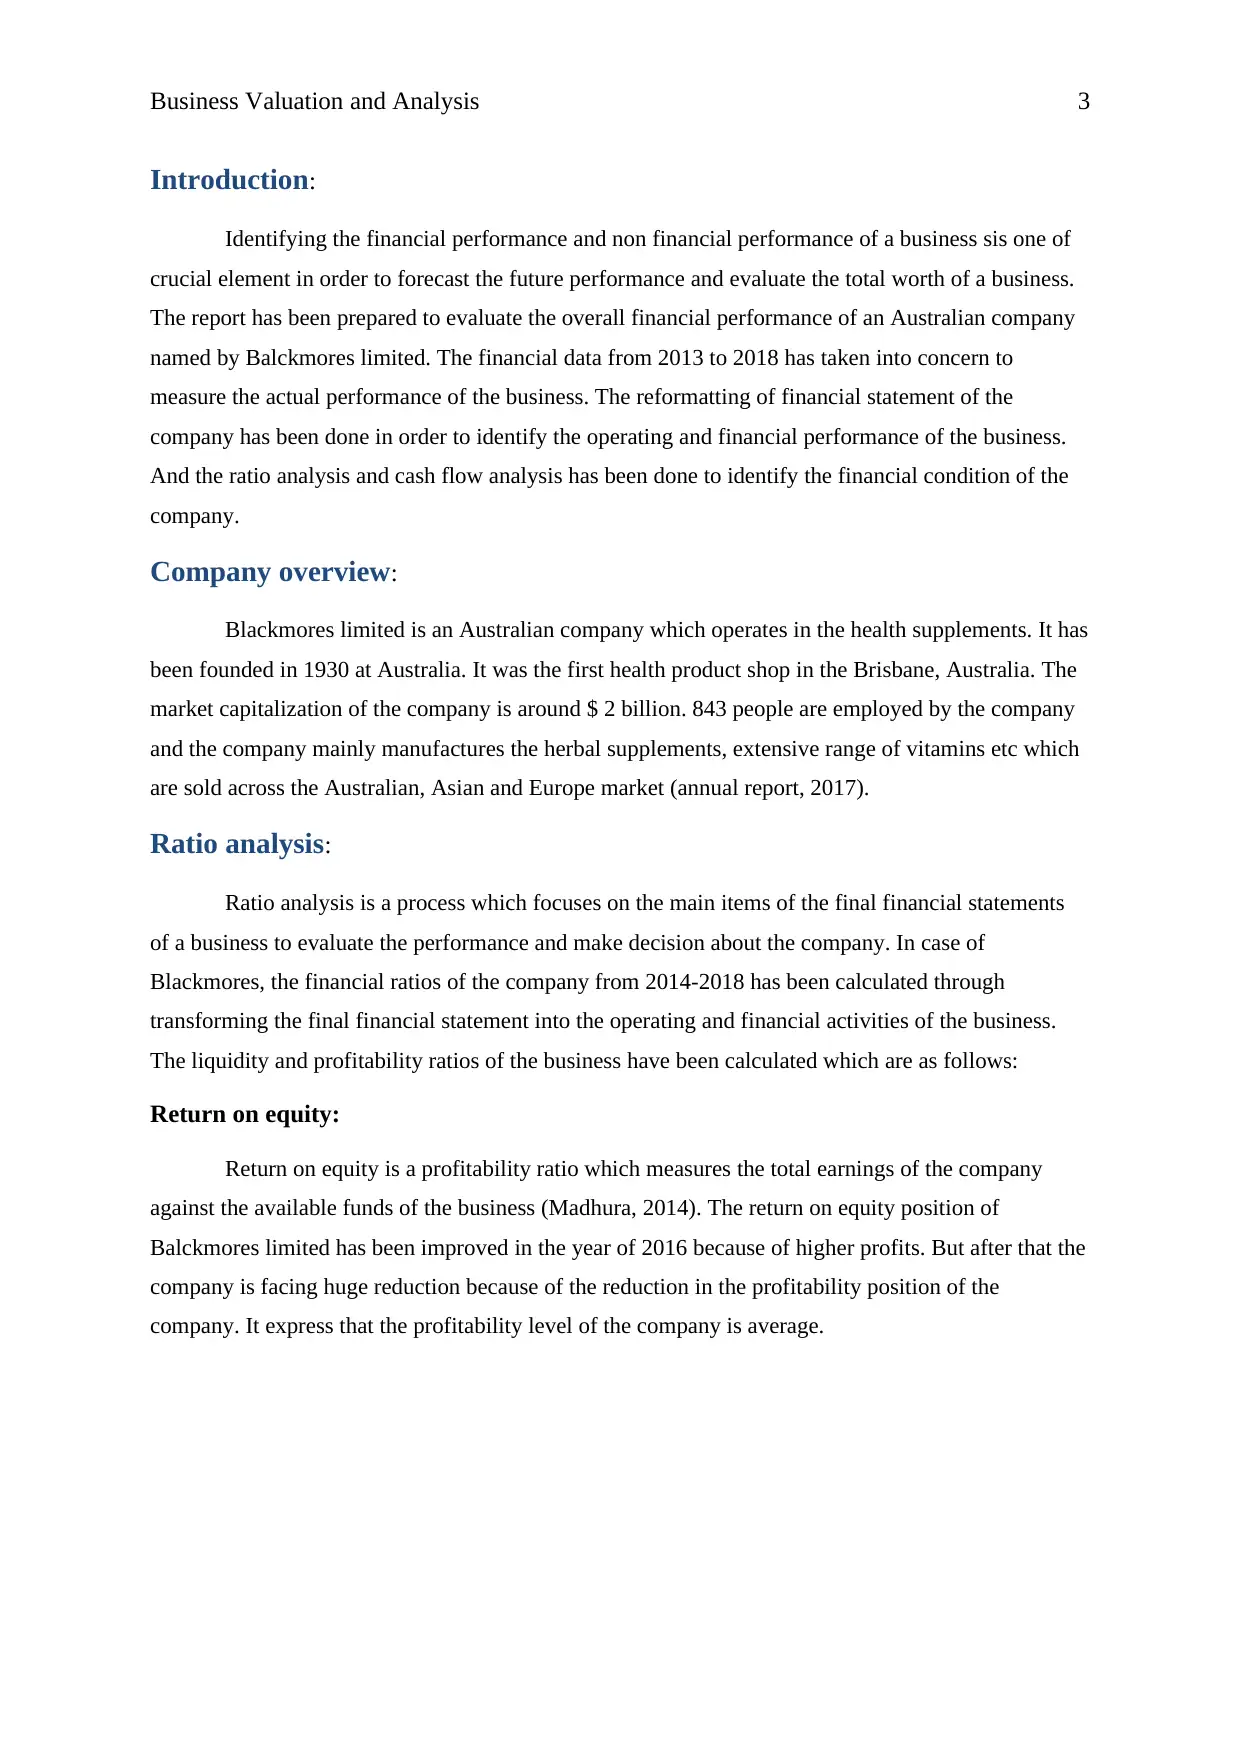
Return on equity:
Return on equity is a profitability ratio which measures the total earnings of the company
against the available funds of the business (Madhura, 2014). The return on equity position of
Balckmores limited has been improved in the year of 2016 because of higher profits. But after that the
company is facing huge reduction because of the reduction in the profitability position of the
company. It express that the profitability level of the company is average.
Introduction:
Identifying the financial performance and non financial performance of a business sis one of
crucial element in order to forecast the future performance and evaluate the total worth of a business.
The report has been prepared to evaluate the overall financial performance of an Australian company
named by Balckmores limited. The financial data from 2013 to 2018 has taken into concern to
measure the actual performance of the business. The reformatting of financial statement of the
company has been done in order to identify the operating and financial performance of the business.
And the ratio analysis and cash flow analysis has been done to identify the financial condition of the
company.
Company overview:
Blackmores limited is an Australian company which operates in the health supplements. It has
been founded in 1930 at Australia. It was the first health product shop in the Brisbane, Australia. The
market capitalization of the company is around $ 2 billion. 843 people are employed by the company
and the company mainly manufactures the herbal supplements, extensive range of vitamins etc which
are sold across the Australian, Asian and Europe market (annual report, 2017).
Ratio analysis:
Ratio analysis is a process which focuses on the main items of the final financial statements
of a business to evaluate the performance and make decision about the company. In case of
Blackmores, the financial ratios of the company from 2014-2018 has been calculated through
transforming the final financial statement into the operating and financial activities of the business.
The liquidity and profitability ratios of the business have been calculated which are as follows:
Return on equity:
Return on equity is a profitability ratio which measures the total earnings of the company
against the available funds of the business (Madhura, 2014). The return on equity position of
Balckmores limited has been improved in the year of 2016 because of higher profits. But after that the
company is facing huge reduction because of the reduction in the profitability position of the
company. It express that the profitability level of the company is average.
⊘ This is a preview!⊘
Do you want full access?
Subscribe today to unlock all pages.
Trusted by 1+ million students worldwide
Business Valuation and Analysis 4
Figure 1: Return on equity
(Annual report, 2017)
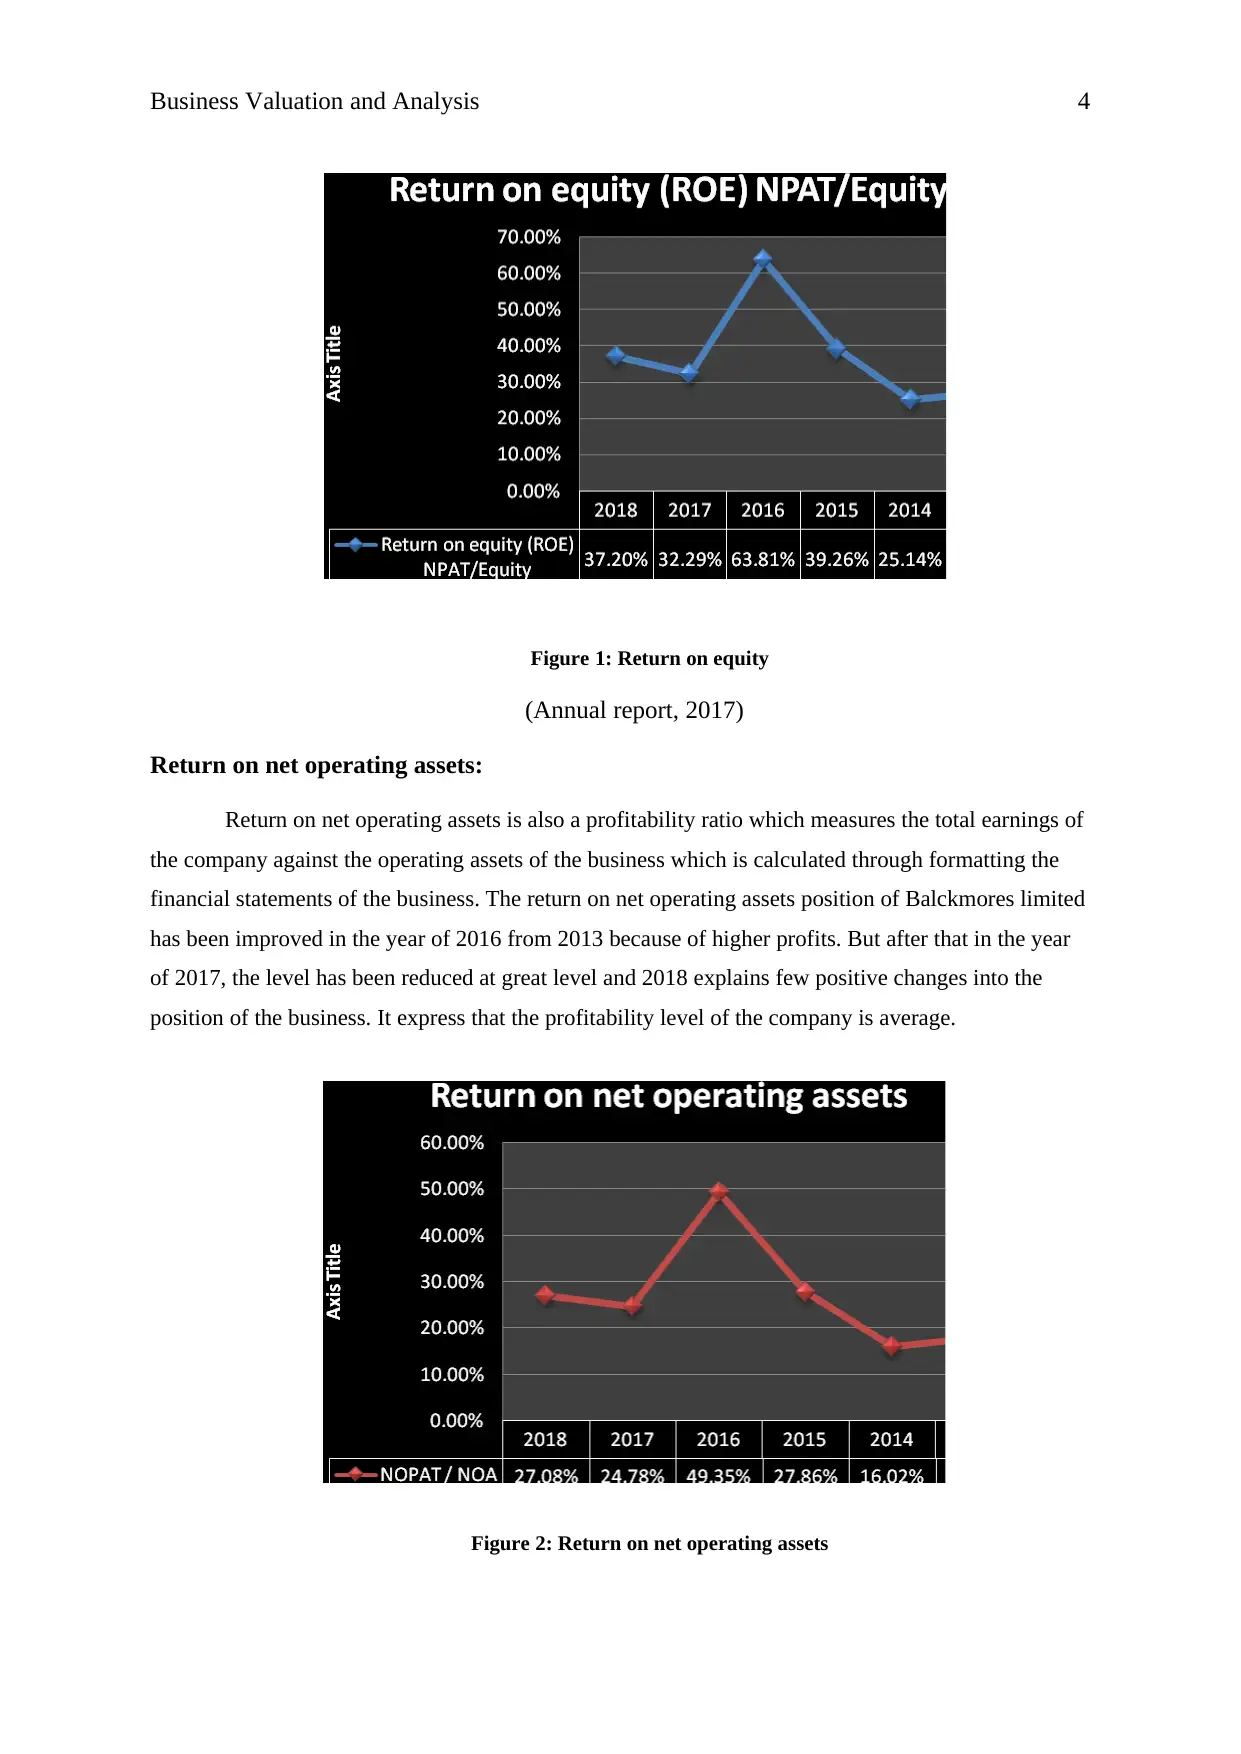
Return on net operating assets:
Return on net operating assets is also a profitability ratio which measures the total earnings of
the company against the operating assets of the business which is calculated through formatting the
financial statements of the business. The return on net operating assets position of Balckmores limited
has been improved in the year of 2016 from 2013 because of higher profits. But after that in the year
of 2017, the level has been reduced at great level and 2018 explains few positive changes into the
position of the business. It express that the profitability level of the company is average.
Figure 2: Return on net operating assets
Figure 1: Return on equity
(Annual report, 2017)
Return on net operating assets:
Return on net operating assets is also a profitability ratio which measures the total earnings of
the company against the operating assets of the business which is calculated through formatting the
financial statements of the business. The return on net operating assets position of Balckmores limited
has been improved in the year of 2016 from 2013 because of higher profits. But after that in the year
of 2017, the level has been reduced at great level and 2018 explains few positive changes into the
position of the business. It express that the profitability level of the company is average.
Figure 2: Return on net operating assets
Paraphrase This Document
Need a fresh take? Get an instant paraphrase of this document with our AI Paraphraser
Business Valuation and Analysis 5
(Annual report, 2017)
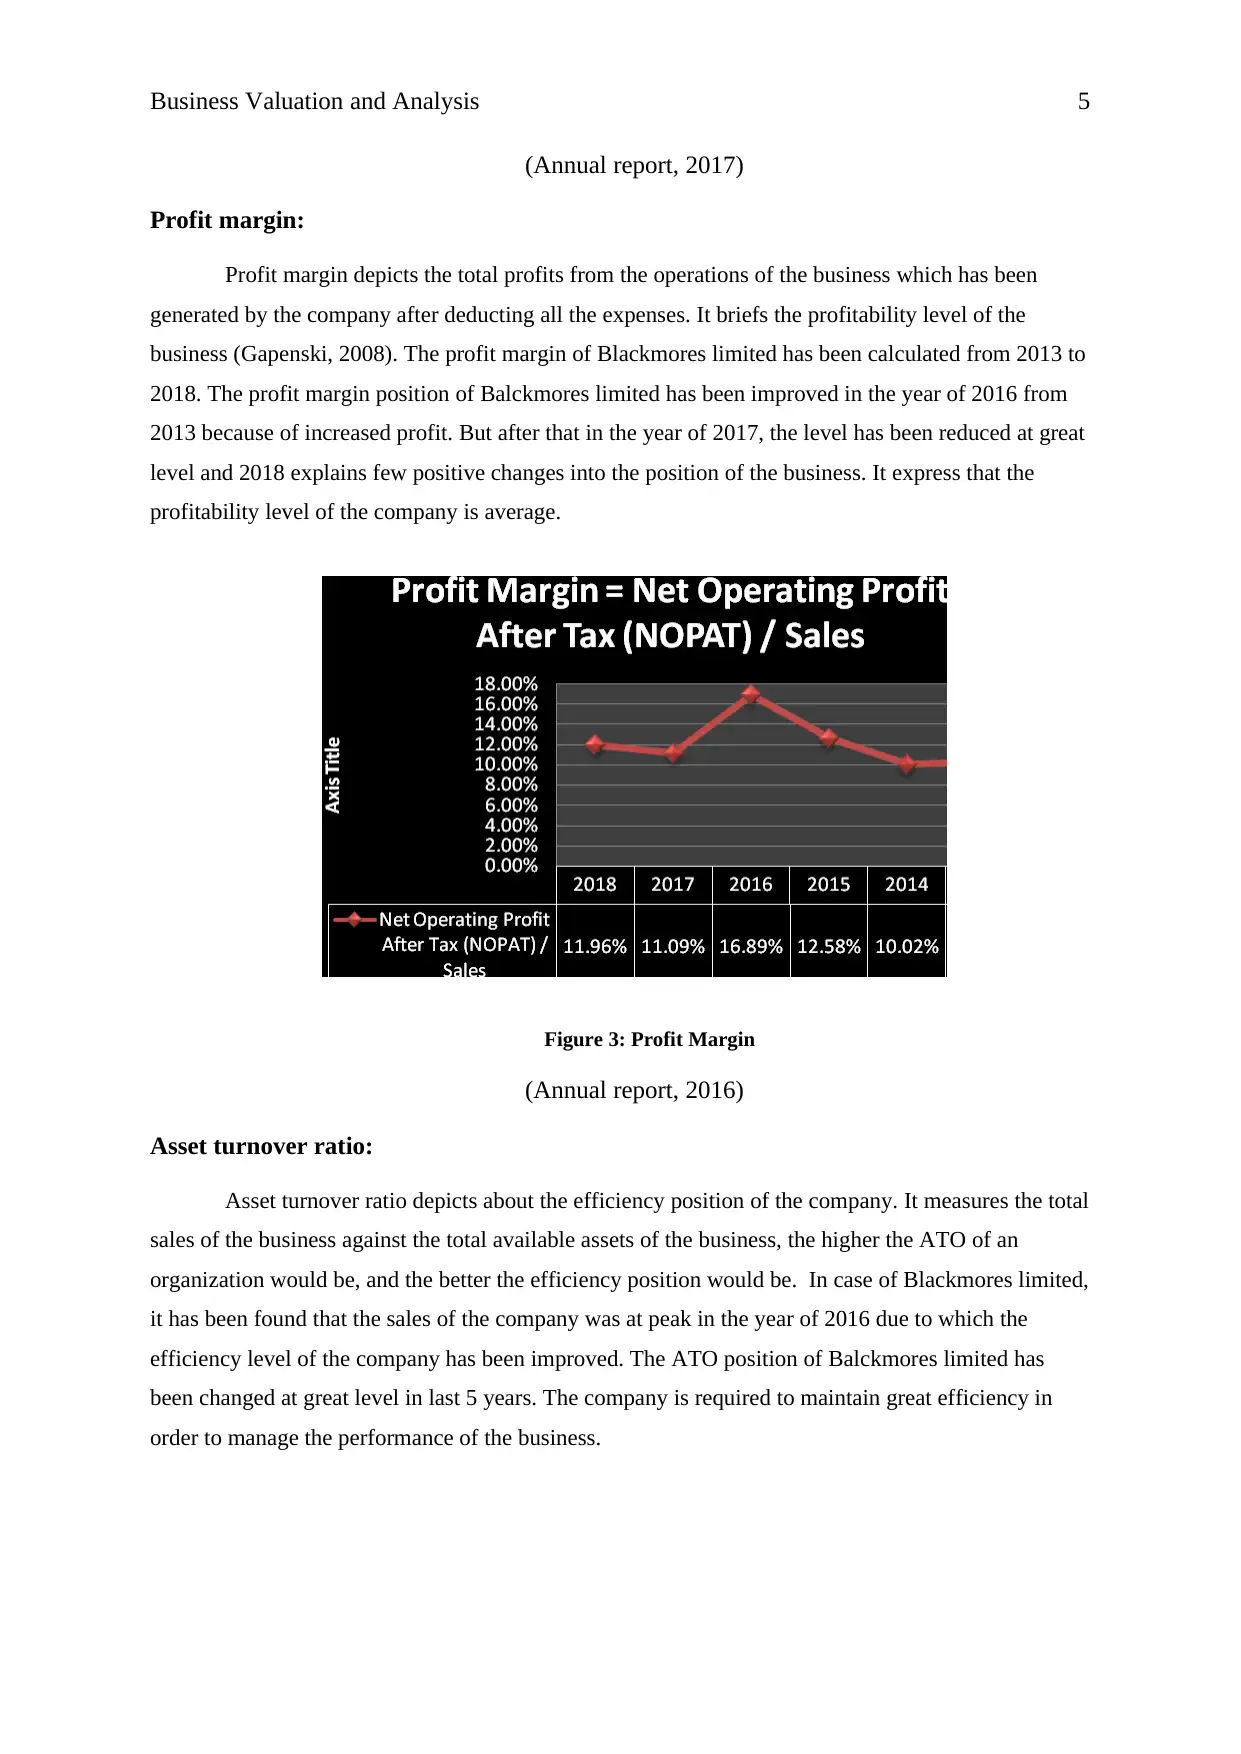
Profit margin:
Profit margin depicts the total profits from the operations of the business which has been
generated by the company after deducting all the expenses. It briefs the profitability level of the
business (Gapenski, 2008). The profit margin of Blackmores limited has been calculated from 2013 to
2018. The profit margin position of Balckmores limited has been improved in the year of 2016 from
2013 because of increased profit. But after that in the year of 2017, the level has been reduced at great
level and 2018 explains few positive changes into the position of the business. It express that the
profitability level of the company is average.
Figure 3: Profit Margin
(Annual report, 2016)
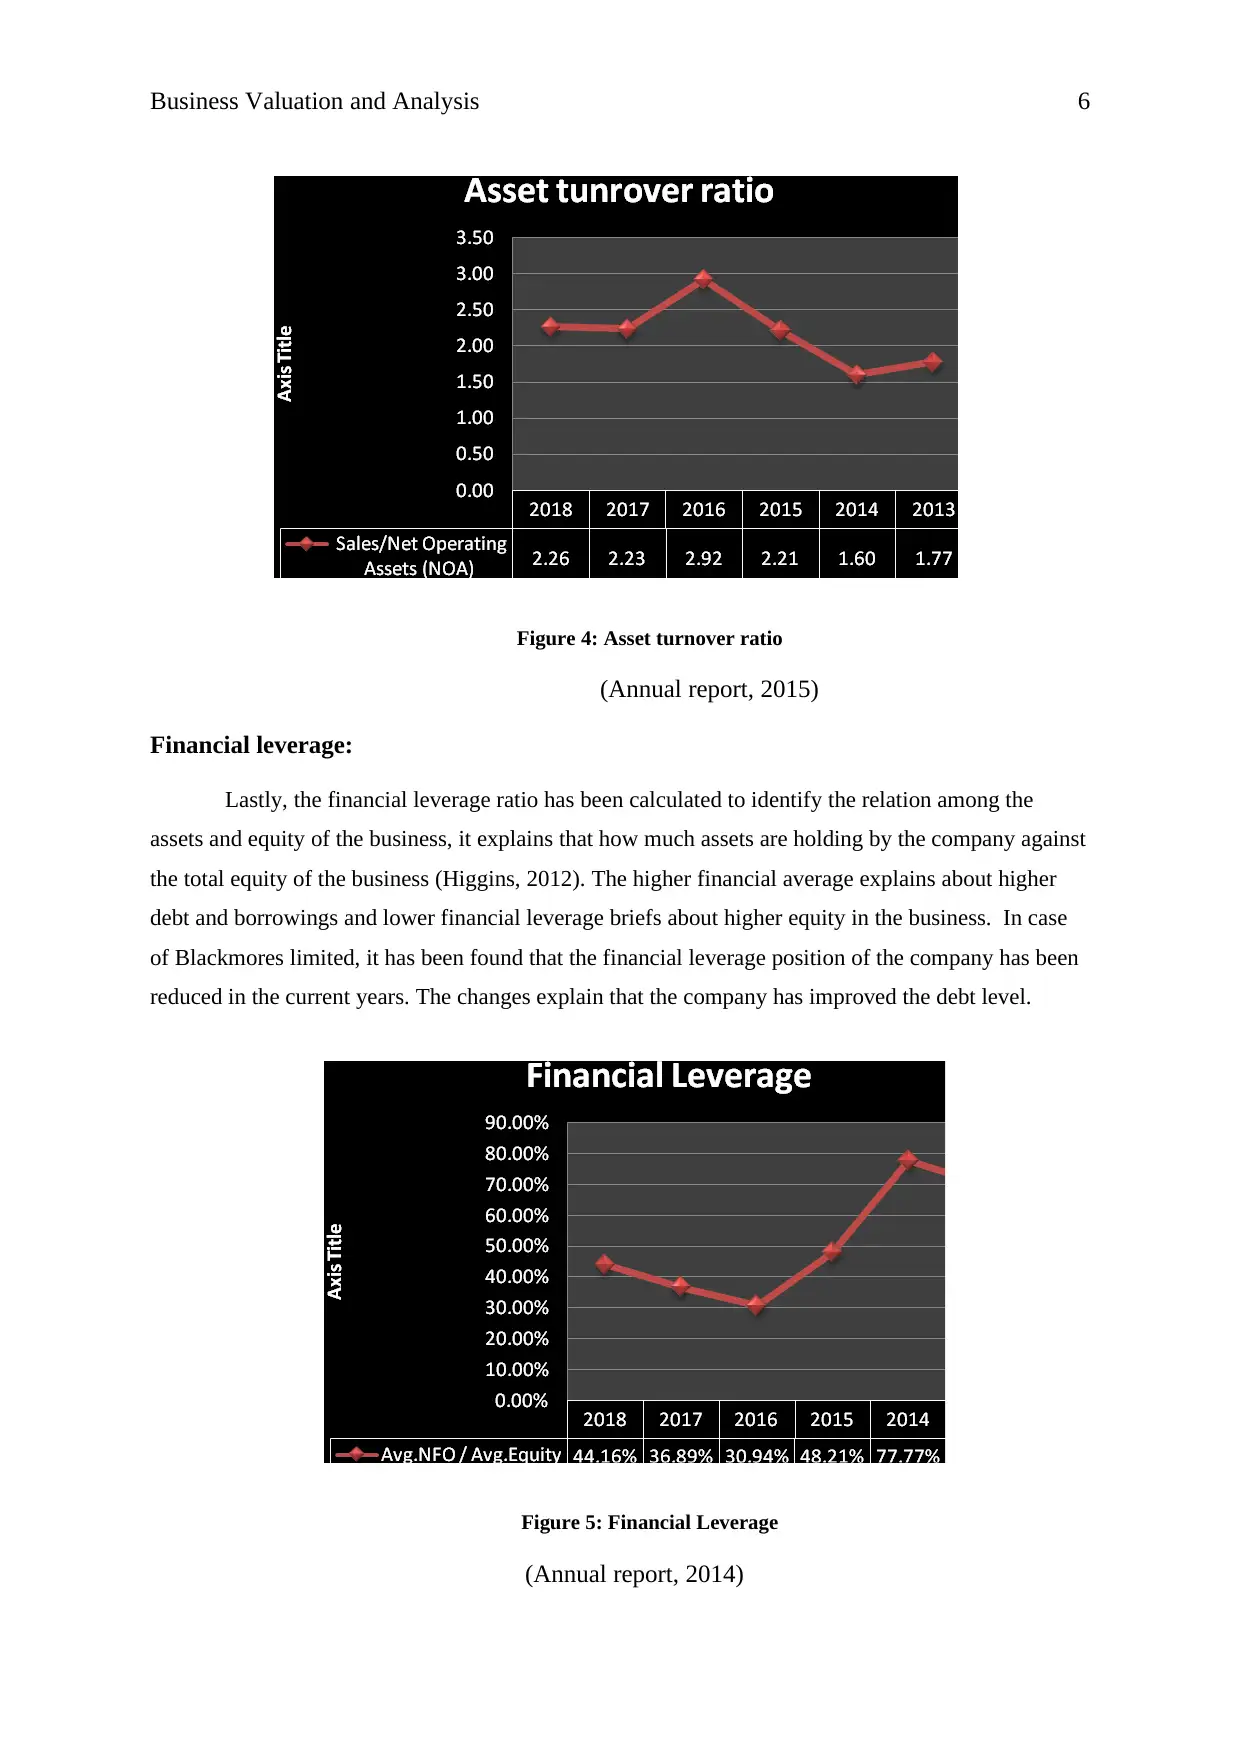
Asset turnover ratio:
Asset turnover ratio depicts about the efficiency position of the company. It measures the total
sales of the business against the total available assets of the business, the higher the ATO of an
organization would be, and the better the efficiency position would be. In case of Blackmores limited,
it has been found that the sales of the company was at peak in the year of 2016 due to which the
efficiency level of the company has been improved. The ATO position of Balckmores limited has
been changed at great level in last 5 years. The company is required to maintain great efficiency in
order to manage the performance of the business.
(Annual report, 2017)
Profit margin:
Profit margin depicts the total profits from the operations of the business which has been
generated by the company after deducting all the expenses. It briefs the profitability level of the
business (Gapenski, 2008). The profit margin of Blackmores limited has been calculated from 2013 to
2018. The profit margin position of Balckmores limited has been improved in the year of 2016 from
2013 because of increased profit. But after that in the year of 2017, the level has been reduced at great
level and 2018 explains few positive changes into the position of the business. It express that the
profitability level of the company is average.
Figure 3: Profit Margin
(Annual report, 2016)
Asset turnover ratio:
Asset turnover ratio depicts about the efficiency position of the company. It measures the total
sales of the business against the total available assets of the business, the higher the ATO of an
organization would be, and the better the efficiency position would be. In case of Blackmores limited,
it has been found that the sales of the company was at peak in the year of 2016 due to which the
efficiency level of the company has been improved. The ATO position of Balckmores limited has
been changed at great level in last 5 years. The company is required to maintain great efficiency in
order to manage the performance of the business.
Business Valuation and Analysis 6
Figure 4: Asset turnover ratio
(Annual report, 2015)
Financial leverage:
Lastly, the financial leverage ratio has been calculated to identify the relation among the
assets and equity of the business, it explains that how much assets are holding by the company against
the total equity of the business (Higgins, 2012). The higher financial average explains about higher
debt and borrowings and lower financial leverage briefs about higher equity in the business. In case
of Blackmores limited, it has been found that the financial leverage position of the company has been
reduced in the current years. The changes explain that the company has improved the debt level.
Figure 5: Financial Leverage
(Annual report, 2014)
⊘ This is a preview!⊘
Do you want full access?
Subscribe today to unlock all pages.
Trusted by 1+ million students worldwide
Business Valuation and Analysis 7
On the basis of the overall ratio analysis evaluation and key term evaluation on the
Blackmores limited of last 5 years from 2014 to 2018, it has been found that the performance of the
company was extremely better in the year of 2016. However, the current position of the business is
also average.
Impact of major expenses on profit margin:
From the financial statement of the business, it has been found that the total operating
expenses of the company has been improved from $ 2,47,676 to $ 5,00,242 along with an average
growth of 109% (Annual report, 2017). The changes have taken place due to various operation,
activities and items of the business. Few of the expenses due to which, the operating expenses have
been this much higher and affected the profit margin of the business are as follows:
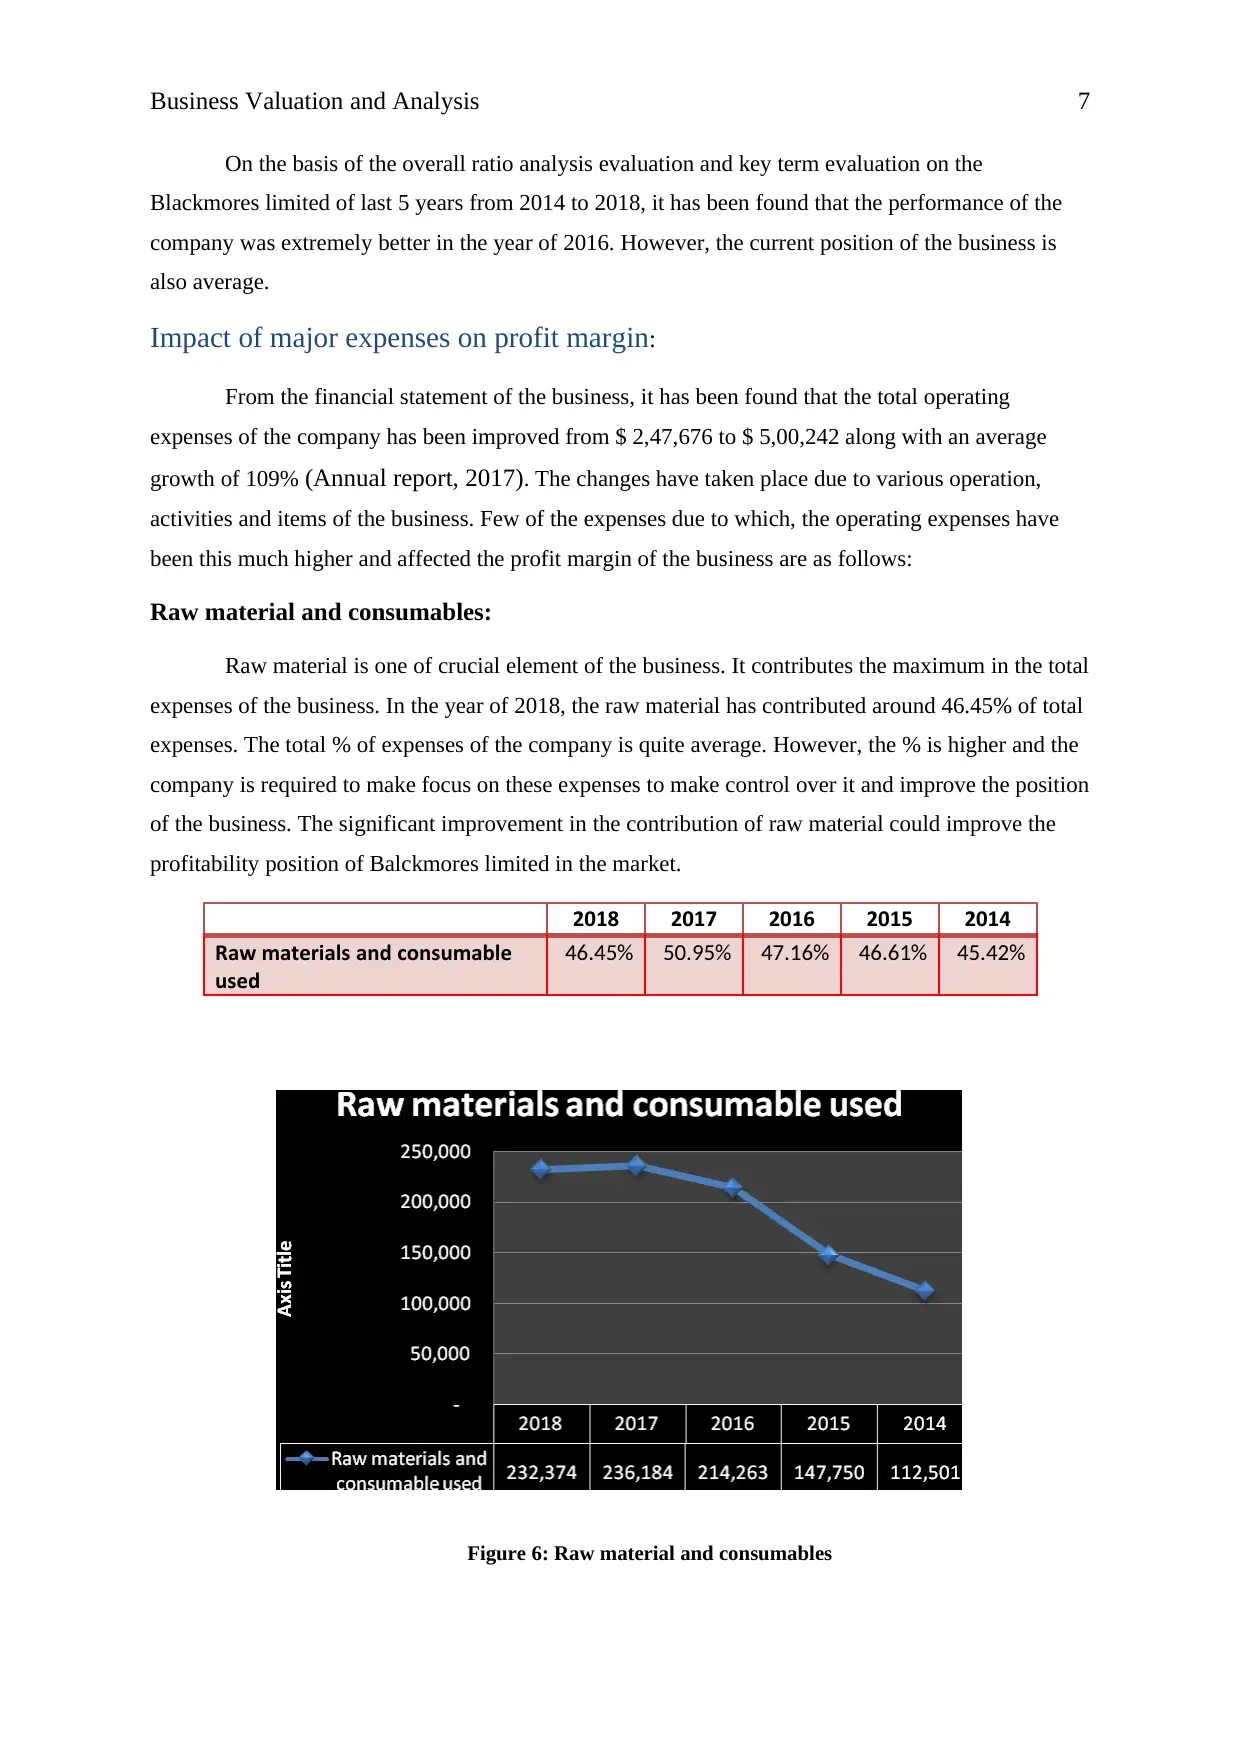
Raw material and consumables:
Raw material is one of crucial element of the business. It contributes the maximum in the total
expenses of the business. In the year of 2018, the raw material has contributed around 46.45% of total
expenses. The total % of expenses of the company is quite average. However, the % is higher and the
company is required to make focus on these expenses to make control over it and improve the position
of the business. The significant improvement in the contribution of raw material could improve the
profitability position of Balckmores limited in the market.
2018 2017 2016 2015 2014
Raw materials and consumable
used
46.45% 50.95% 47.16% 46.61% 45.42%
Figure 6: Raw material and consumables
On the basis of the overall ratio analysis evaluation and key term evaluation on the
Blackmores limited of last 5 years from 2014 to 2018, it has been found that the performance of the
company was extremely better in the year of 2016. However, the current position of the business is
also average.
Impact of major expenses on profit margin:
From the financial statement of the business, it has been found that the total operating
expenses of the company has been improved from $ 2,47,676 to $ 5,00,242 along with an average
growth of 109% (Annual report, 2017). The changes have taken place due to various operation,
activities and items of the business. Few of the expenses due to which, the operating expenses have
been this much higher and affected the profit margin of the business are as follows:
Raw material and consumables:
Raw material is one of crucial element of the business. It contributes the maximum in the total
expenses of the business. In the year of 2018, the raw material has contributed around 46.45% of total
expenses. The total % of expenses of the company is quite average. However, the % is higher and the
company is required to make focus on these expenses to make control over it and improve the position
of the business. The significant improvement in the contribution of raw material could improve the
profitability position of Balckmores limited in the market.
2018 2017 2016 2015 2014
Raw materials and consumable
used
46.45% 50.95% 47.16% 46.61% 45.42%
Figure 6: Raw material and consumables
Paraphrase This Document
Need a fresh take? Get an instant paraphrase of this document with our AI Paraphraser
Business Valuation and Analysis 8
(Annual report, 2017)
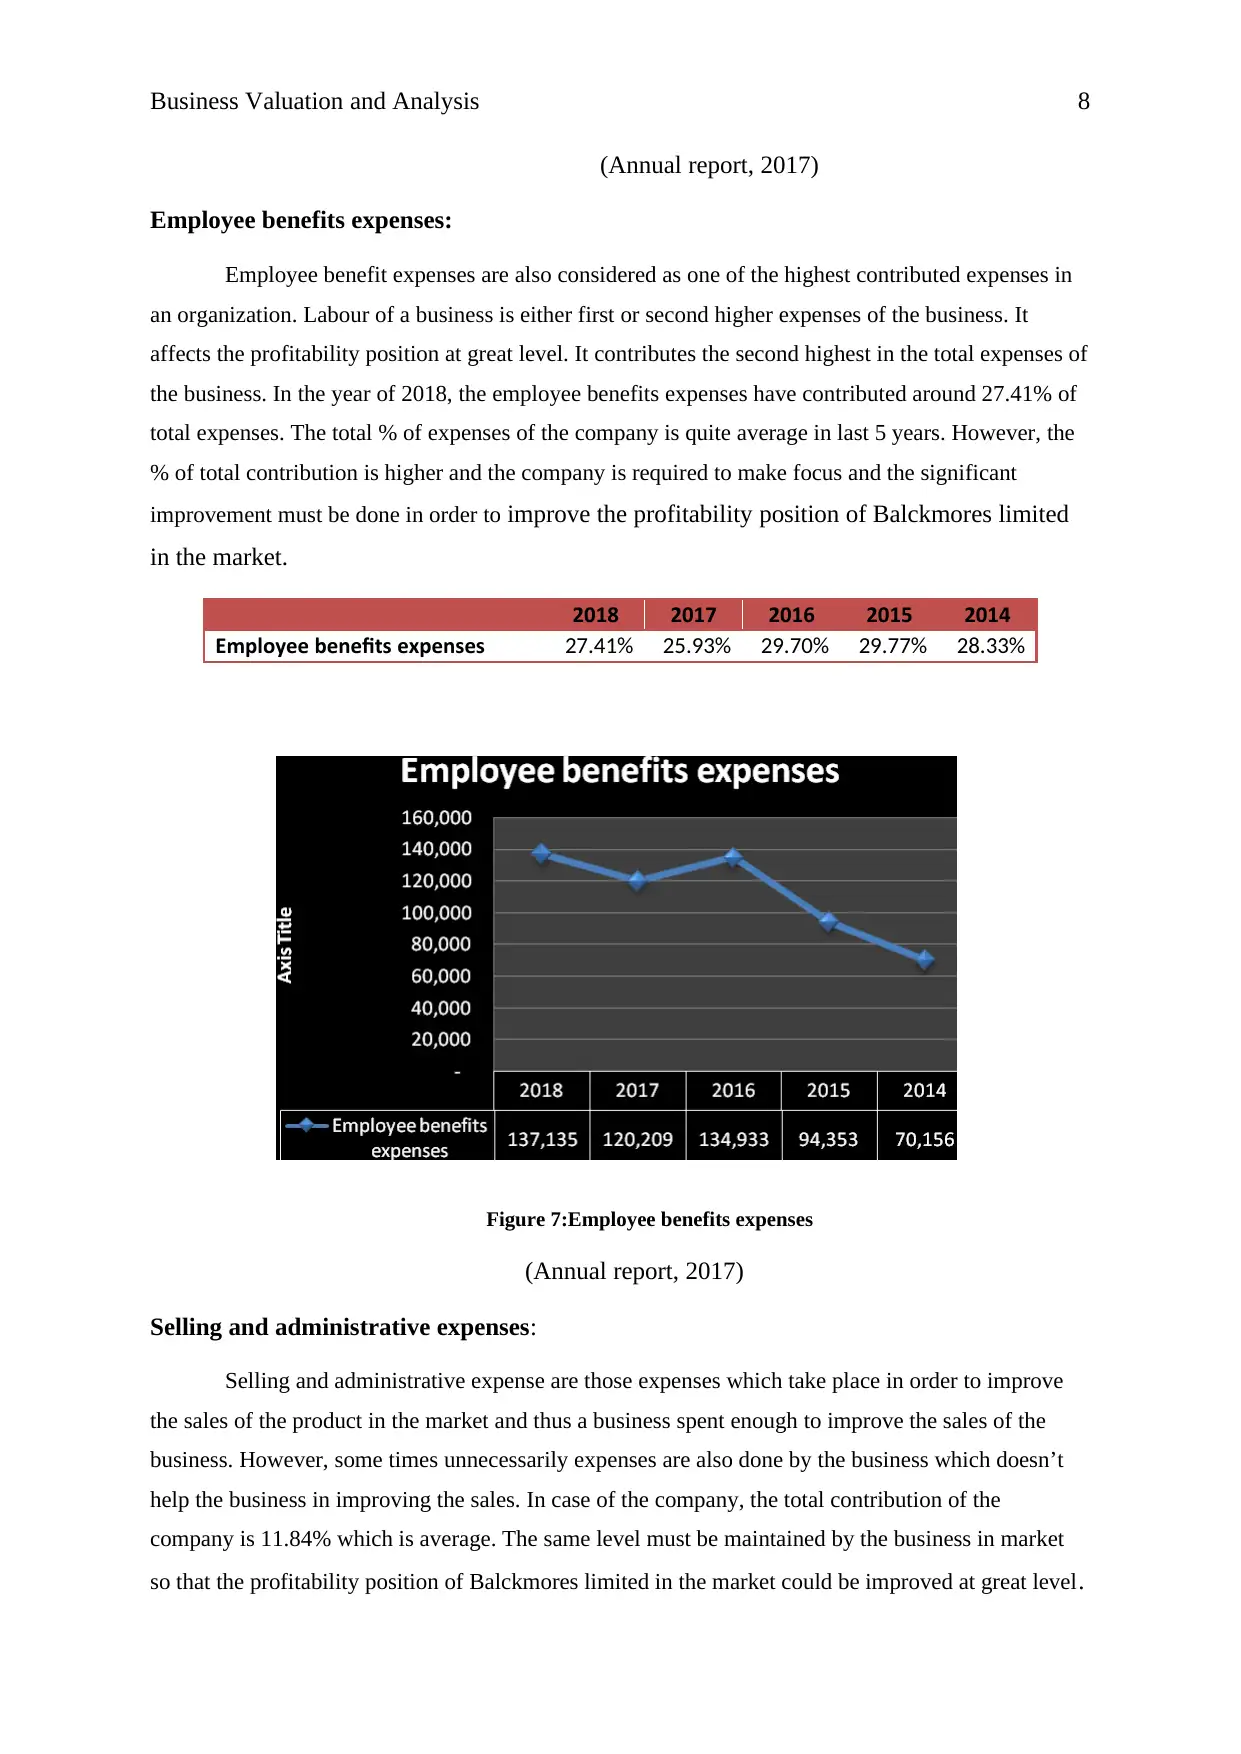
Employee benefits expenses:
Employee benefit expenses are also considered as one of the highest contributed expenses in
an organization. Labour of a business is either first or second higher expenses of the business. It
affects the profitability position at great level. It contributes the second highest in the total expenses of
the business. In the year of 2018, the employee benefits expenses have contributed around 27.41% of
total expenses. The total % of expenses of the company is quite average in last 5 years. However, the
% of total contribution is higher and the company is required to make focus and the significant
improvement must be done in order to improve the profitability position of Balckmores limited
in the market.
2018 2017 2016 2015 2014
Employee benefits expenses 27.41% 25.93% 29.70% 29.77% 28.33%
Figure 7:Employee benefits expenses
(Annual report, 2017)
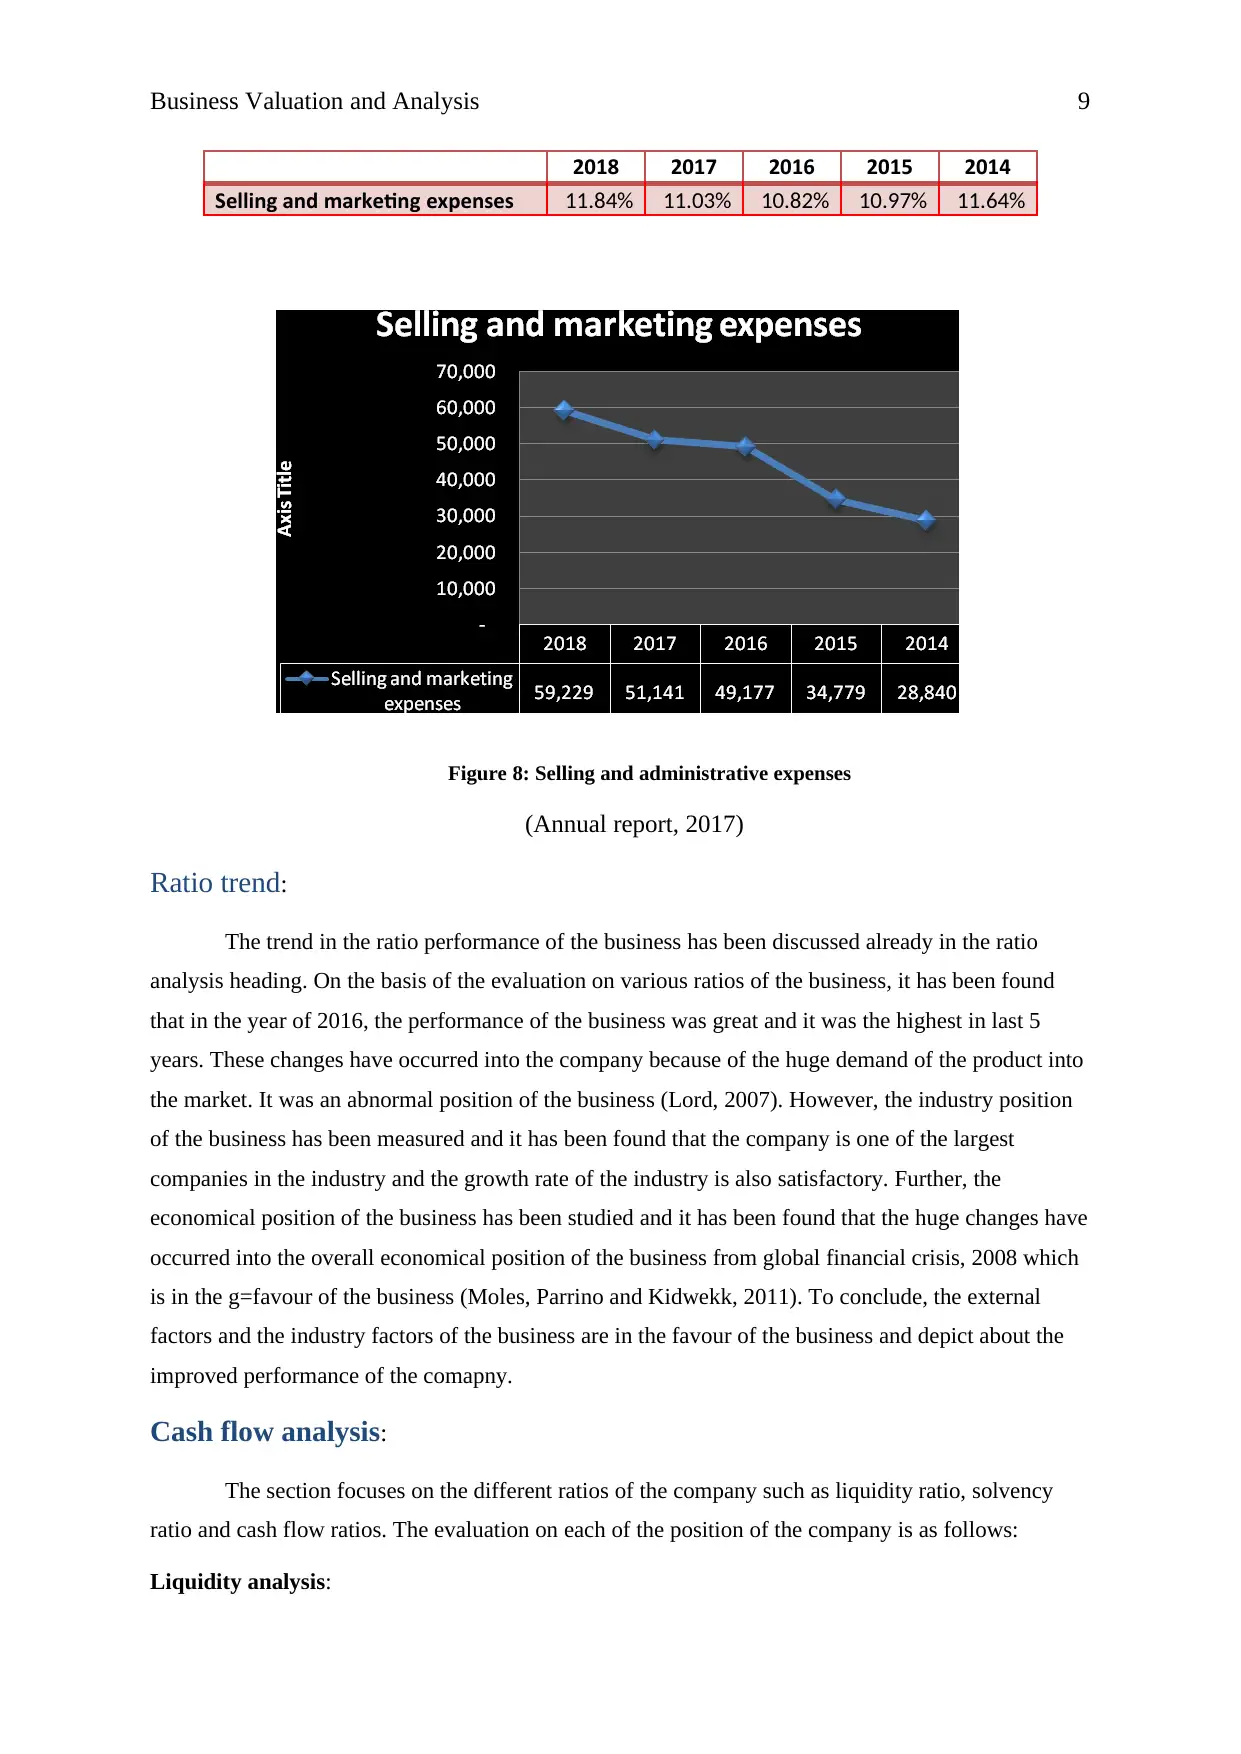
Selling and administrative expenses:
Selling and administrative expense are those expenses which take place in order to improve
the sales of the product in the market and thus a business spent enough to improve the sales of the
business. However, some times unnecessarily expenses are also done by the business which doesn’t
help the business in improving the sales. In case of the company, the total contribution of the
company is 11.84% which is average. The same level must be maintained by the business in market
so that the profitability position of Balckmores limited in the market could be improved at great level.
(Annual report, 2017)
Employee benefits expenses:
Employee benefit expenses are also considered as one of the highest contributed expenses in
an organization. Labour of a business is either first or second higher expenses of the business. It
affects the profitability position at great level. It contributes the second highest in the total expenses of
the business. In the year of 2018, the employee benefits expenses have contributed around 27.41% of
total expenses. The total % of expenses of the company is quite average in last 5 years. However, the
% of total contribution is higher and the company is required to make focus and the significant
improvement must be done in order to improve the profitability position of Balckmores limited
in the market.
2018 2017 2016 2015 2014
Employee benefits expenses 27.41% 25.93% 29.70% 29.77% 28.33%
Figure 7:Employee benefits expenses
(Annual report, 2017)
Selling and administrative expenses:
Selling and administrative expense are those expenses which take place in order to improve
the sales of the product in the market and thus a business spent enough to improve the sales of the
business. However, some times unnecessarily expenses are also done by the business which doesn’t
help the business in improving the sales. In case of the company, the total contribution of the
company is 11.84% which is average. The same level must be maintained by the business in market
so that the profitability position of Balckmores limited in the market could be improved at great level.
Business Valuation and Analysis 9
2018 2017 2016 2015 2014
Selling and marketing expenses 11.84% 11.03% 10.82% 10.97% 11.64%
Figure 8: Selling and administrative expenses
(Annual report, 2017)
Ratio trend:
The trend in the ratio performance of the business has been discussed already in the ratio
analysis heading. On the basis of the evaluation on various ratios of the business, it has been found
that in the year of 2016, the performance of the business was great and it was the highest in last 5
years. These changes have occurred into the company because of the huge demand of the product into
the market. It was an abnormal position of the business (Lord, 2007). However, the industry position
of the business has been measured and it has been found that the company is one of the largest
companies in the industry and the growth rate of the industry is also satisfactory. Further, the
economical position of the business has been studied and it has been found that the huge changes have
occurred into the overall economical position of the business from global financial crisis, 2008 which
is in the g=favour of the business (Moles, Parrino and Kidwekk, 2011). To conclude, the external
factors and the industry factors of the business are in the favour of the business and depict about the
improved performance of the comapny.
Cash flow analysis:
The section focuses on the different ratios of the company such as liquidity ratio, solvency
ratio and cash flow ratios. The evaluation on each of the position of the company is as follows:
Liquidity analysis:
⊘ This is a preview!⊘
Do you want full access?
Subscribe today to unlock all pages.
Trusted by 1+ million students worldwide
Business Valuation and Analysis 10
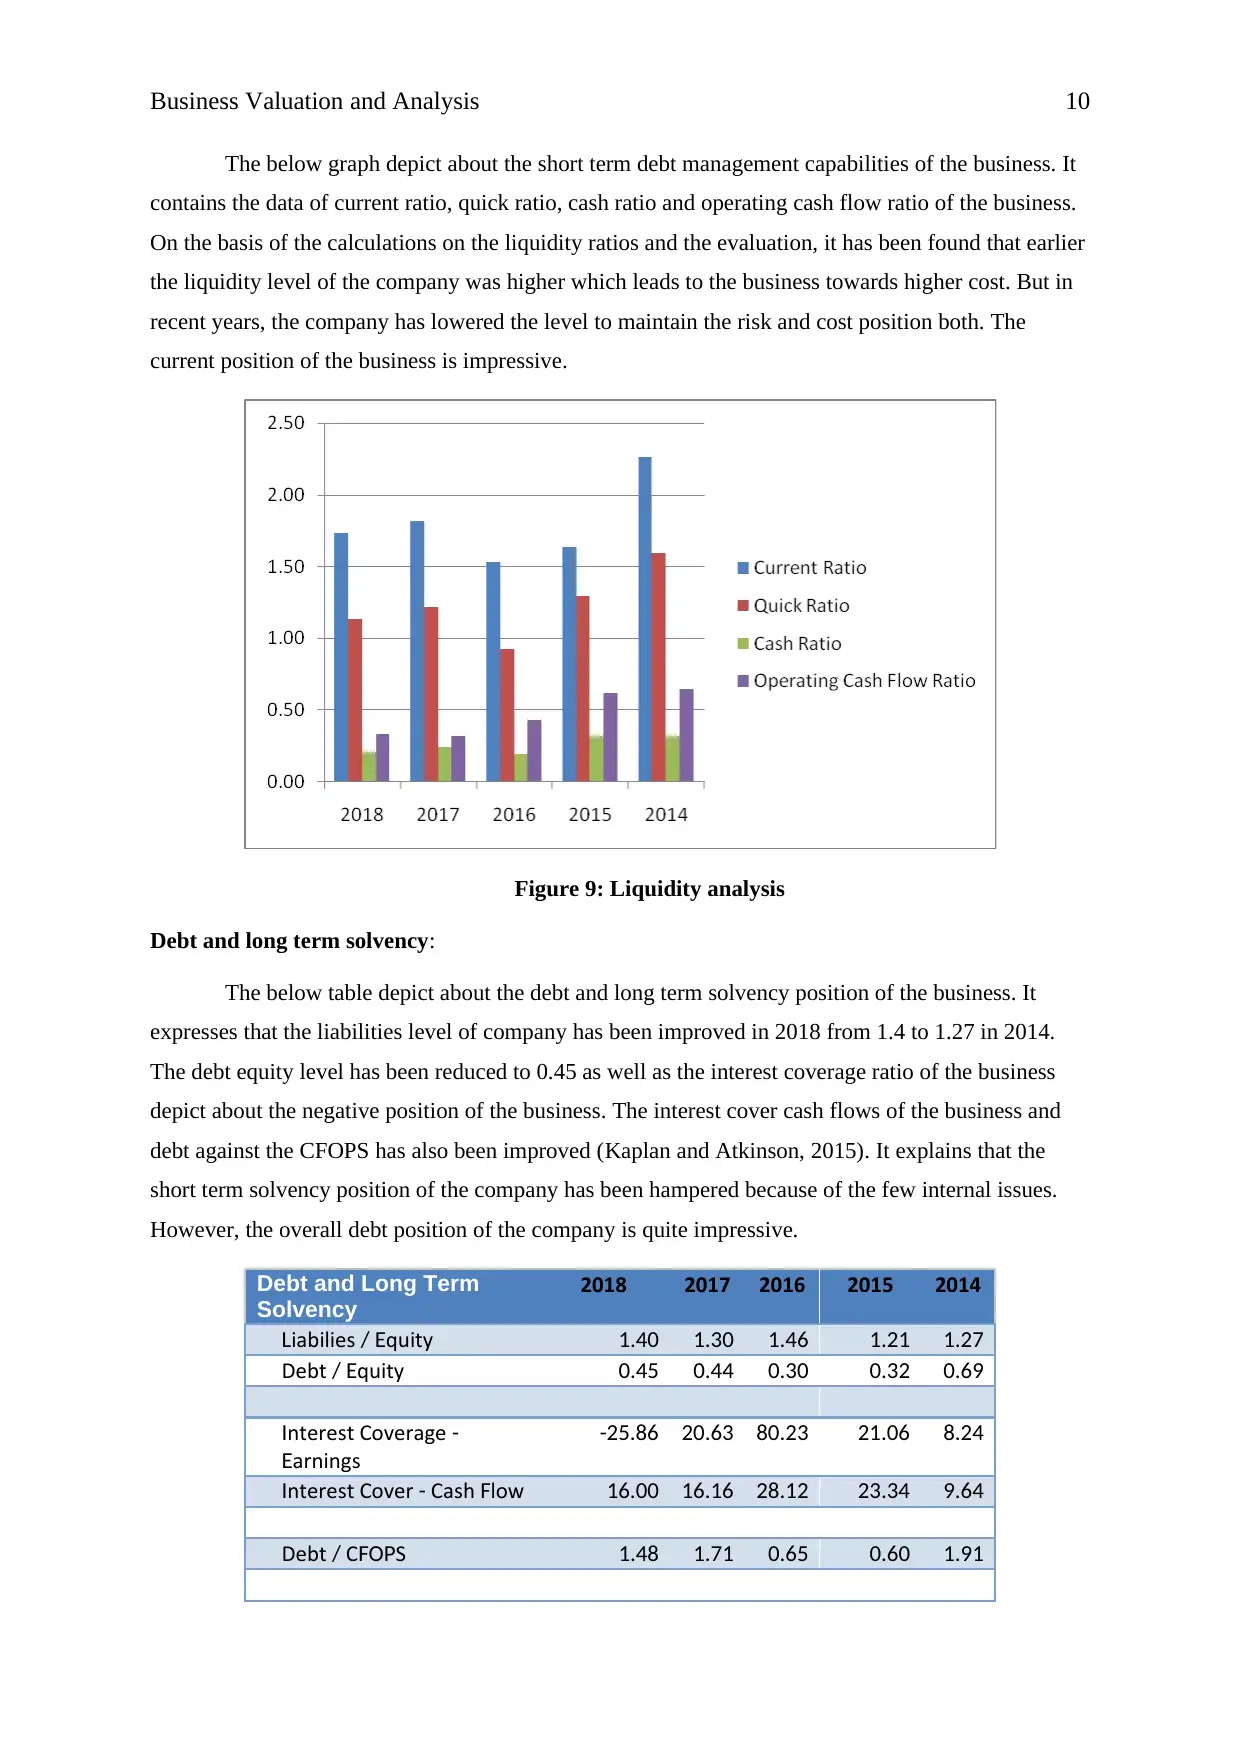
The below graph depict about the short term debt management capabilities of the business. It
contains the data of current ratio, quick ratio, cash ratio and operating cash flow ratio of the business.
On the basis of the calculations on the liquidity ratios and the evaluation, it has been found that earlier
the liquidity level of the company was higher which leads to the business towards higher cost. But in
recent years, the company has lowered the level to maintain the risk and cost position both. The
current position of the business is impressive.
Figure 9: Liquidity analysis
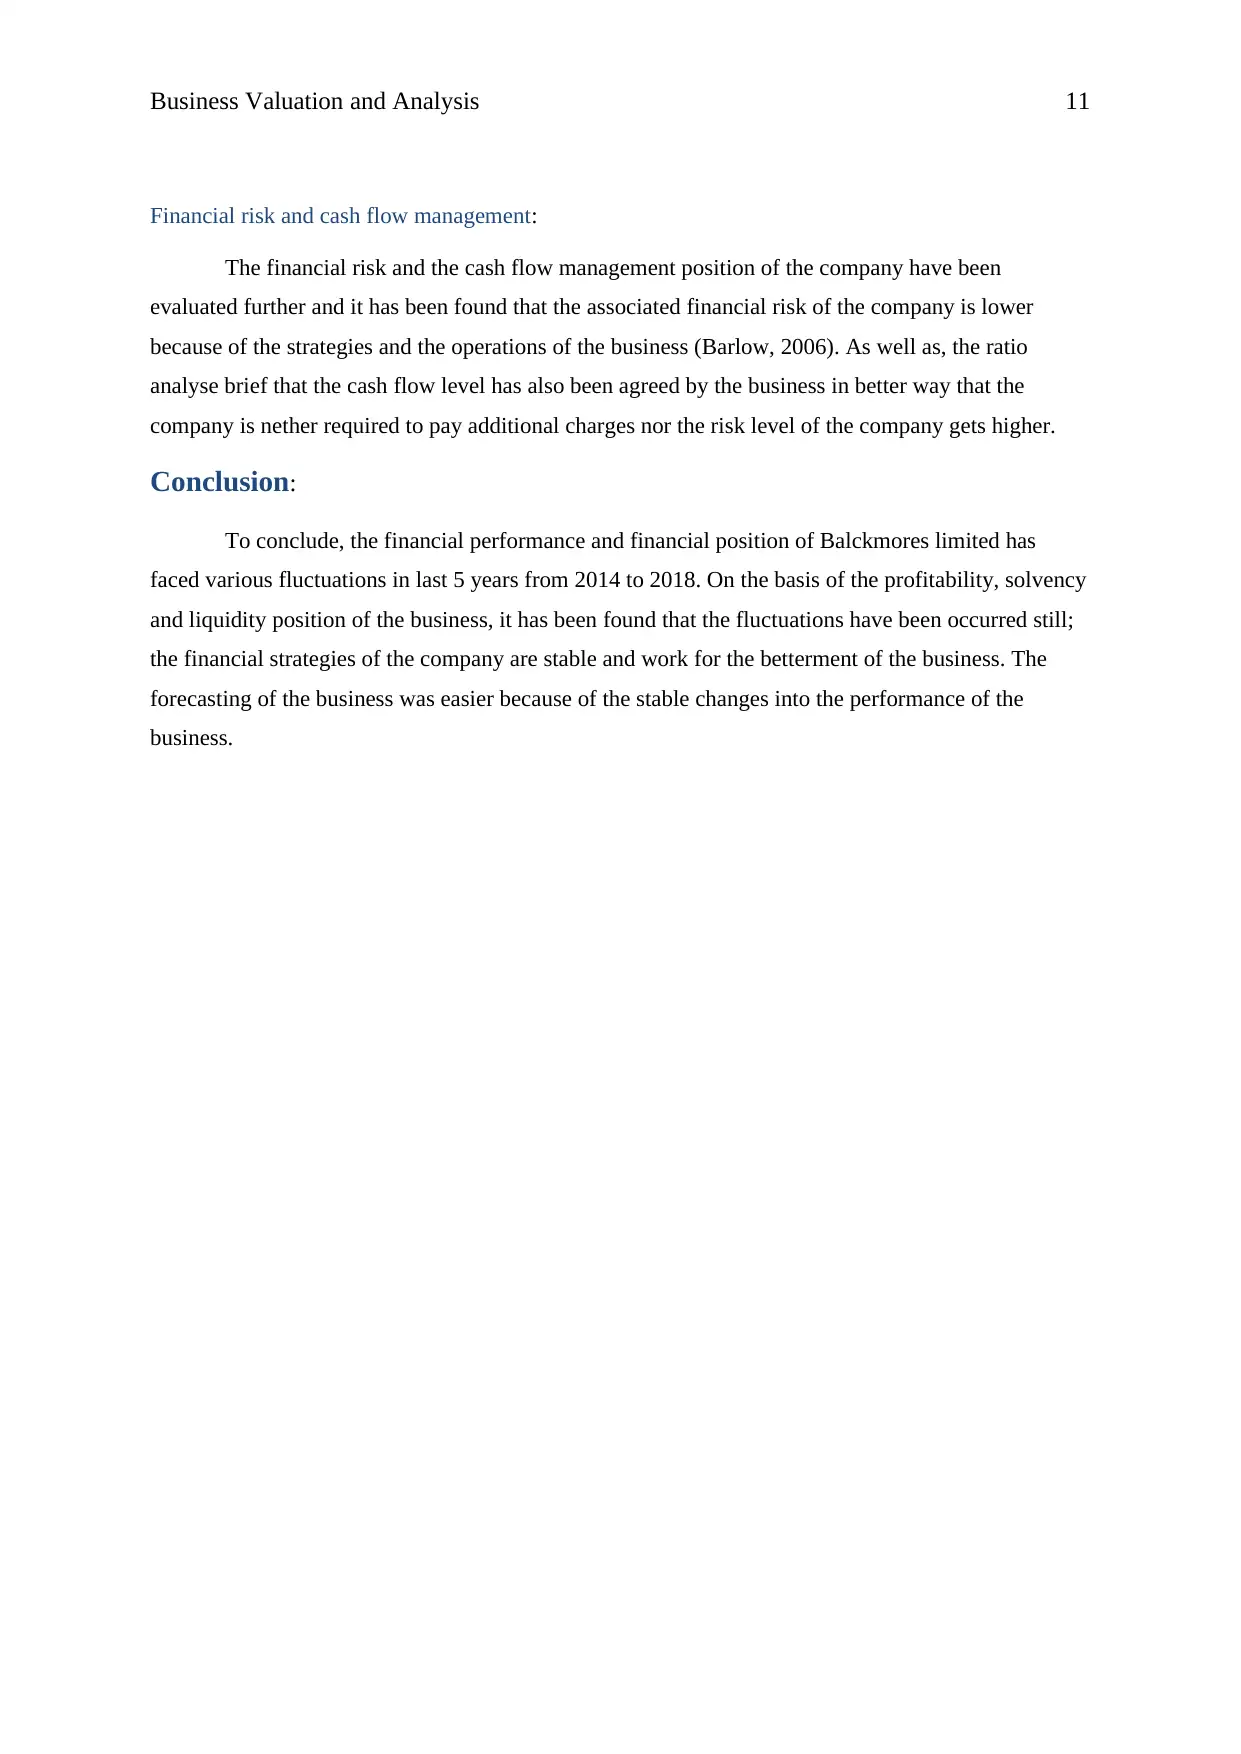
Debt and long term solvency:
The below table depict about the debt and long term solvency position of the business. It
expresses that the liabilities level of company has been improved in 2018 from 1.4 to 1.27 in 2014.
The debt equity level has been reduced to 0.45 as well as the interest coverage ratio of the business
depict about the negative position of the business. The interest cover cash flows of the business and
debt against the CFOPS has also been improved (Kaplan and Atkinson, 2015). It explains that the
short term solvency position of the company has been hampered because of the few internal issues.
However, the overall debt position of the company is quite impressive.
Debt and Long Term
Solvency
2018 2017 2016 2015 2014
iabilities quityL / E 1.40 1.30 1.46 1.21 1.27
Debt quity/ E 0.45 0.44 0.30 0.32 0.69
nterest CoverageI -
arningsE
-25.86 20.63 80.23 21.06 8.24
nterest Cover Cash lowI - F 16.00 16.16 28.12 23.34 9.64
Debt C S/ FOP 1.48 1.71 0.65 0.60 1.91
The below graph depict about the short term debt management capabilities of the business. It
contains the data of current ratio, quick ratio, cash ratio and operating cash flow ratio of the business.
On the basis of the calculations on the liquidity ratios and the evaluation, it has been found that earlier
the liquidity level of the company was higher which leads to the business towards higher cost. But in
recent years, the company has lowered the level to maintain the risk and cost position both. The
current position of the business is impressive.
Figure 9: Liquidity analysis
Debt and long term solvency:
The below table depict about the debt and long term solvency position of the business. It
expresses that the liabilities level of company has been improved in 2018 from 1.4 to 1.27 in 2014.
The debt equity level has been reduced to 0.45 as well as the interest coverage ratio of the business
depict about the negative position of the business. The interest cover cash flows of the business and
debt against the CFOPS has also been improved (Kaplan and Atkinson, 2015). It explains that the
short term solvency position of the company has been hampered because of the few internal issues.
However, the overall debt position of the company is quite impressive.
Debt and Long Term
Solvency
2018 2017 2016 2015 2014
iabilities quityL / E 1.40 1.30 1.46 1.21 1.27
Debt quity/ E 0.45 0.44 0.30 0.32 0.69
nterest CoverageI -
arningsE
-25.86 20.63 80.23 21.06 8.24
nterest Cover Cash lowI - F 16.00 16.16 28.12 23.34 9.64
Debt C S/ FOP 1.48 1.71 0.65 0.60 1.91
Paraphrase This Document
Need a fresh take? Get an instant paraphrase of this document with our AI Paraphraser
Business Valuation and Analysis 11
Financial risk and cash flow management:
The financial risk and the cash flow management position of the company have been
evaluated further and it has been found that the associated financial risk of the company is lower
because of the strategies and the operations of the business (Barlow, 2006). As well as, the ratio
analyse brief that the cash flow level has also been agreed by the business in better way that the
company is nether required to pay additional charges nor the risk level of the company gets higher.
Conclusion:
To conclude, the financial performance and financial position of Balckmores limited has
faced various fluctuations in last 5 years from 2014 to 2018. On the basis of the profitability, solvency
and liquidity position of the business, it has been found that the fluctuations have been occurred still;
the financial strategies of the company are stable and work for the betterment of the business. The
forecasting of the business was easier because of the stable changes into the performance of the
business.
Business Valuation and Analysis 12
References:
Barlow.J.F. 2006. Excel models for business and operations management, 2nd edition, John Wiley &
sons ltd, England.
Blackmores. 2014. Annual Report 2014. Available at:
https://www.blackmores.com.au/-/media/files/investor-centre/annual-and-half-yearly-reports/blackmores-
annual-report-2014.pdf?la=en&hash=25748D5558646DF1EC9D7DB7083E4C193BB11E62 >
(accessed 15/9/18)
Blackmores. 2015. Annual Report 2015. Available at: https://www.blackmores.com.au/- (accessed
15/9/18).
Blackmores. 2016. Annual Report 2016. Available at:
http://blackmores2016.annual-report.com.au/ (accessed 15/9/18).
lackmoresB . 2017. nnual eport vaila le atA R 2017. A b :
https://interactivepdf.uniflip.com/2/41140/1086995/pub/html5.html?utm_source=website-
article&utm_medium=link&utm_campaign=outbound&utm_content=annual-report-
2017#page/1 (accessed 15/9/18).
Gapenski, L.C., 2008. Healthcare finance: an introduction to accounting and financial management.
Health Administration Press.
Higgins, R. C., 2012. Analysis for financial management. McGraw-Hill/Irwin.
Kaplan, R.S. and Atkinson, A.A., 2015. Advanced management accounting. PHI Learning.
Lord, B.R., 2007. Strategic management accounting. Issues in Management Accounting, 3 (2) p.p. 32.
Madura, J. 2014. Financial Markets and Institutions. Cengage Learning.
Moles, P. Parrino, R and Kidwekk, D,.2011. Corporate finance, European edition, John Wiley &sons,
United Kingdom
⊘ This is a preview!⊘
Do you want full access?
Subscribe today to unlock all pages.
Trusted by 1+ million students worldwide
1 out of 20
Related Documents


Your All-in-One AI-Powered Toolkit for Academic Success.
+13062052269
info@desklib.com
Available 24*7 on WhatsApp / Email
![[object Object]](/_next/static/media/star-bottom.7253800d.svg)
Unlock your academic potential
Copyright © 2020–2026 A2Z Services. All Rights Reserved. Developed and managed by ZUCOL.