Business Valuation: Prospective Analysis of Blackmores Limited
VerifiedAdded on 2023/06/04
|25
|7176
|146
Report
AI Summary
This report provides a comprehensive business valuation and financial analysis of Blackmores Limited, an Australian health products company. It includes forecasting of sales growth, asset turnover ratio, and profit margin for the next five years (2019-2023) using historical data and market trends. The report applies various valuation models, including the Dividend Discount Model, Residual Income Model, Residual Operating Income Model, and Free Cash Flow Model, to estimate the firm's share value. A sensitivity analysis is performed on key forecasting assumptions using the Residual Operating Income Model to assess potential opportunities and challenges for Blackmores. The analysis concludes with management consulting decisions, offering specific remedies for identified concerns.
Running Head: Business valuation and analysis
1
Project Report: Business valuation and analysis
1
Project Report: Business valuation and analysis
Paraphrase This Document
Need a fresh take? Get an instant paraphrase of this document with our AI Paraphraser
Business valuation and analysis 2
Contents
Introduction:.....................................................................................................................4
Forecasting:.......................................................................................................................4
Sales growth:................................................................................................................4
Asset turnover ratio forecast (ATO forecast):..............................................................7
PM:...............................................................................................................................8
Free cash flow and Net dividend payout ratio forecasting:........................................10
Cost of debt:................................................................................................................11
Cost of equity:.............................................................................................................12
Valuation:.......................................................................................................................13
Dividend discount model:...........................................................................................14
Residual income model:.............................................................................................15
Residual operating income model:.............................................................................15
Free cash flow model:.................................................................................................16
Sensitivity analysis:........................................................................................................16
Sales growth:..............................................................................................................16
ATO:...........................................................................................................................17
PM:.............................................................................................................................17
Net dividend payout ratio:..........................................................................................18
Cost of debt:................................................................................................................18
Cost of equity and WACC:.........................................................................................18
Management consulting decisions:.................................................................................19
Opportunities..............................................................................................................19
Business valuation and analysis 3
Challenges...................................................................................................................19
Conclusion:.....................................................................................................................20
References:.....................................................................................................................21
Appendix.........................................................................................................................22
⊘ This is a preview!⊘
Do you want full access?
Subscribe today to unlock all pages.
Trusted by 1+ million students worldwide
Business valuation and analysis 4
Introduction:
The report has been prepared on Blackmore limited. The future forecasting, valuation,
sensitivity analysis, management consulting decision etc models have been applied on the
company to measure the future performance and current capital market performance of the
business. Blackmore limited is an Australian company which offers health products such as
herbal supplements and vitamins. The company has started its operations in the year of 1930
and from that time, it has expanded its business into overseas market. The prospective
analysis has been done on the company along with the other financial models to measure the
future performance of the company. the main objectives of the report is to evaluate the
overall market performance and the future forecasting of the company in order to make a
better investment decision in the company.
Forecasting:
Forecasting analysis is a financial analysis model which is used by the financial analyst
or financial manager of an organization in concern to evaluate the future performance &
position of an organization. In the case of Blackmore limited, a forecasting process has been
done on the company for the next 5 years from 2019 to 2023. The historical data of the
company has been taken into the context to calculate the future changes in the business. The
other factors have also been taken into the context to measure the company’s overall financial
performance in next 5 years.
Sales growth:
In order to forecast the sales growth, sales price and the quality of the products of the
company, the forecasting application has been applied on the business. In order to evaluate
the past sales growth of the business, it has been found that the sales growth of the company
has been influenced with the industry, GDP; inflation rate etc. on the basis of calculations,
sales growth rate of the business was higher in 2016. The revenue of the Blackmore limited
was $ 717,211 thousand. The reasons behind this expansion are china market which has boost
up the overall sales of the company.
Though, in the year of 2017 and 2018, a decrement has been seen in the sales growth of
the business because of the sales pattern of the business. However, the sales price and product
Paraphrase This Document
Need a fresh take? Get an instant paraphrase of this document with our AI Paraphraser
Business valuation and analysis 5
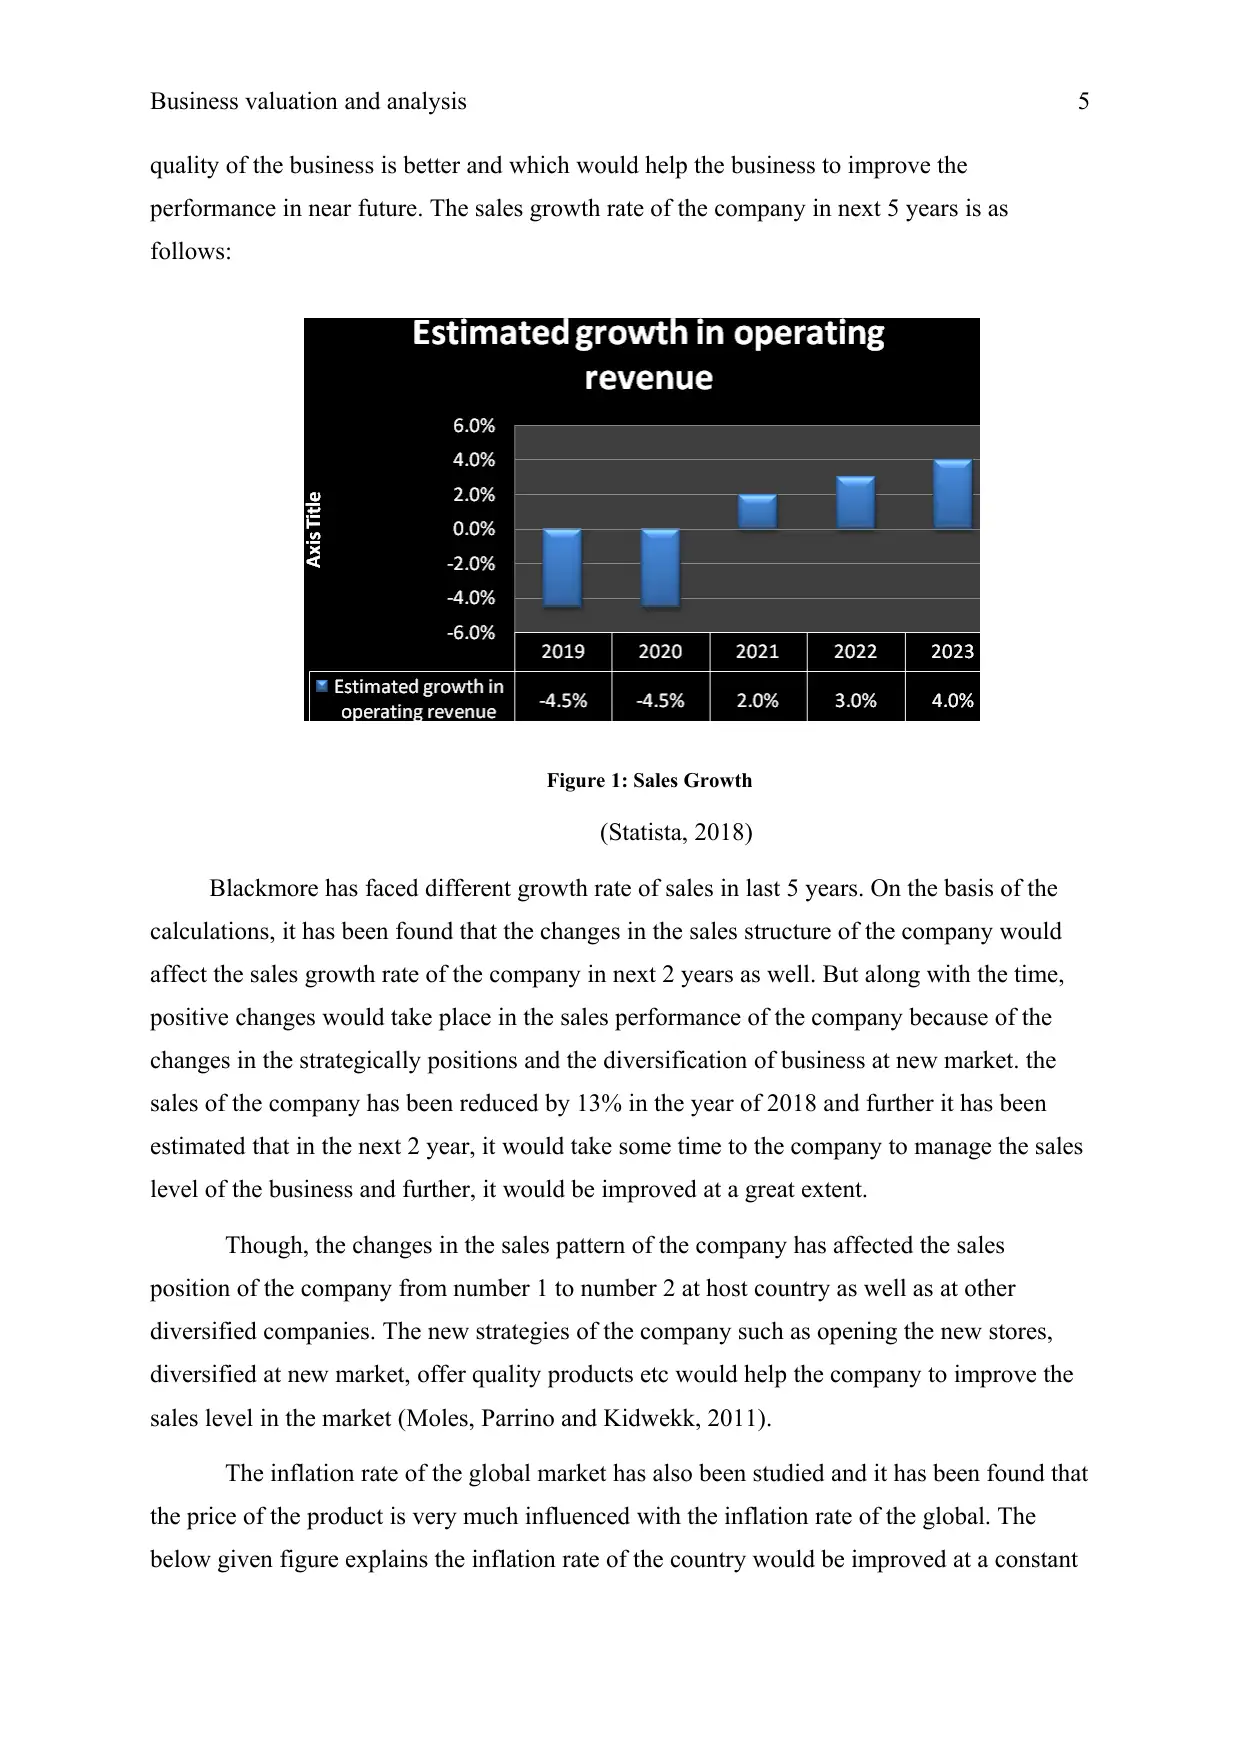
quality of the business is better and which would help the business to improve the
performance in near future. The sales growth rate of the company in next 5 years is as
follows:
Figure 1: Sales Growth
(Statista, 2018)
Blackmore has faced different growth rate of sales in last 5 years. On the basis of the
calculations, it has been found that the changes in the sales structure of the company would
affect the sales growth rate of the company in next 2 years as well. But along with the time,
positive changes would take place in the sales performance of the company because of the
changes in the strategically positions and the diversification of business at new market. the
sales of the company has been reduced by 13% in the year of 2018 and further it has been
estimated that in the next 2 year, it would take some time to the company to manage the sales
level of the business and further, it would be improved at a great extent.
Though, the changes in the sales pattern of the company has affected the sales
position of the company from number 1 to number 2 at host country as well as at other
diversified companies. The new strategies of the company such as opening the new stores,
diversified at new market, offer quality products etc would help the company to improve the
sales level in the market (Moles, Parrino and Kidwekk, 2011).
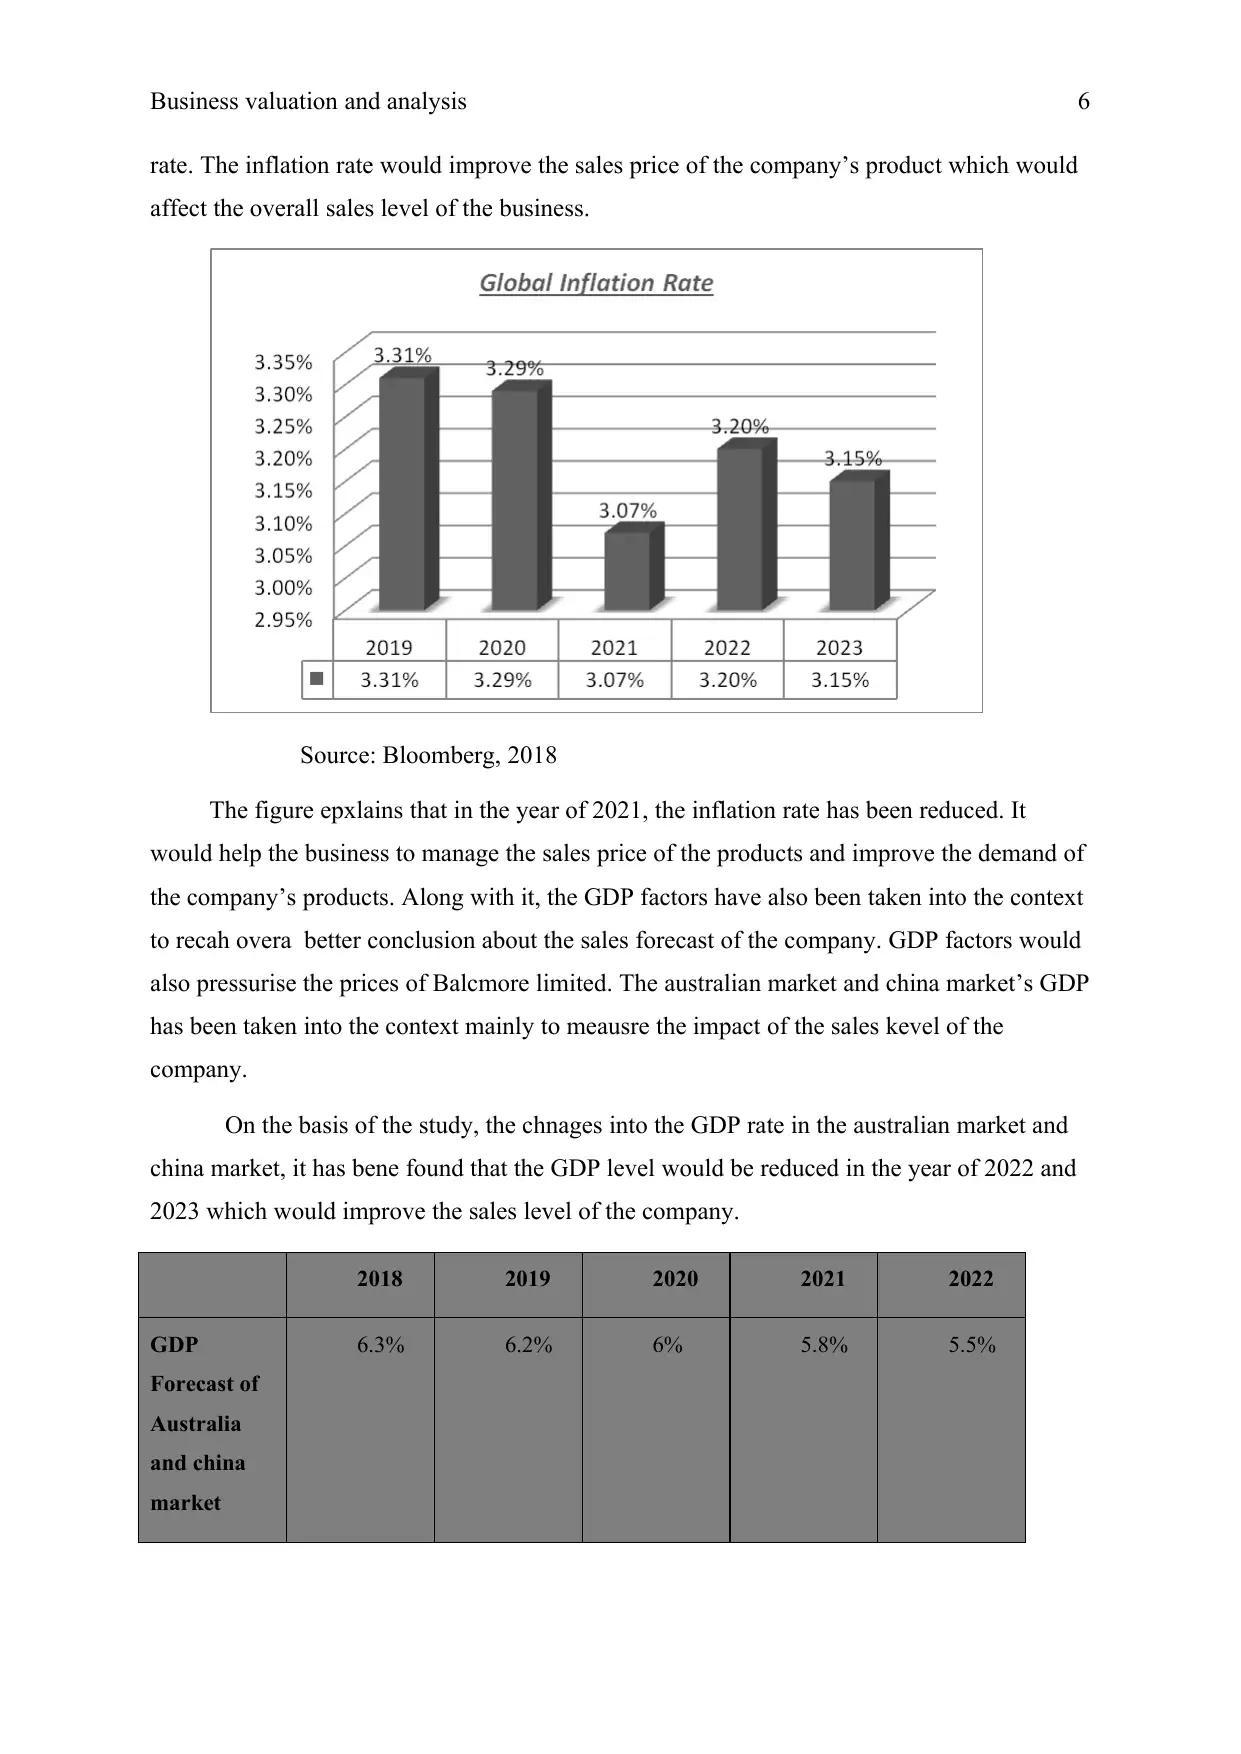
The inflation rate of the global market has also been studied and it has been found that
the price of the product is very much influenced with the inflation rate of the global. The
below given figure explains the inflation rate of the country would be improved at a constant
quality of the business is better and which would help the business to improve the
performance in near future. The sales growth rate of the company in next 5 years is as
follows:
Figure 1: Sales Growth
(Statista, 2018)
Blackmore has faced different growth rate of sales in last 5 years. On the basis of the
calculations, it has been found that the changes in the sales structure of the company would
affect the sales growth rate of the company in next 2 years as well. But along with the time,
positive changes would take place in the sales performance of the company because of the
changes in the strategically positions and the diversification of business at new market. the
sales of the company has been reduced by 13% in the year of 2018 and further it has been
estimated that in the next 2 year, it would take some time to the company to manage the sales
level of the business and further, it would be improved at a great extent.
Though, the changes in the sales pattern of the company has affected the sales
position of the company from number 1 to number 2 at host country as well as at other
diversified companies. The new strategies of the company such as opening the new stores,
diversified at new market, offer quality products etc would help the company to improve the
sales level in the market (Moles, Parrino and Kidwekk, 2011).
The inflation rate of the global market has also been studied and it has been found that
the price of the product is very much influenced with the inflation rate of the global. The
below given figure explains the inflation rate of the country would be improved at a constant
Business valuation and analysis 6
rate. The inflation rate would improve the sales price of the company’s product which would
affect the overall sales level of the business.
Source: Bloomberg, 2018
The figure epxlains that in the year of 2021, the inflation rate has been reduced. It
would help the business to manage the sales price of the products and improve the demand of
the company’s products. Along with it, the GDP factors have also been taken into the context
to recah overa better conclusion about the sales forecast of the company. GDP factors would
also pressurise the prices of Balcmore limited. The australian market and china market’s GDP
has been taken into the context mainly to meausre the impact of the sales kevel of the
company.
On the basis of the study, the chnages into the GDP rate in the australian market and
china market, it has bene found that the GDP level would be reduced in the year of 2022 and
2023 which would improve the sales level of the company.
2018 2019 2020 2021 2022
GDP
Forecast of
Australia
and china
market
6.3% 6.2% 6% 5.8% 5.5%
⊘ This is a preview!⊘
Do you want full access?
Subscribe today to unlock all pages.
Trusted by 1+ million students worldwide
Business valuation and analysis 7
The other factors such as population rate, industry growth rate etc has been taken into
the concern. The population rate of the country is expected to be decreased because of the
low fertility rate as well as the industry growth rate would be expected to be improved in near
future which would lead to the business towards better performance. On the basis of the
overall study on the sales growth rate, it has been measured that the overall performance of
sales would be improved in the year of 2021, 2022 and 2023. The diversification and other
strategies would help the business to achieve the level.
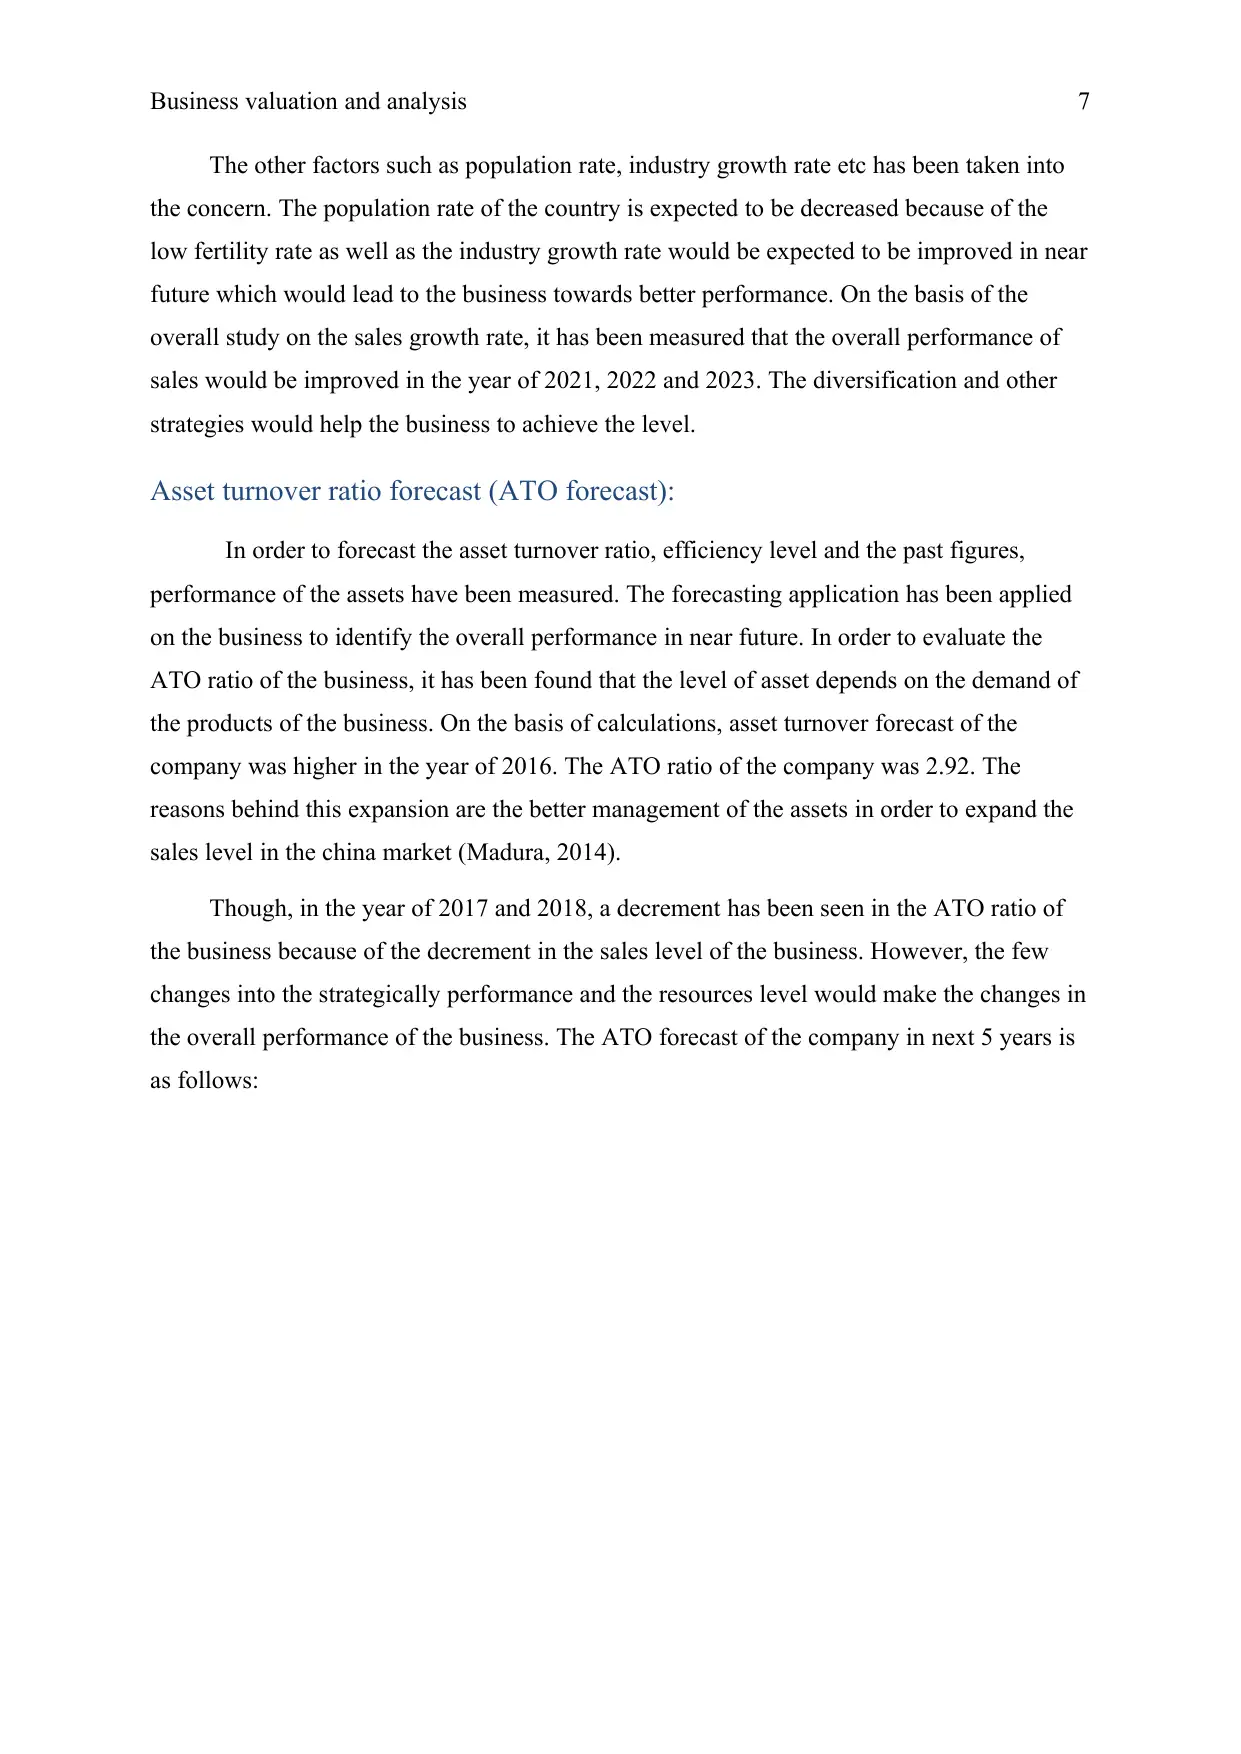
Asset turnover ratio forecast (ATO forecast):
In order to forecast the asset turnover ratio, efficiency level and the past figures,
performance of the assets have been measured. The forecasting application has been applied
on the business to identify the overall performance in near future. In order to evaluate the
ATO ratio of the business, it has been found that the level of asset depends on the demand of
the products of the business. On the basis of calculations, asset turnover forecast of the
company was higher in the year of 2016. The ATO ratio of the company was 2.92. The
reasons behind this expansion are the better management of the assets in order to expand the
sales level in the china market (Madura, 2014).
Though, in the year of 2017 and 2018, a decrement has been seen in the ATO ratio of
the business because of the decrement in the sales level of the business. However, the few
changes into the strategically performance and the resources level would make the changes in
the overall performance of the business. The ATO forecast of the company in next 5 years is
as follows:
The other factors such as population rate, industry growth rate etc has been taken into
the concern. The population rate of the country is expected to be decreased because of the
low fertility rate as well as the industry growth rate would be expected to be improved in near
future which would lead to the business towards better performance. On the basis of the
overall study on the sales growth rate, it has been measured that the overall performance of
sales would be improved in the year of 2021, 2022 and 2023. The diversification and other
strategies would help the business to achieve the level.
Asset turnover ratio forecast (ATO forecast):
In order to forecast the asset turnover ratio, efficiency level and the past figures,
performance of the assets have been measured. The forecasting application has been applied
on the business to identify the overall performance in near future. In order to evaluate the
ATO ratio of the business, it has been found that the level of asset depends on the demand of
the products of the business. On the basis of calculations, asset turnover forecast of the
company was higher in the year of 2016. The ATO ratio of the company was 2.92. The
reasons behind this expansion are the better management of the assets in order to expand the
sales level in the china market (Madura, 2014).
Though, in the year of 2017 and 2018, a decrement has been seen in the ATO ratio of
the business because of the decrement in the sales level of the business. However, the few
changes into the strategically performance and the resources level would make the changes in
the overall performance of the business. The ATO forecast of the company in next 5 years is
as follows:
Paraphrase This Document
Need a fresh take? Get an instant paraphrase of this document with our AI Paraphraser
Business valuation and analysis 8
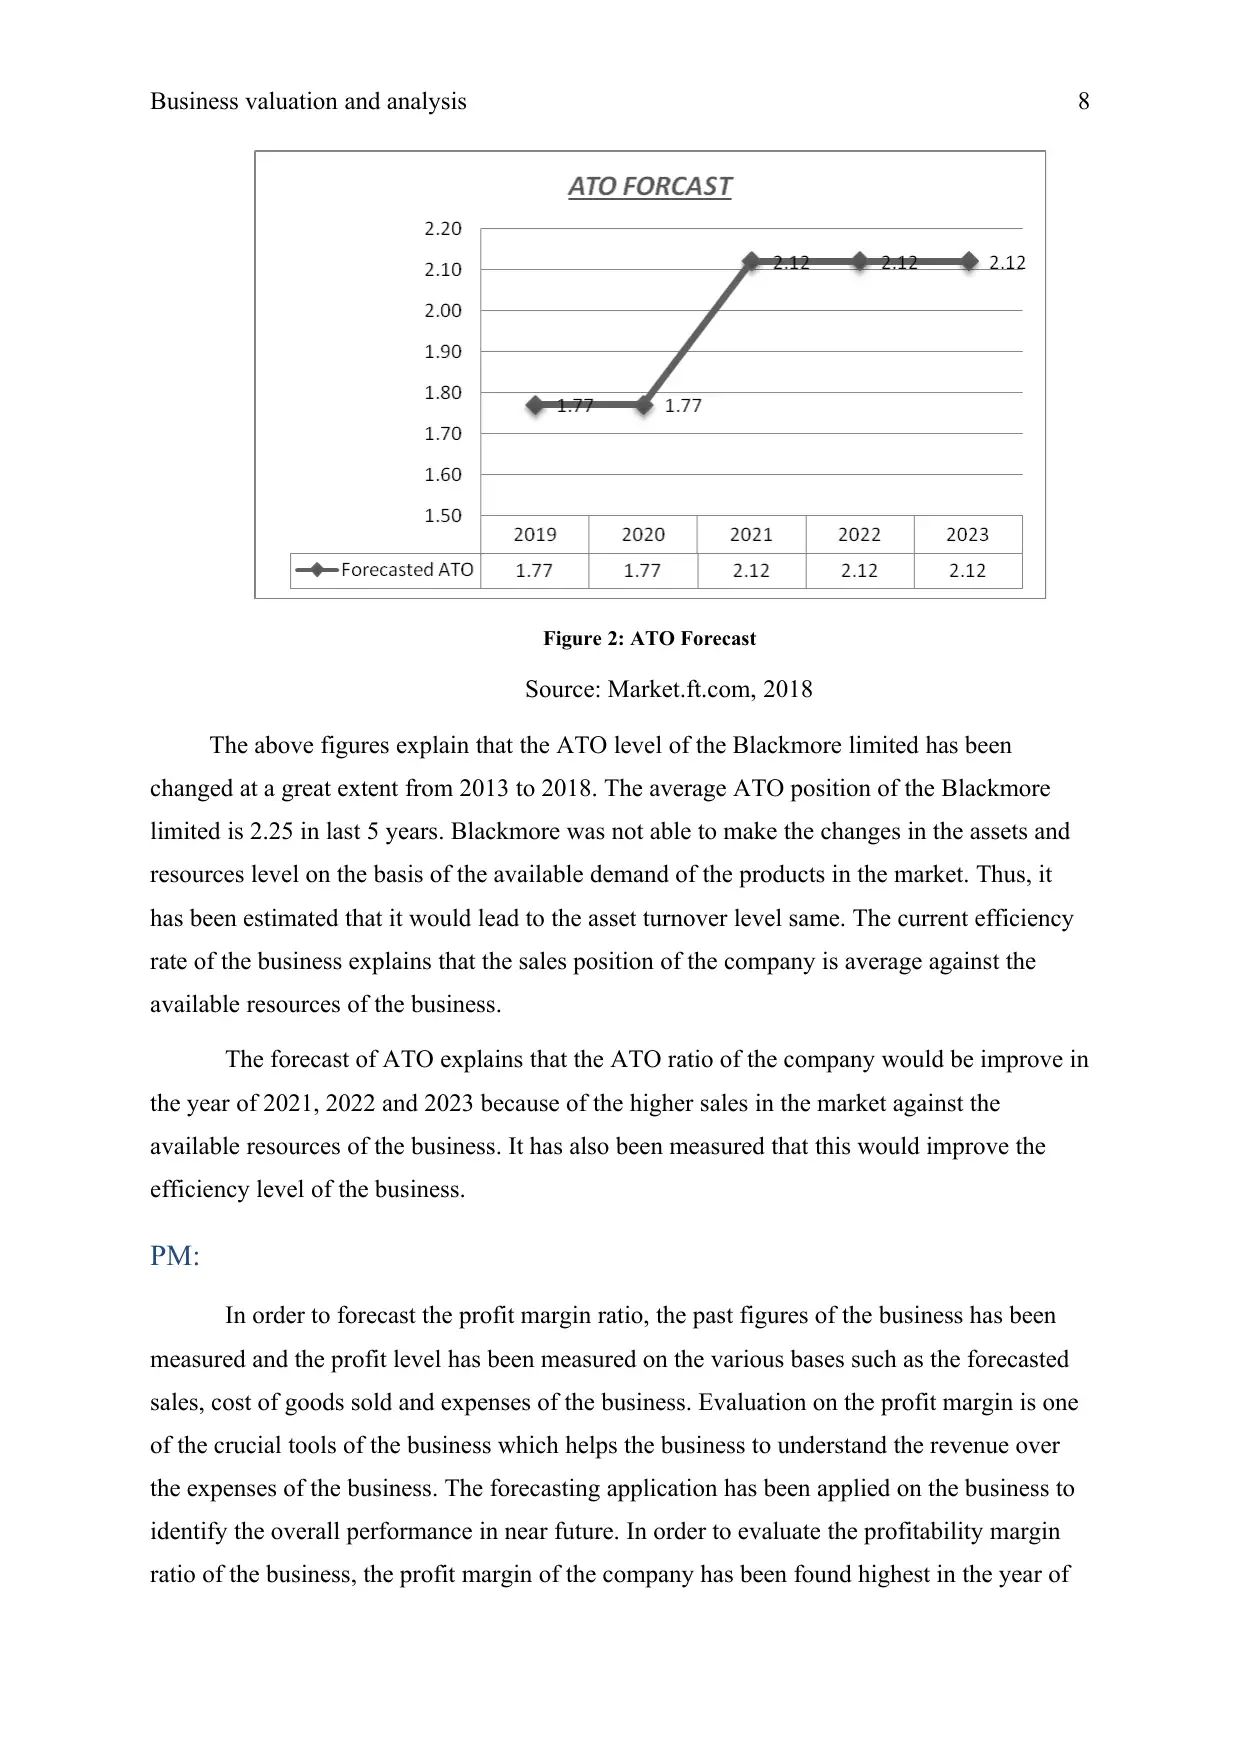
Figure 2: ATO Forecast
Source: Market.ft.com, 2018
The above figures explain that the ATO level of the Blackmore limited has been
changed at a great extent from 2013 to 2018. The average ATO position of the Blackmore
limited is 2.25 in last 5 years. Blackmore was not able to make the changes in the assets and
resources level on the basis of the available demand of the products in the market. Thus, it
has been estimated that it would lead to the asset turnover level same. The current efficiency
rate of the business explains that the sales position of the company is average against the
available resources of the business.
The forecast of ATO explains that the ATO ratio of the company would be improve in
the year of 2021, 2022 and 2023 because of the higher sales in the market against the
available resources of the business. It has also been measured that this would improve the
efficiency level of the business.
PM:
In order to forecast the profit margin ratio, the past figures of the business has been
measured and the profit level has been measured on the various bases such as the forecasted
sales, cost of goods sold and expenses of the business. Evaluation on the profit margin is one
of the crucial tools of the business which helps the business to understand the revenue over
the expenses of the business. The forecasting application has been applied on the business to
identify the overall performance in near future. In order to evaluate the profitability margin
ratio of the business, the profit margin of the company has been found highest in the year of
Business valuation and analysis 9
2016. The PM ratio of the company was 101,287 thousands and the increment rate in profit
margin is 107%. The reasons behind this expansion are the higher sales turnover of the
business and the better management of the expenses of the company (Blackmore.com.au,
2018).
Though, in the year of 2017 and 2018, a decrement has been seen in the PM ratio of the
business because of the decrement in the sales level of the business. However, the few
changes into the strategically performance and the resources level would make the changes in
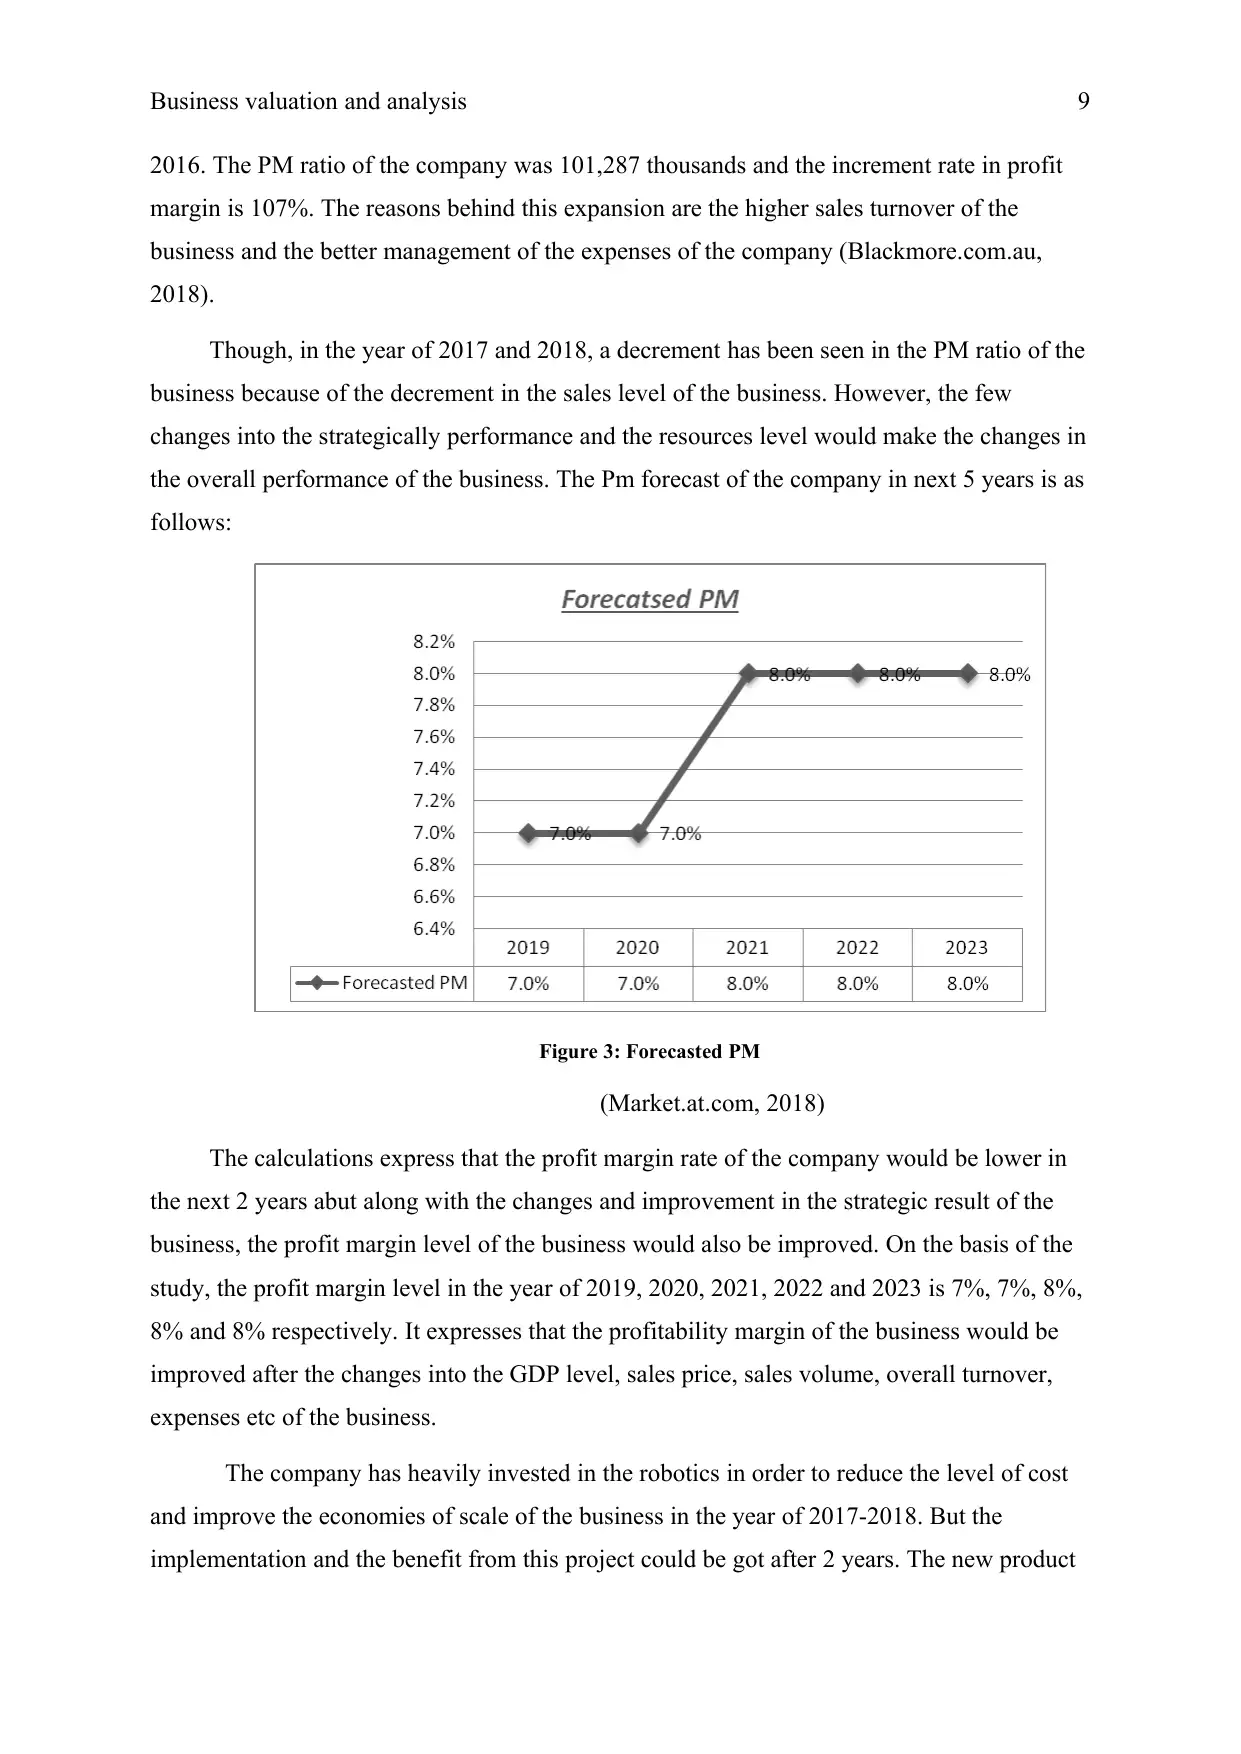
the overall performance of the business. The Pm forecast of the company in next 5 years is as
follows:
Figure 3: Forecasted PM
(Market.at.com, 2018)
The calculations express that the profit margin rate of the company would be lower in
the next 2 years abut along with the changes and improvement in the strategic result of the
business, the profit margin level of the business would also be improved. On the basis of the
study, the profit margin level in the year of 2019, 2020, 2021, 2022 and 2023 is 7%, 7%, 8%,
8% and 8% respectively. It expresses that the profitability margin of the business would be
improved after the changes into the GDP level, sales price, sales volume, overall turnover,
expenses etc of the business.
The company has heavily invested in the robotics in order to reduce the level of cost
and improve the economies of scale of the business in the year of 2017-2018. But the
implementation and the benefit from this project could be got after 2 years. The new product
2016. The PM ratio of the company was 101,287 thousands and the increment rate in profit
margin is 107%. The reasons behind this expansion are the higher sales turnover of the
business and the better management of the expenses of the company (Blackmore.com.au,
2018).
Though, in the year of 2017 and 2018, a decrement has been seen in the PM ratio of the
business because of the decrement in the sales level of the business. However, the few
changes into the strategically performance and the resources level would make the changes in
the overall performance of the business. The Pm forecast of the company in next 5 years is as
follows:
Figure 3: Forecasted PM
(Market.at.com, 2018)
The calculations express that the profit margin rate of the company would be lower in
the next 2 years abut along with the changes and improvement in the strategic result of the
business, the profit margin level of the business would also be improved. On the basis of the
study, the profit margin level in the year of 2019, 2020, 2021, 2022 and 2023 is 7%, 7%, 8%,
8% and 8% respectively. It expresses that the profitability margin of the business would be
improved after the changes into the GDP level, sales price, sales volume, overall turnover,
expenses etc of the business.
The company has heavily invested in the robotics in order to reduce the level of cost
and improve the economies of scale of the business in the year of 2017-2018. But the
implementation and the benefit from this project could be got after 2 years. The new product
⊘ This is a preview!⊘
Do you want full access?
Subscribe today to unlock all pages.
Trusted by 1+ million students worldwide
Business valuation and analysis 10
launch of the company, infant baby formula would also improve the profitability level of the
business. Further, it has been found that the demand in the industry is continuously improving
which would improve the profit margin of Blackmore limited.
In the profitability trend of the company, the profit margin of the Blackmore limited has
been reduced in the year of 2017 and 2018. The negative trend has come into the profitability
margin of the business because of the shield increment in the sales level and profitability
level of the company in the year of 2016. The forecasting level explains that in next 5 years,
the highest profit margin growth rate of the company would be 8% only because of the lower
demand of the products and various GDP, inflation rate, political factors etc in the business
(Higgins, 2012).
However, the international market diversification could help the business to improve
the sales and the profit margin level of the business. The previous data of the company
represent that around $ 312 million sales of the company id from Asian market only. So a
conversion rate would help the company to reduce the overall expenses and improve the
profitability margin of the business. It has been estimated that the AUD conversion rate slows
at reduced rate on the basis of the USD rate. However, in case of Chinese currency, Yuan, it
has been found that the reduced rate of Yuan is higher. The changes and the implementation
of conversion rate in the business would improve the overall performance of the business.
Free cash flow and Net dividend payout ratio forecasting:
Free cash flow is a crucial figure of finance which explains the total cash managed by
the company at a particular date. In order to forecast the free cash flow, the past figures of the
business have been measured and the profit margin of the business as a function of NOPAT
has been measured. Evaluation on the free cash flow forecasting is offers a decision base to
the management and other stakeholders of the business. The positive FCFF explains that the
company has enough funds to raise, run and manage the operations of the business whereas
the negative FCFF explains that the company has not enough funds to run the business and
thus it is depending on the stakeholders for the funds (Kaplan and Atkinson, 2015).
The forecasting application has been applied on the business to identify the overall
performance in near future. In order to evaluate the free cash flow of the business, NOA
position of the company has been improved at great extent because of the changes in the
operations and acquisitions. The company has improved the level of free cash flow in order to
meet the demands of the business. Because of the increment in the NOA, the returns of the
Paraphrase This Document
Need a fresh take? Get an instant paraphrase of this document with our AI Paraphraser
Business valuation and analysis 11
company have been improved as well the FCF level of the company represents about the
better cash management.
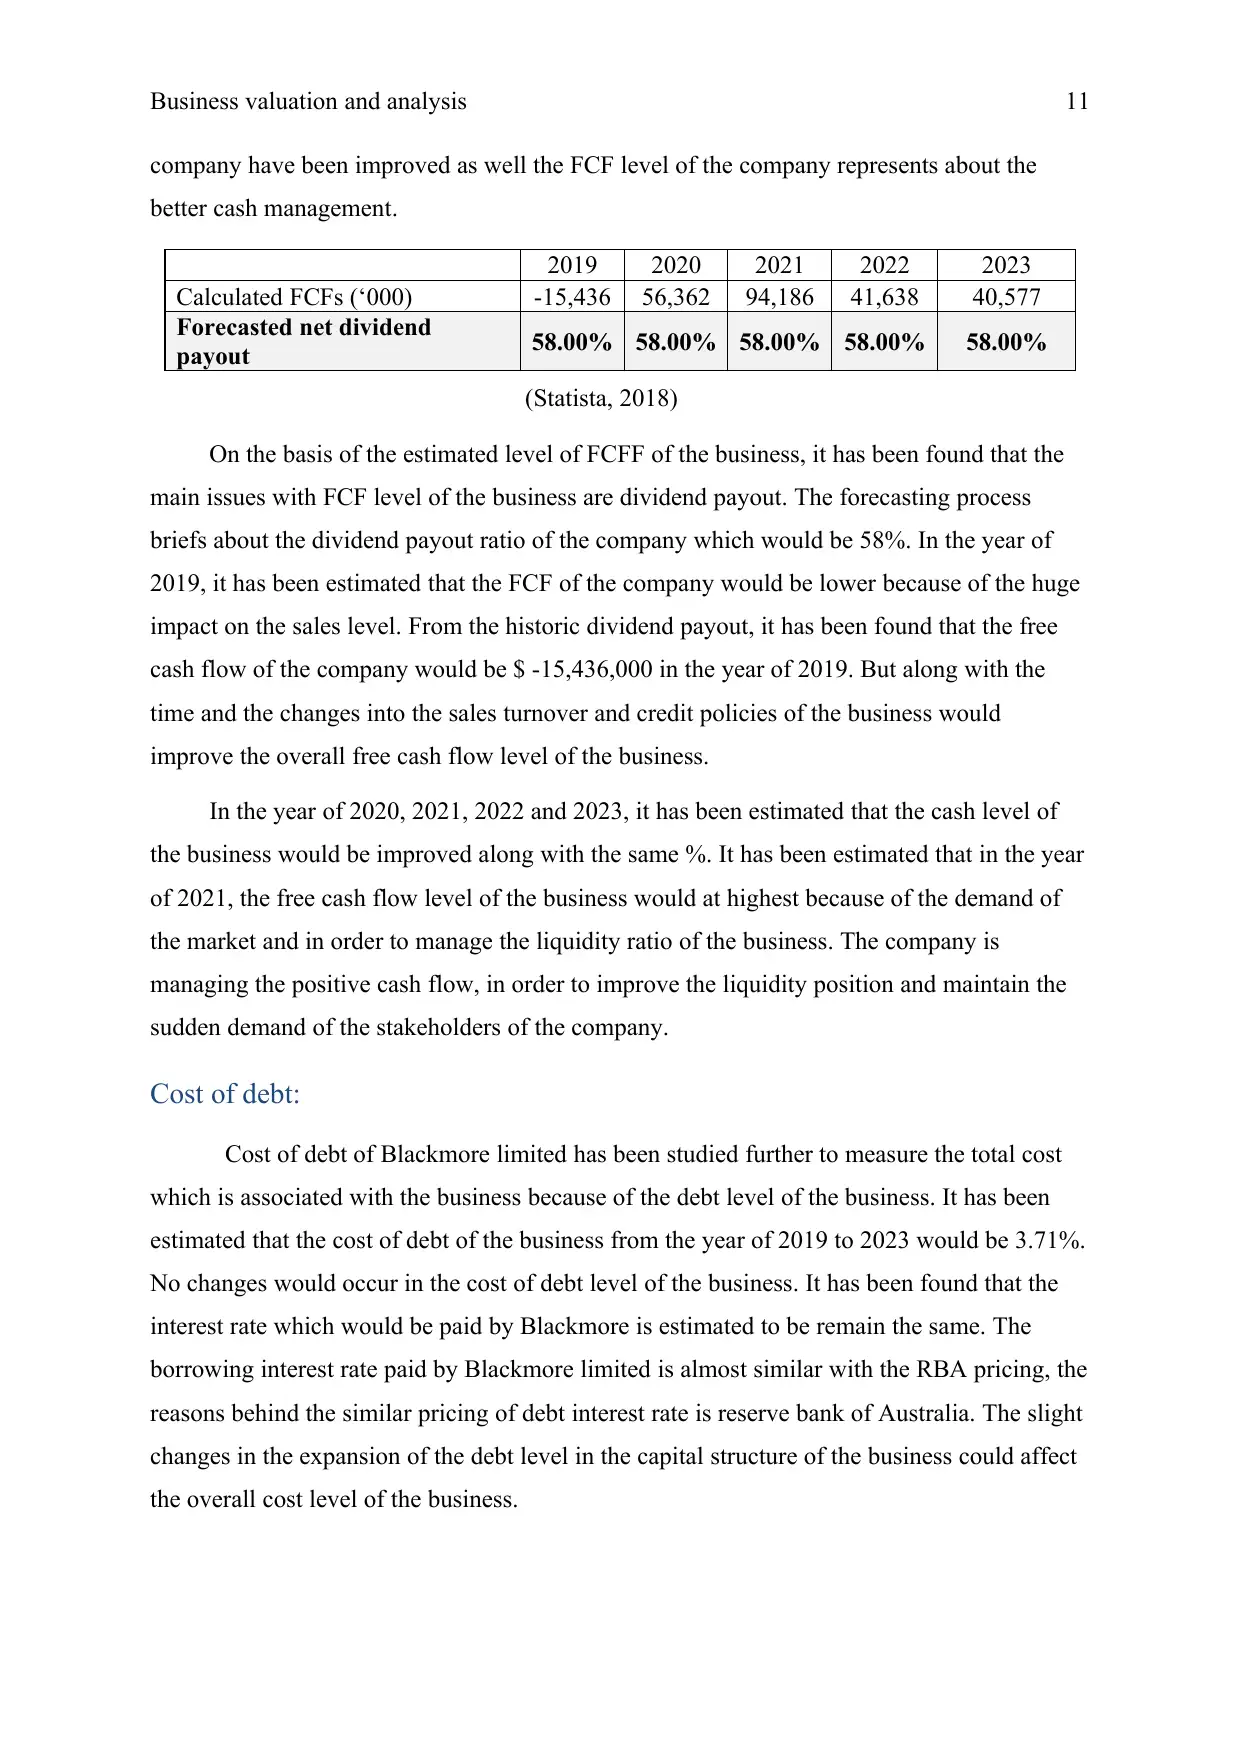
2019 2020 2021 2022 2023
Calculated FCFs (‘000) -15,436 56,362 94,186 41,638 40,577
Forecasted net dividend
payout 58.00% 58.00% 58.00% 58.00% 58.00%
(Statista, 2018)
On the basis of the estimated level of FCFF of the business, it has been found that the
main issues with FCF level of the business are dividend payout. The forecasting process
briefs about the dividend payout ratio of the company which would be 58%. In the year of
2019, it has been estimated that the FCF of the company would be lower because of the huge
impact on the sales level. From the historic dividend payout, it has been found that the free
cash flow of the company would be $ -15,436,000 in the year of 2019. But along with the
time and the changes into the sales turnover and credit policies of the business would
improve the overall free cash flow level of the business.
In the year of 2020, 2021, 2022 and 2023, it has been estimated that the cash level of
the business would be improved along with the same %. It has been estimated that in the year
of 2021, the free cash flow level of the business would at highest because of the demand of
the market and in order to manage the liquidity ratio of the business. The company is
managing the positive cash flow, in order to improve the liquidity position and maintain the
sudden demand of the stakeholders of the company.
Cost of debt:
Cost of debt of Blackmore limited has been studied further to measure the total cost
which is associated with the business because of the debt level of the business. It has been
estimated that the cost of debt of the business from the year of 2019 to 2023 would be 3.71%.
No changes would occur in the cost of debt level of the business. It has been found that the
interest rate which would be paid by Blackmore is estimated to be remain the same. The
borrowing interest rate paid by Blackmore limited is almost similar with the RBA pricing, the
reasons behind the similar pricing of debt interest rate is reserve bank of Australia. The slight
changes in the expansion of the debt level in the capital structure of the business could affect
the overall cost level of the business.
company have been improved as well the FCF level of the company represents about the
better cash management.
2019 2020 2021 2022 2023
Calculated FCFs (‘000) -15,436 56,362 94,186 41,638 40,577
Forecasted net dividend
payout 58.00% 58.00% 58.00% 58.00% 58.00%
(Statista, 2018)
On the basis of the estimated level of FCFF of the business, it has been found that the
main issues with FCF level of the business are dividend payout. The forecasting process
briefs about the dividend payout ratio of the company which would be 58%. In the year of
2019, it has been estimated that the FCF of the company would be lower because of the huge
impact on the sales level. From the historic dividend payout, it has been found that the free
cash flow of the company would be $ -15,436,000 in the year of 2019. But along with the
time and the changes into the sales turnover and credit policies of the business would
improve the overall free cash flow level of the business.
In the year of 2020, 2021, 2022 and 2023, it has been estimated that the cash level of
the business would be improved along with the same %. It has been estimated that in the year
of 2021, the free cash flow level of the business would at highest because of the demand of
the market and in order to manage the liquidity ratio of the business. The company is
managing the positive cash flow, in order to improve the liquidity position and maintain the
sudden demand of the stakeholders of the company.
Cost of debt:
Cost of debt of Blackmore limited has been studied further to measure the total cost
which is associated with the business because of the debt level of the business. It has been
estimated that the cost of debt of the business from the year of 2019 to 2023 would be 3.71%.
No changes would occur in the cost of debt level of the business. It has been found that the
interest rate which would be paid by Blackmore is estimated to be remain the same. The
borrowing interest rate paid by Blackmore limited is almost similar with the RBA pricing, the
reasons behind the similar pricing of debt interest rate is reserve bank of Australia. The slight
changes in the expansion of the debt level in the capital structure of the business could affect
the overall cost level of the business.
Business valuation and analysis 12
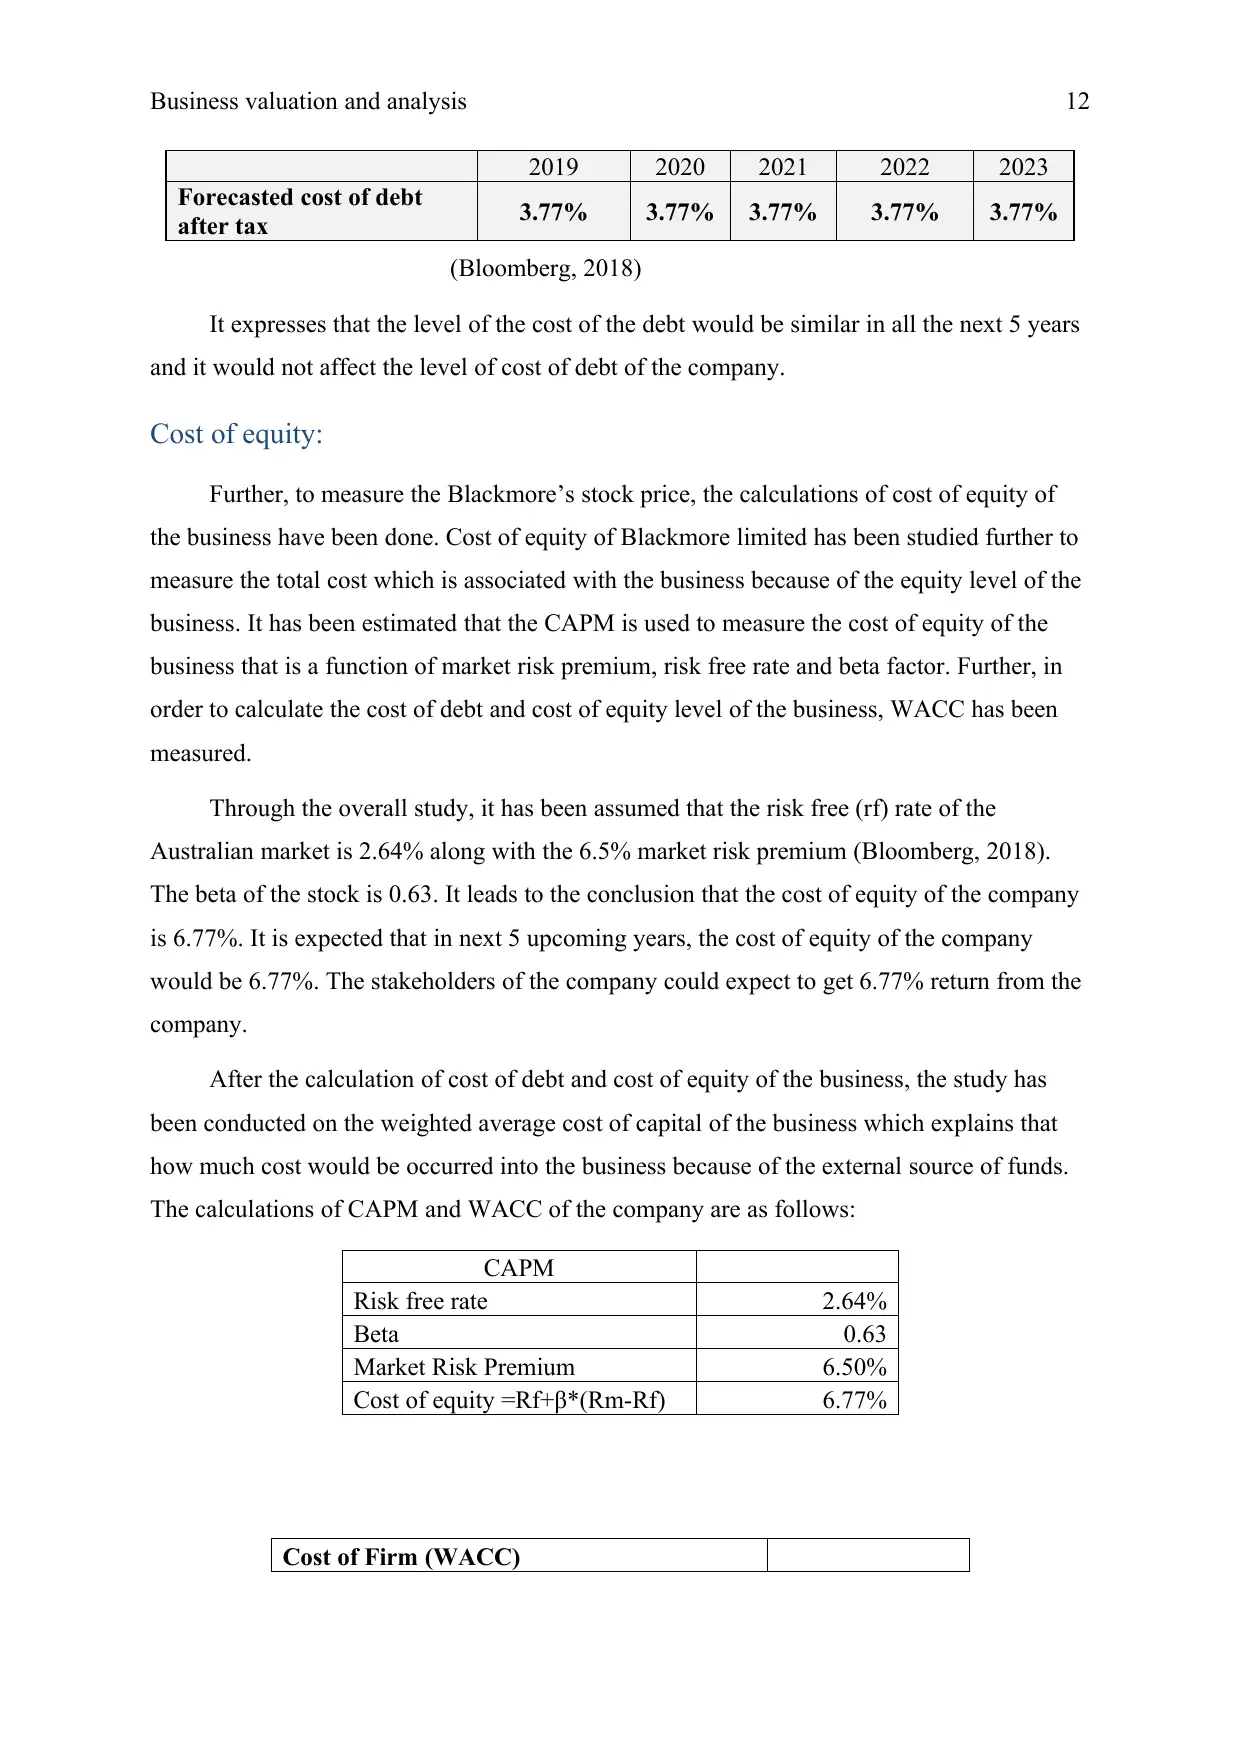
2019 2020 2021 2022 2023
Forecasted cost of debt
after tax 3.77% 3.77% 3.77% 3.77% 3.77%
(Bloomberg, 2018)
It expresses that the level of the cost of the debt would be similar in all the next 5 years
and it would not affect the level of cost of debt of the company.
Cost of equity:
Further, to measure the Blackmore’s stock price, the calculations of cost of equity of
the business have been done. Cost of equity of Blackmore limited has been studied further to
measure the total cost which is associated with the business because of the equity level of the
business. It has been estimated that the CAPM is used to measure the cost of equity of the
business that is a function of market risk premium, risk free rate and beta factor. Further, in
order to calculate the cost of debt and cost of equity level of the business, WACC has been
measured.
Through the overall study, it has been assumed that the risk free (rf) rate of the
Australian market is 2.64% along with the 6.5% market risk premium (Bloomberg, 2018).
The beta of the stock is 0.63. It leads to the conclusion that the cost of equity of the company
is 6.77%. It is expected that in next 5 upcoming years, the cost of equity of the company
would be 6.77%. The stakeholders of the company could expect to get 6.77% return from the
company.
After the calculation of cost of debt and cost of equity of the business, the study has
been conducted on the weighted average cost of capital of the business which explains that
how much cost would be occurred into the business because of the external source of funds.
The calculations of CAPM and WACC of the company are as follows:
CAPM
Risk free rate 2.64%
Βeta 0.63
Market Risk Premium 6.50%
Cost of equity =Rf+β*(Rm-Rf) 6.77%
Cost of Firm (WACC)
⊘ This is a preview!⊘
Do you want full access?
Subscribe today to unlock all pages.
Trusted by 1+ million students worldwide
1 out of 25
Related Documents


Your All-in-One AI-Powered Toolkit for Academic Success.
+13062052269
info@desklib.com
Available 24*7 on WhatsApp / Email
![[object Object]](/_next/static/media/star-bottom.7253800d.svg)
Unlock your academic potential
Copyright © 2020–2026 A2Z Services. All Rights Reserved. Developed and managed by ZUCOL.