Blacktown Census 2016 Report: Population, Income, and Housing Analysis
VerifiedAdded on 2020/12/09
|12
|2108
|231
Report
AI Summary
This report presents an analysis of the 2016 Blacktown census data, focusing on key demographic and economic indicators. It begins with an introduction to the local government area (LGA) and its role, followed by a detailed demographic profile of Blacktown, including population size, age distribution, marital status, and educational attainment. The report then examines household structure and dwelling information, such as dwelling types, tenure, and the number of bedrooms. Further, it explores income distribution and inequalities, highlighting weekly earnings and unpaid work statistics. Finally, the report analyzes household expenditures on mortgage and rent, providing insights into housing affordability. The report utilizes census data to provide a comprehensive overview of the Blacktown community and its economic landscape.

MARKETING
Paraphrase This Document
Need a fresh take? Get an instant paraphrase of this document with our AI Paraphraser
Table of Contents
INTRODUCTION....................................................................................................................... 1
Main body.................................................................................................................................... 1
Demographic Profile................................................................................................................ 2
Household Structure And Dwelling Information......................................................................2
Income Distribution And Inequality......................................................................................... 4
Expenditure On Mortgage And Rent........................................................................................ 5
CONCLUSION........................................................................................................................... 7
REFERENCES............................................................................................................................ 7
·INTRODUCTION
The local government area is a government part of a country that a local authority is obligated
for. However, the scale of an LGA varies by way of different countries but it's far normally a
partition of a country, state, division, or district. Moreover, LGA is popularly known as
municipality where authorities has different powers to control the country (Baldwin and et.al.,
2015). Further, this report will highlight the census 2016 of Blacktown which is situated within
the New South Wales and under which it represents the demographic profile of the city which
includes how many people live in that town, how many people are educated and uneducated and
how many people are married and single and how many people are separated, how many females
are widow etc.
Further, the project will divide the age groups accordingly depicts the population like
there are 22000 people who belong to 0-20 yrs of age etc. Moreover, the assignment will
highlight the household structure and dwellings owned by the people. On the flip side, the
project will outline the income distribution and inequalities of the people like how many people
are unpaid and how many people have earned income on a weekly basis. Eventually the report
will comment on the expenditures of people on mortgage and rent (Tippler, and Dean,2016).
·Main body
New South Wales is a domain of southeastern Australia, hold each coastal mountains and
highland. However, it is finite by the Pacific Ocean to the east and the province of Victoria
towards the south, South Australia in the west and Queensland in the north. Moreover, New
South Wales additionally involve Lord Howe Island, 360 miles (580 km) towards the east of the
state. Further, the capital of the new south wales is Sydney which the largest city of the country.
Moreover, New South Wales is composed of the largest financial system and its demographic,
governmental, and monetary range consist of model of Australia as an entire.
Blacktown is a residential area within situated in more Western Sydney, in the country of
New South Wales, Australia. Blacktown is positioned 34 kilometers in the west of the Sydney
imperative commercial enterprise district (Dieleman,2017). However, Blacktown is the largest of
any residential district or town in New South Wales and is one of the largest town that has people
with different types of culture. Further, being inside the center of Sydney, Blacktown town is
easy to access from any Sydney highway or primary railways. Moreover, it is midway between
⊘ This is a preview!⊘
Do you want full access?
Subscribe today to unlock all pages.
Trusted by 1+ million students worldwide
the Sydney and the Blue Mountains, provides a convenient way to visit different places of the
city and can go for a shopping along the way (Blacktown City 2016).
Blacktown metropolis has a numerous collection of award-winning sights, global venues
and different sporting sights. However, international Olympic or other sporting centers captivate
the most elite sports players and a good deal of golf equipment, venues, cultural and leisure
sights will affect sporting and leisure fanatics at every degree.
l壱Demographic Profile
The census of 2016 disclosed that there are around 40000 people who resides in the city of
Blacktown within which 50% of people are males and 49% of people consists of females and
there are around 2% of population who are islander people. However, the Blacktown consists
more of millennial and lower percentage of retired people.
As of 2016, approx 40% of people were born in this is town. However, there are around
7% of population who are don't speak English and belong to India. Moreover, in Blacktown
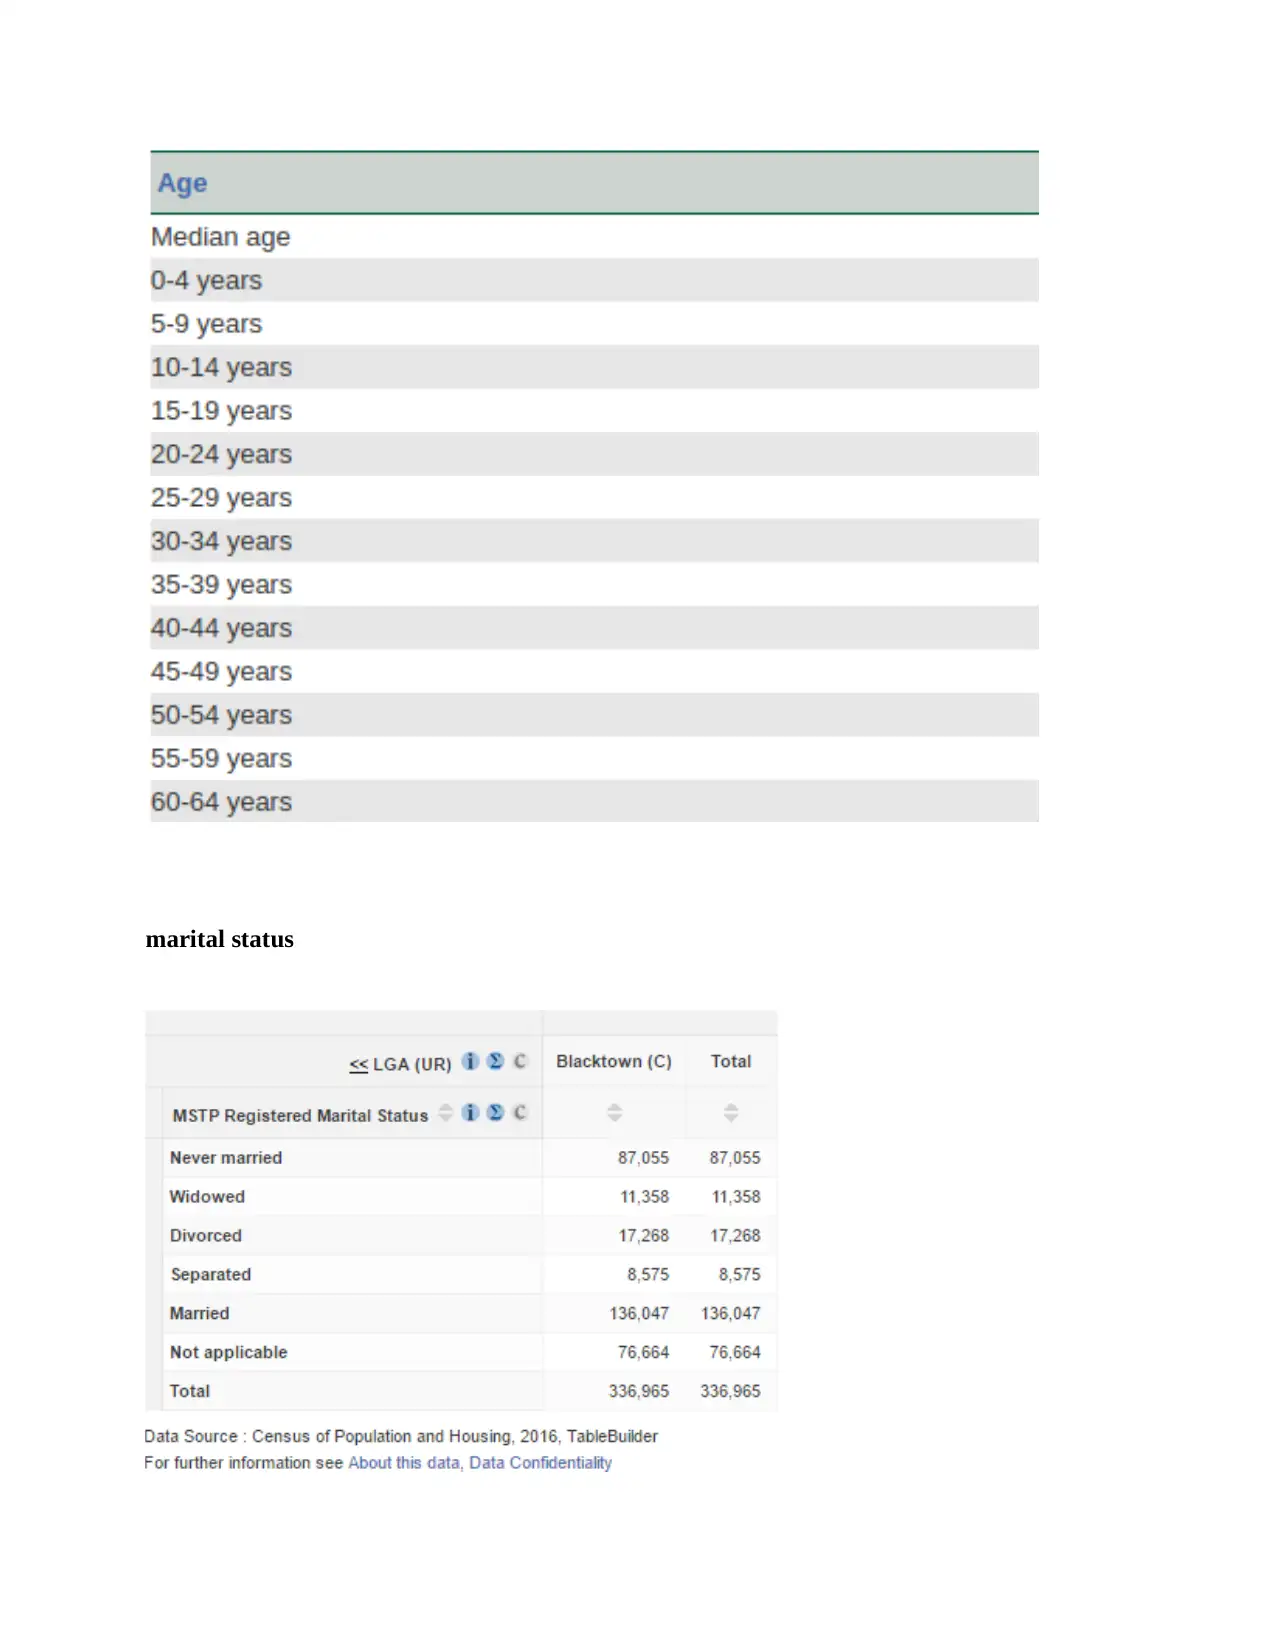
different age group of people resides which is divided into different age groups like around
22000 people belong to 0-20 years of age group i.e. 25% of population, around 31000 of people
belong to 25-45 years of age group i.e. 36% and 55 and above years of people consists of 16000
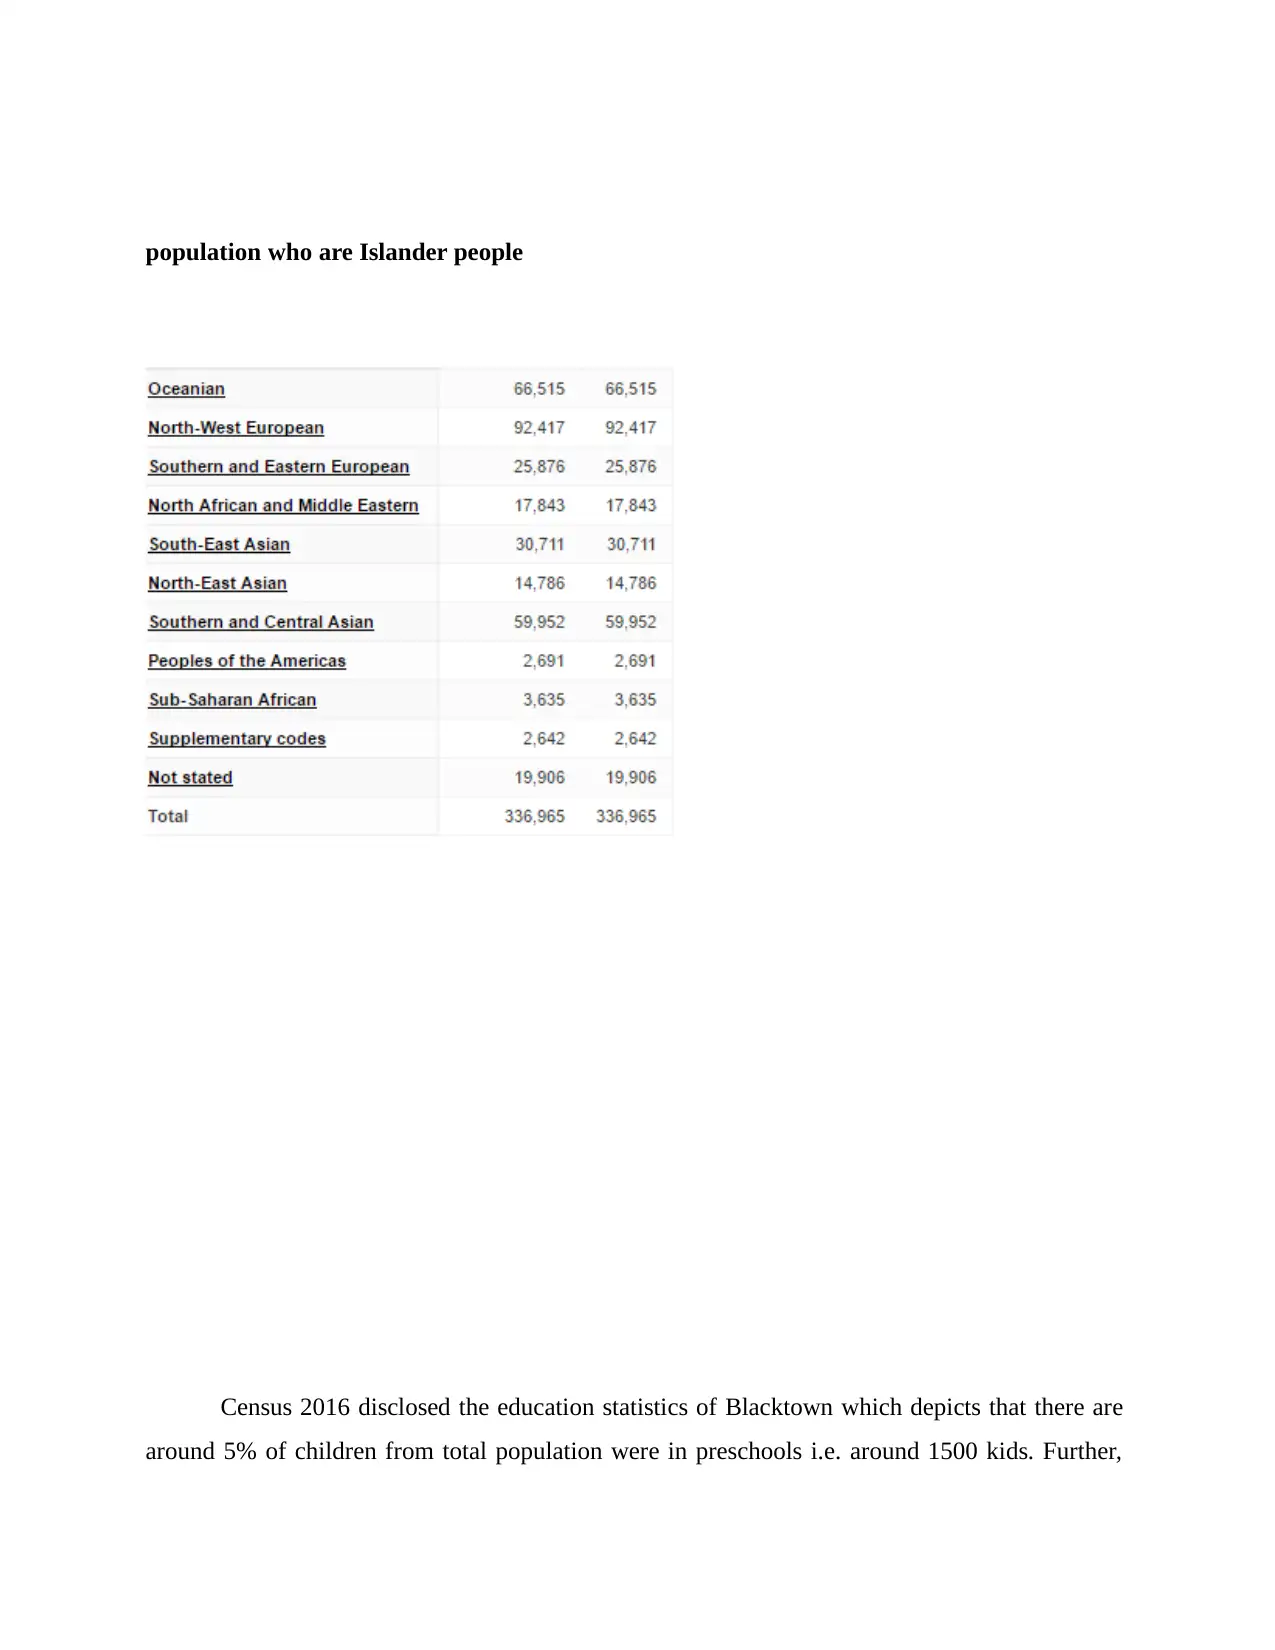
of total population which means around 20%.Further, married people in Blacktown consists of
around 50% of the population i.e. 35000 people, separated people includes 3% of total
population i.e. around 2000 people, there are around 4000 people in Blacktown who are divorced
and covers around 6.9 % of population and there are 3000 females who are widow and covers
4.5% of total population and there are some people who are not married and covers 30% of total
population of Blacktown.
Total population 2016
city and can go for a shopping along the way (Blacktown City 2016).
Blacktown metropolis has a numerous collection of award-winning sights, global venues
and different sporting sights. However, international Olympic or other sporting centers captivate
the most elite sports players and a good deal of golf equipment, venues, cultural and leisure
sights will affect sporting and leisure fanatics at every degree.
l壱Demographic Profile
The census of 2016 disclosed that there are around 40000 people who resides in the city of
Blacktown within which 50% of people are males and 49% of people consists of females and
there are around 2% of population who are islander people. However, the Blacktown consists
more of millennial and lower percentage of retired people.
As of 2016, approx 40% of people were born in this is town. However, there are around
7% of population who are don't speak English and belong to India. Moreover, in Blacktown
different age group of people resides which is divided into different age groups like around
22000 people belong to 0-20 years of age group i.e. 25% of population, around 31000 of people
belong to 25-45 years of age group i.e. 36% and 55 and above years of people consists of 16000
of total population which means around 20%.Further, married people in Blacktown consists of
around 50% of the population i.e. 35000 people, separated people includes 3% of total
population i.e. around 2000 people, there are around 4000 people in Blacktown who are divorced
and covers around 6.9 % of population and there are 3000 females who are widow and covers
4.5% of total population and there are some people who are not married and covers 30% of total
population of Blacktown.
Total population 2016
Paraphrase This Document
Need a fresh take? Get an instant paraphrase of this document with our AI Paraphraser
marital status
⊘ This is a preview!⊘
Do you want full access?
Subscribe today to unlock all pages.
Trusted by 1+ million students worldwide
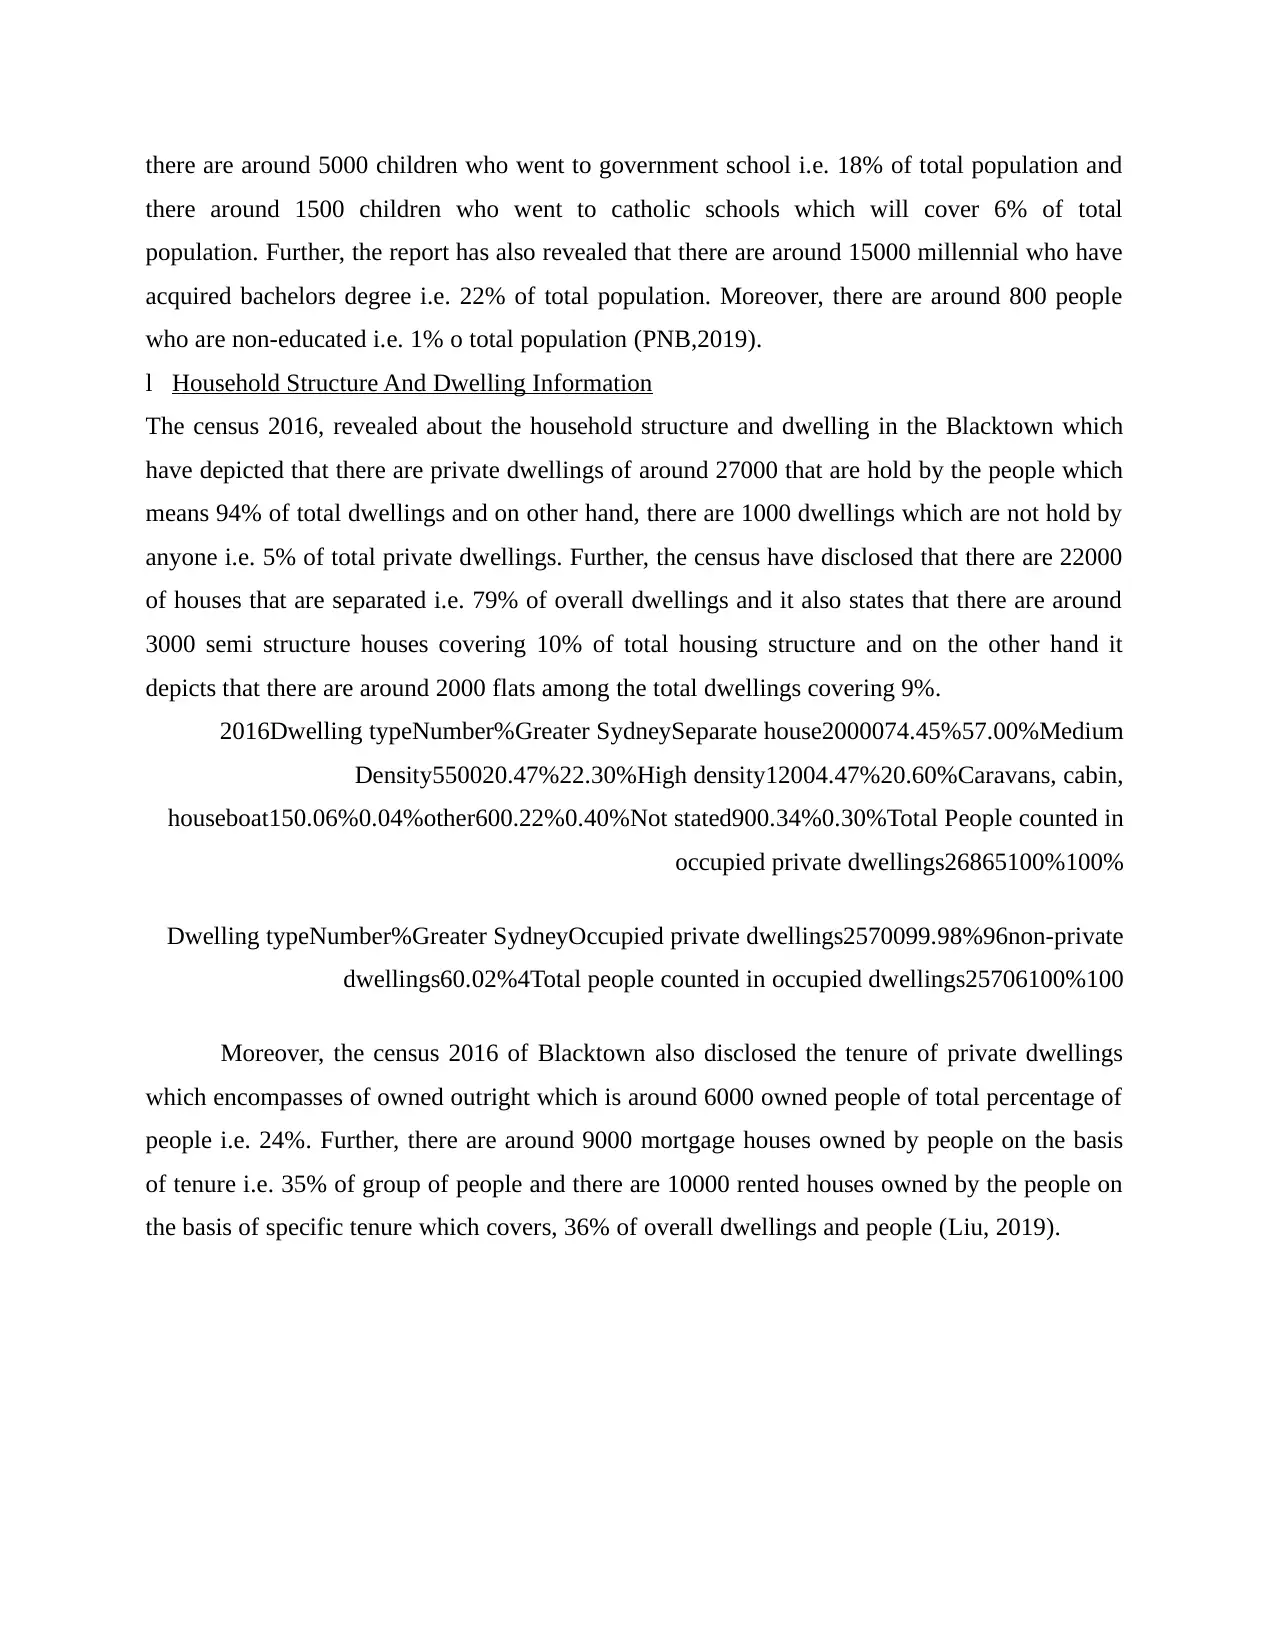
population who are Islander people
Census 2016 disclosed the education statistics of Blacktown which depicts that there are
around 5% of children from total population were in preschools i.e. around 1500 kids. Further,
Census 2016 disclosed the education statistics of Blacktown which depicts that there are
around 5% of children from total population were in preschools i.e. around 1500 kids. Further,
Paraphrase This Document
Need a fresh take? Get an instant paraphrase of this document with our AI Paraphraser
there are around 5000 children who went to government school i.e. 18% of total population and
there around 1500 children who went to catholic schools which will cover 6% of total
population. Further, the report has also revealed that there are around 15000 millennial who have
acquired bachelors degree i.e. 22% of total population. Moreover, there are around 800 people
who are non-educated i.e. 1% o total population (PNB,2019).
l壱Household Structure And Dwelling Information
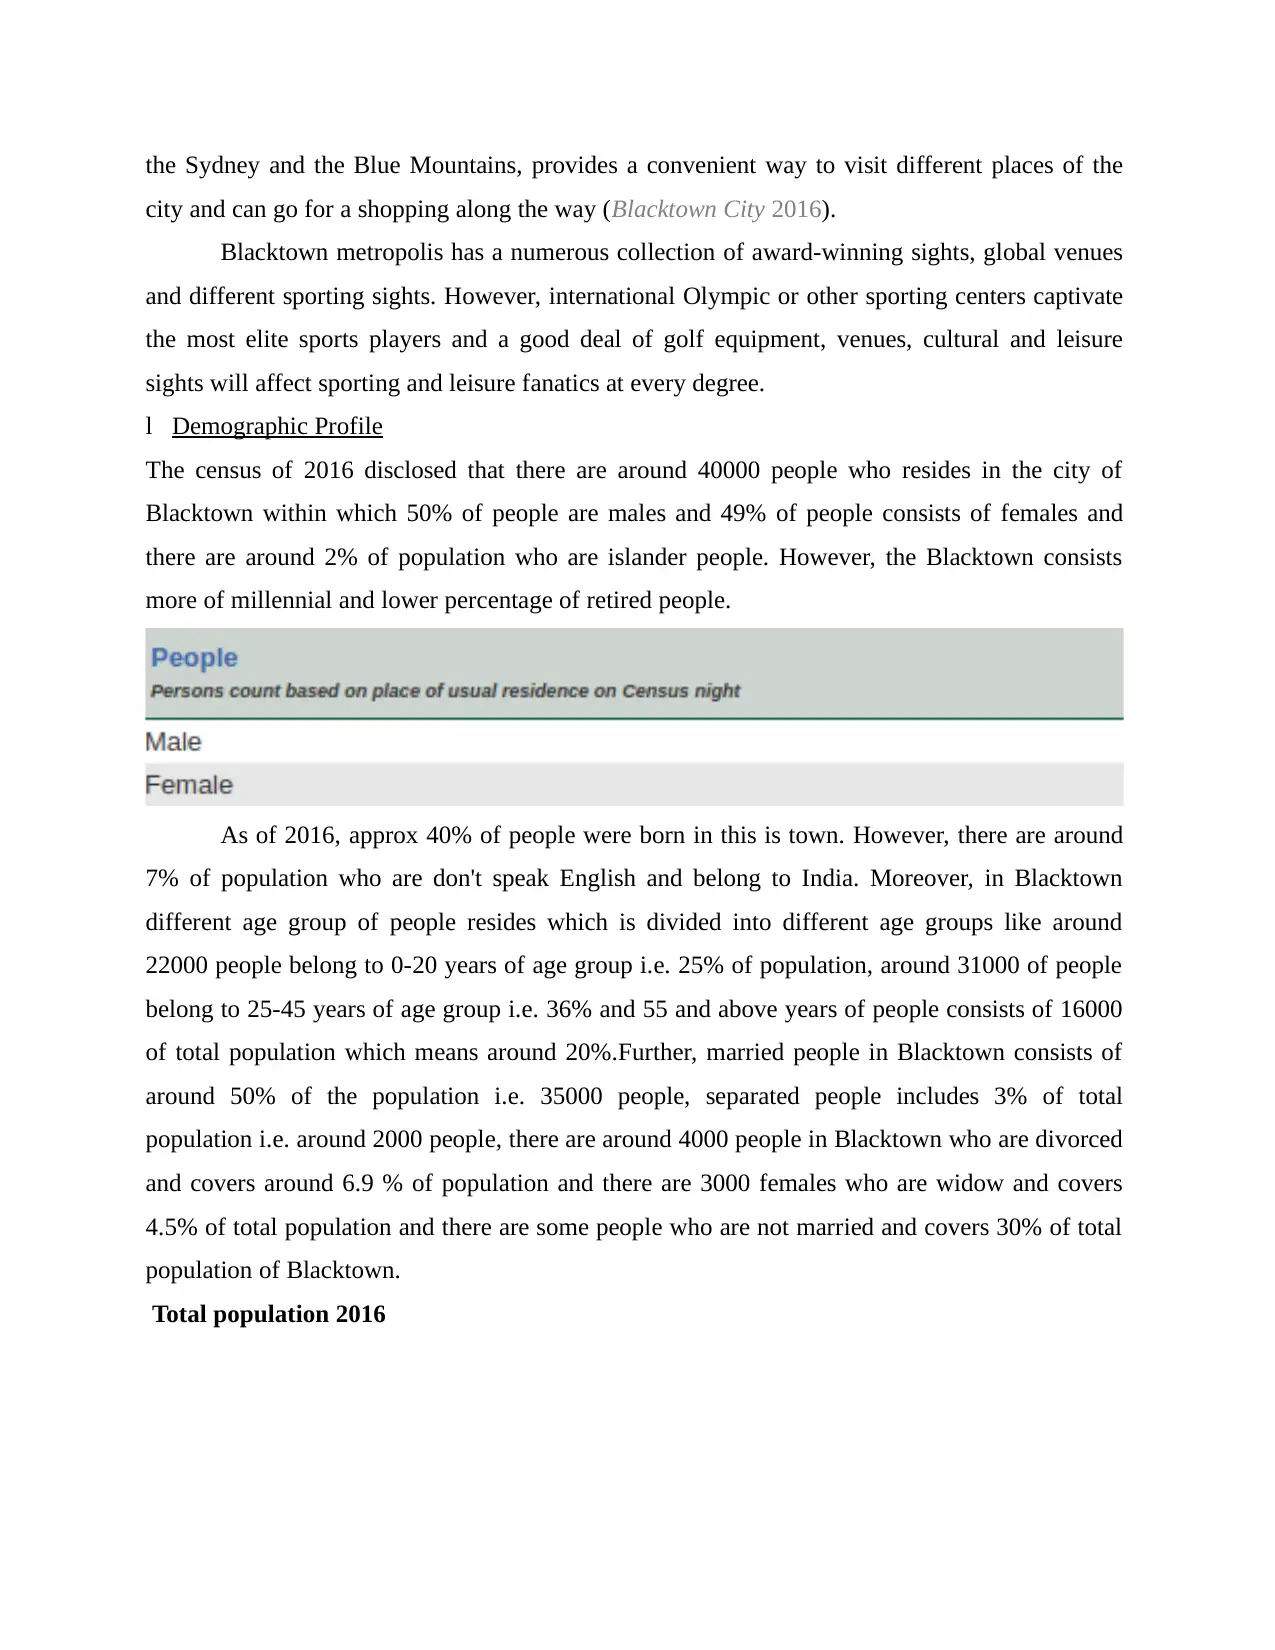
The census 2016, revealed about the household structure and dwelling in the Blacktown which
have depicted that there are private dwellings of around 27000 that are hold by the people which
means 94% of total dwellings and on other hand, there are 1000 dwellings which are not hold by
anyone i.e. 5% of total private dwellings. Further, the census have disclosed that there are 22000
of houses that are separated i.e. 79% of overall dwellings and it also states that there are around
3000 semi structure houses covering 10% of total housing structure and on the other hand it
depicts that there are around 2000 flats among the total dwellings covering 9%.
2016Dwelling typeNumber%Greater SydneySeparate house2000074.45%57.00%Medium
Density550020.47%22.30%High density12004.47%20.60%Caravans, cabin,
houseboat150.06%0.04%other600.22%0.40%Not stated900.34%0.30%Total People counted in
occupied private dwellings26865100%100%
Dwelling typeNumber%Greater SydneyOccupied private dwellings2570099.98%96non-private
dwellings60.02%4Total people counted in occupied dwellings25706100%100
Moreover, the census 2016 of Blacktown also disclosed the tenure of private dwellings
which encompasses of owned outright which is around 6000 owned people of total percentage of
people i.e. 24%. Further, there are around 9000 mortgage houses owned by people on the basis
of tenure i.e. 35% of group of people and there are 10000 rented houses owned by the people on
the basis of specific tenure which covers, 36% of overall dwellings and people (Liu, 2019).
there around 1500 children who went to catholic schools which will cover 6% of total
population. Further, the report has also revealed that there are around 15000 millennial who have
acquired bachelors degree i.e. 22% of total population. Moreover, there are around 800 people
who are non-educated i.e. 1% o total population (PNB,2019).
l壱Household Structure And Dwelling Information
The census 2016, revealed about the household structure and dwelling in the Blacktown which
have depicted that there are private dwellings of around 27000 that are hold by the people which
means 94% of total dwellings and on other hand, there are 1000 dwellings which are not hold by
anyone i.e. 5% of total private dwellings. Further, the census have disclosed that there are 22000
of houses that are separated i.e. 79% of overall dwellings and it also states that there are around
3000 semi structure houses covering 10% of total housing structure and on the other hand it
depicts that there are around 2000 flats among the total dwellings covering 9%.
2016Dwelling typeNumber%Greater SydneySeparate house2000074.45%57.00%Medium
Density550020.47%22.30%High density12004.47%20.60%Caravans, cabin,
houseboat150.06%0.04%other600.22%0.40%Not stated900.34%0.30%Total People counted in
occupied private dwellings26865100%100%
Dwelling typeNumber%Greater SydneyOccupied private dwellings2570099.98%96non-private
dwellings60.02%4Total people counted in occupied dwellings25706100%100
Moreover, the census 2016 of Blacktown also disclosed the tenure of private dwellings
which encompasses of owned outright which is around 6000 owned people of total percentage of
people i.e. 24%. Further, there are around 9000 mortgage houses owned by people on the basis
of tenure i.e. 35% of group of people and there are 10000 rented houses owned by the people on
the basis of specific tenure which covers, 36% of overall dwellings and people (Liu, 2019).
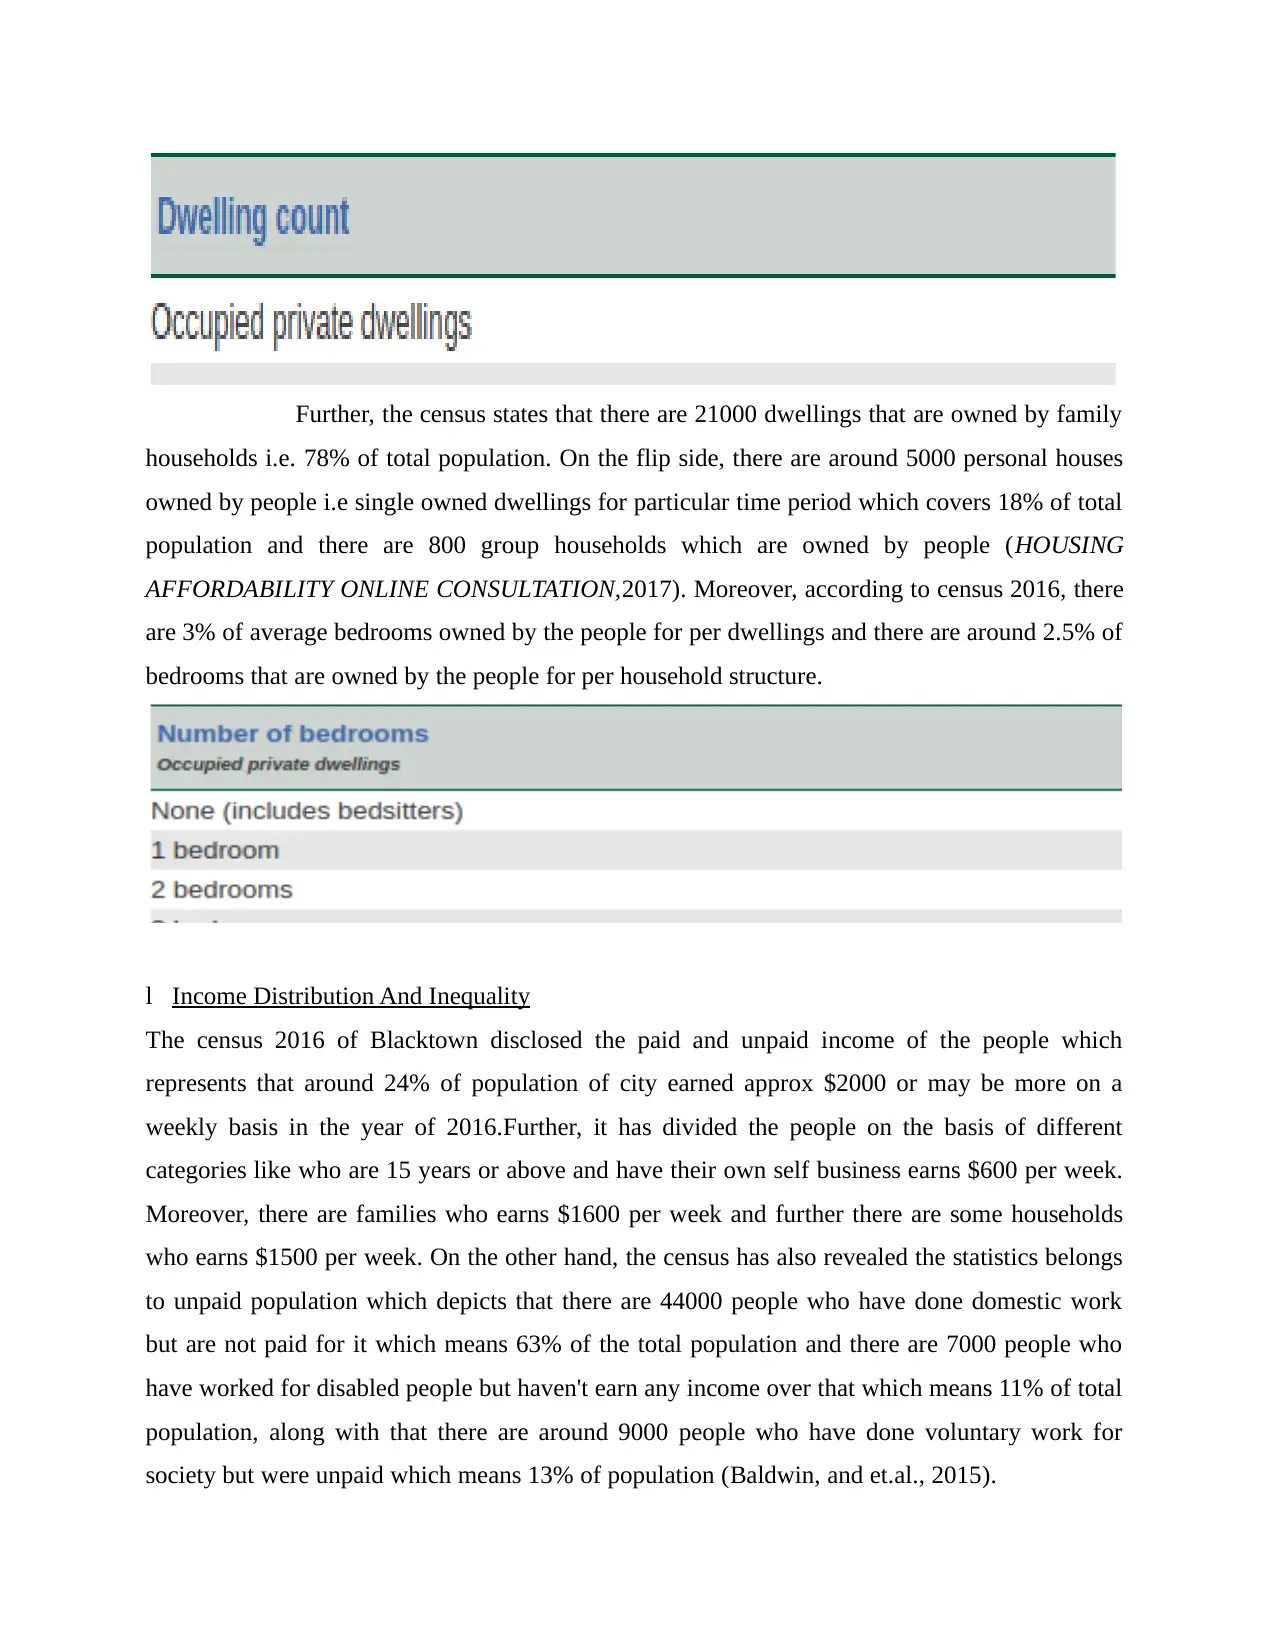
Further, the census states that there are 21000 dwellings that are owned by family
households i.e. 78% of total population. On the flip side, there are around 5000 personal houses
owned by people i.e single owned dwellings for particular time period which covers 18% of total
population and there are 800 group households which are owned by people (HOUSING
AFFORDABILITY ONLINE CONSULTATION,2017). Moreover, according to census 2016, there
are 3% of average bedrooms owned by the people for per dwellings and there are around 2.5% of
bedrooms that are owned by the people for per household structure.
l壱Income Distribution And Inequality
The census 2016 of Blacktown disclosed the paid and unpaid income of the people which
represents that around 24% of population of city earned approx $2000 or may be more on a
weekly basis in the year of 2016.Further, it has divided the people on the basis of different
categories like who are 15 years or above and have their own self business earns $600 per week.
Moreover, there are families who earns $1600 per week and further there are some households
who earns $1500 per week. On the other hand, the census has also revealed the statistics belongs
to unpaid population which depicts that there are 44000 people who have done domestic work
but are not paid for it which means 63% of the total population and there are 7000 people who
have worked for disabled people but haven't earn any income over that which means 11% of total
population, along with that there are around 9000 people who have done voluntary work for
society but were unpaid which means 13% of population (Baldwin, and et.al., 2015).
⊘ This is a preview!⊘
Do you want full access?
Subscribe today to unlock all pages.
Trusted by 1+ million students worldwide
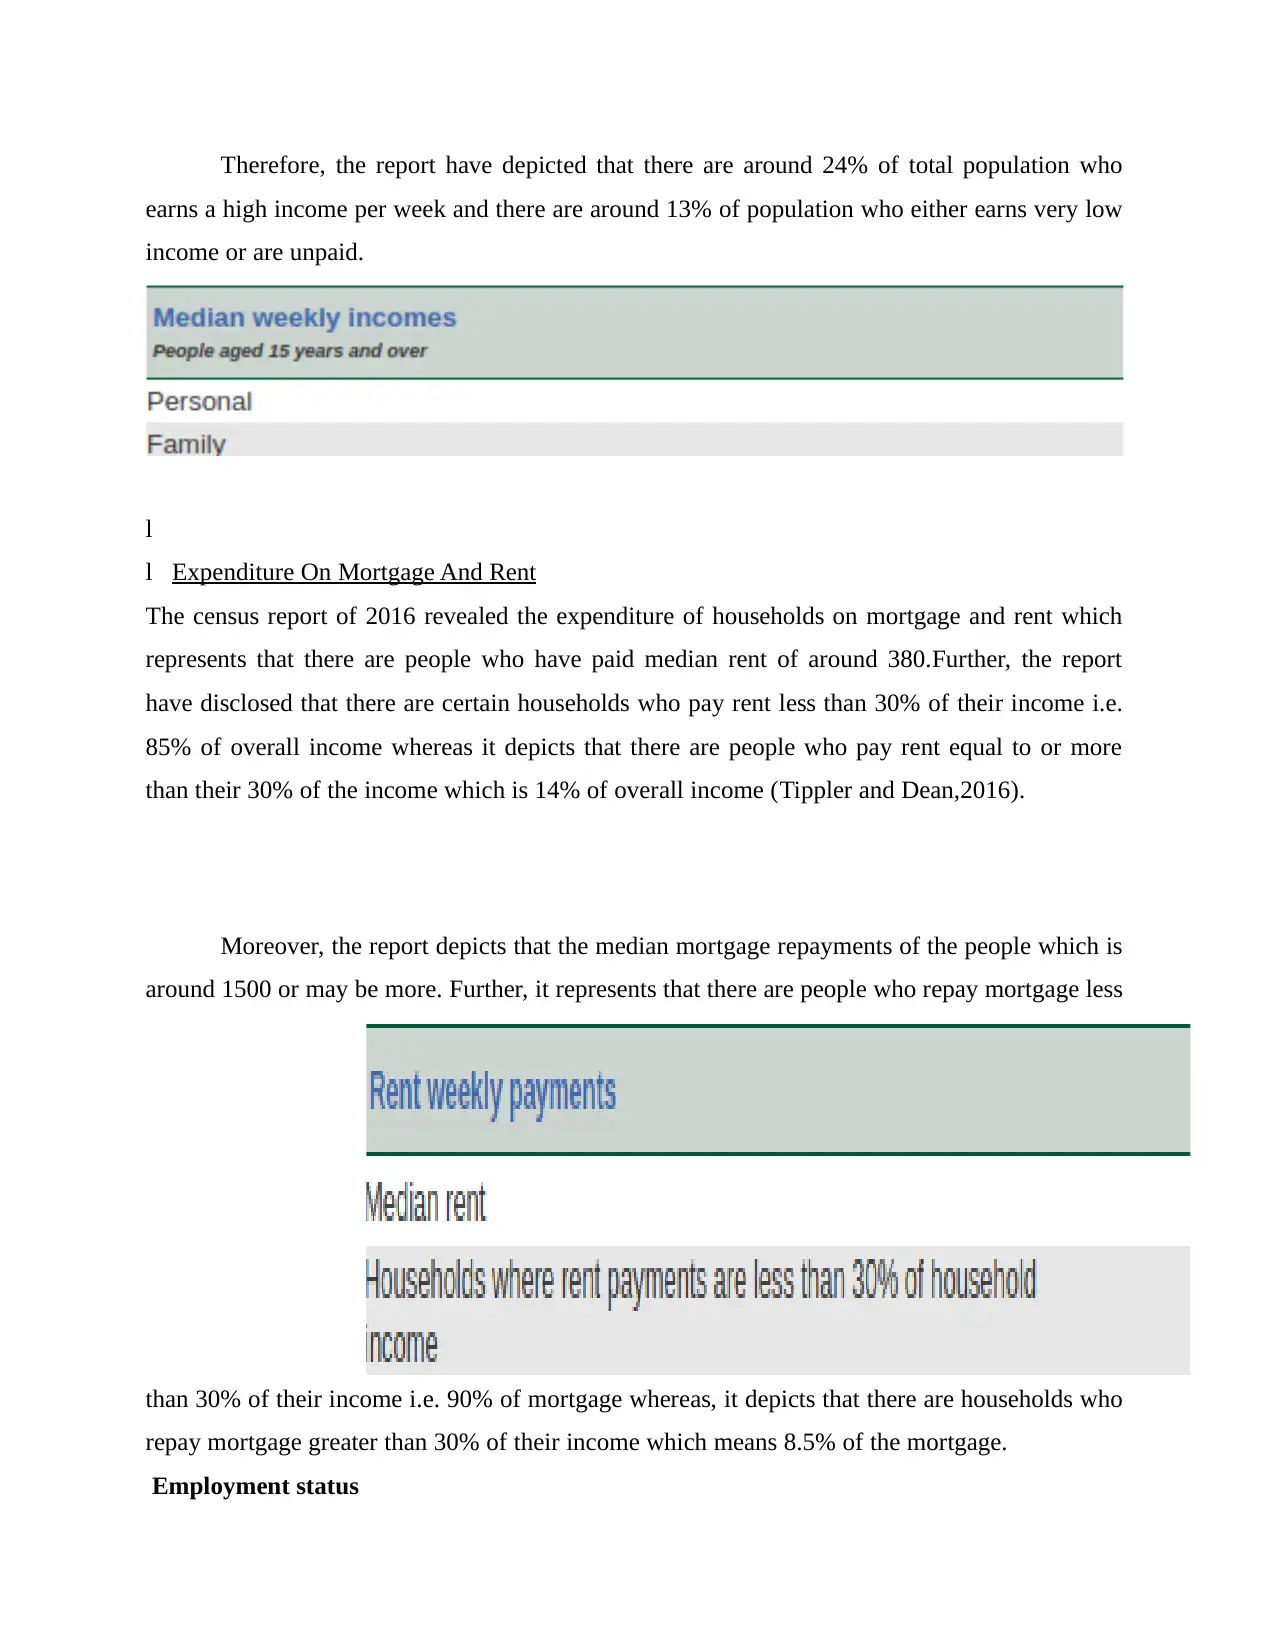
Therefore, the report have depicted that there are around 24% of total population who
earns a high income per week and there are around 13% of population who either earns very low
income or are unpaid.
l壱
l壱Expenditure On Mortgage And Rent
The census report of 2016 revealed the expenditure of households on mortgage and rent which
represents that there are people who have paid median rent of around 380.Further, the report
have disclosed that there are certain households who pay rent less than 30% of their income i.e.
85% of overall income whereas it depicts that there are people who pay rent equal to or more
than their 30% of the income which is 14% of overall income (Tippler and Dean,2016).
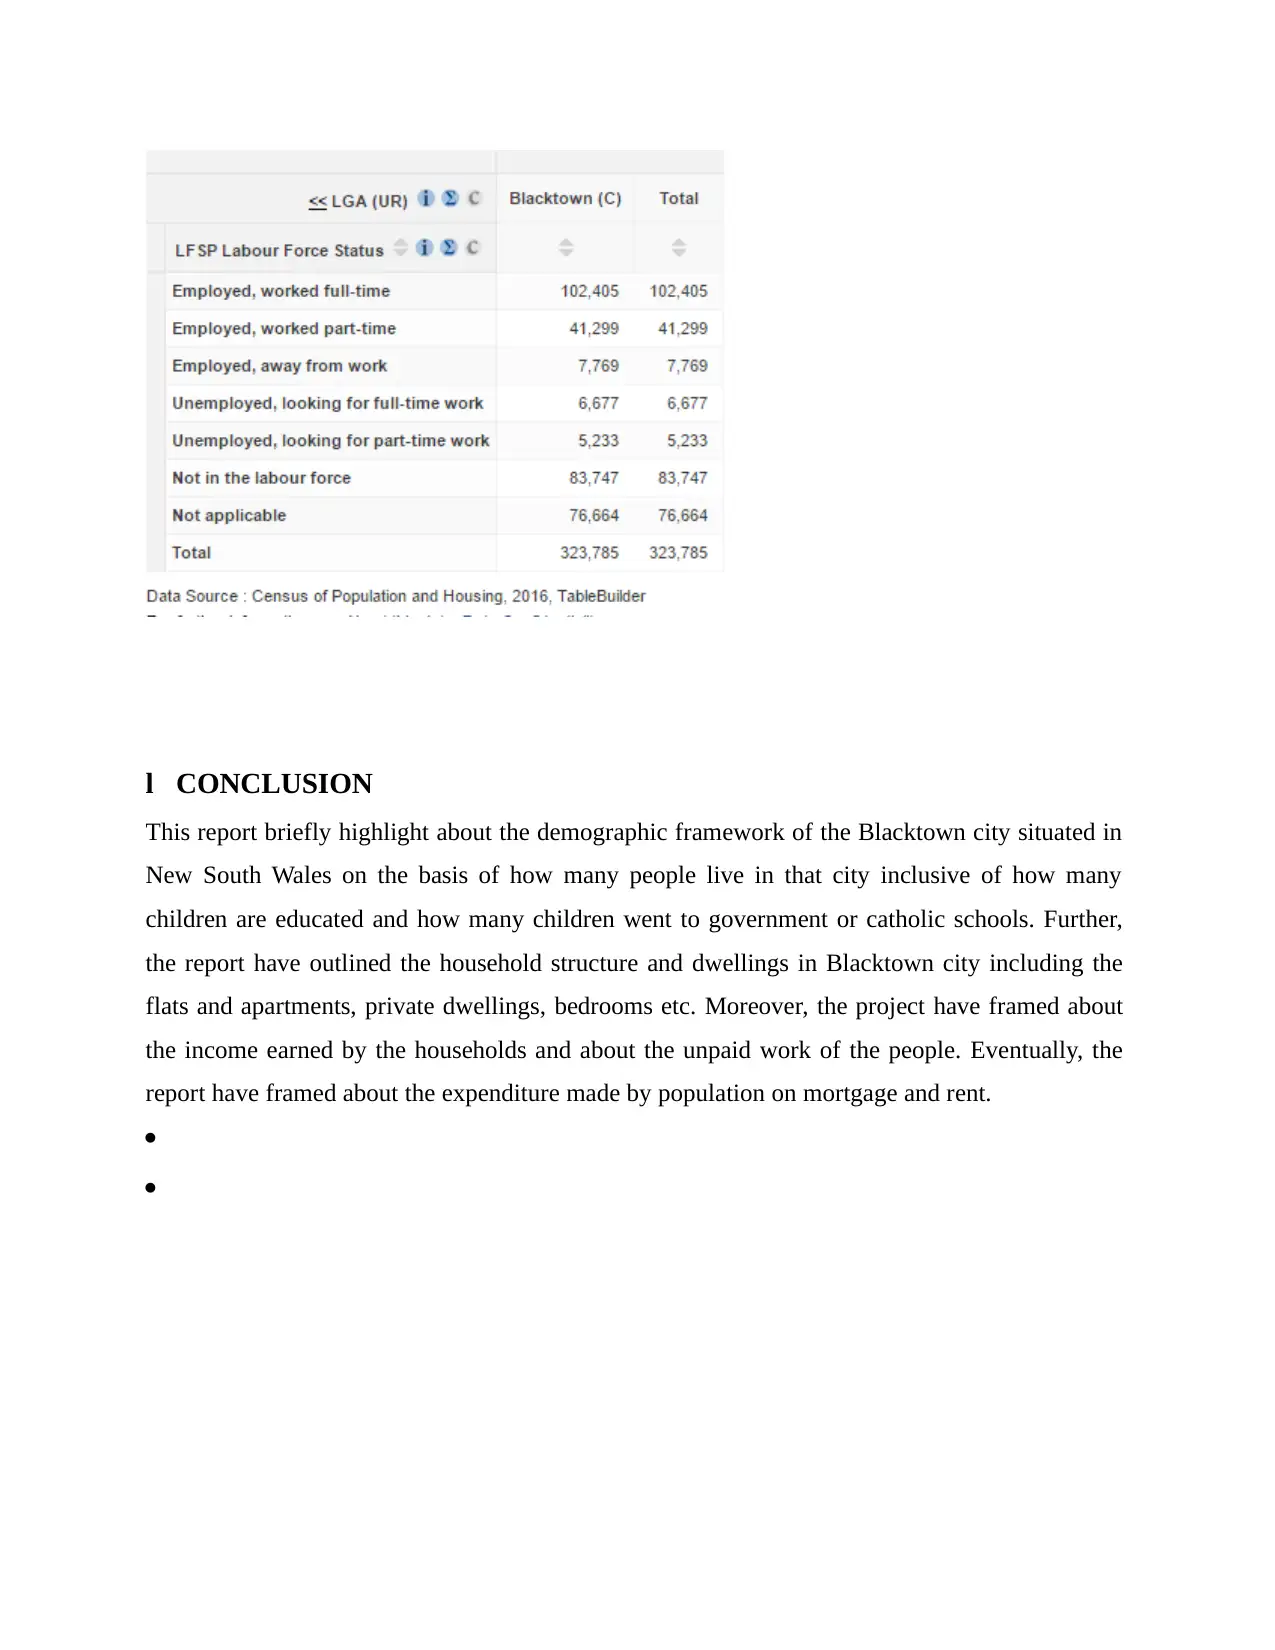
Moreover, the report depicts that the median mortgage repayments of the people which is
around 1500 or may be more. Further, it represents that there are people who repay mortgage less
than 30% of their income i.e. 90% of mortgage whereas, it depicts that there are households who
repay mortgage greater than 30% of their income which means 8.5% of the mortgage.
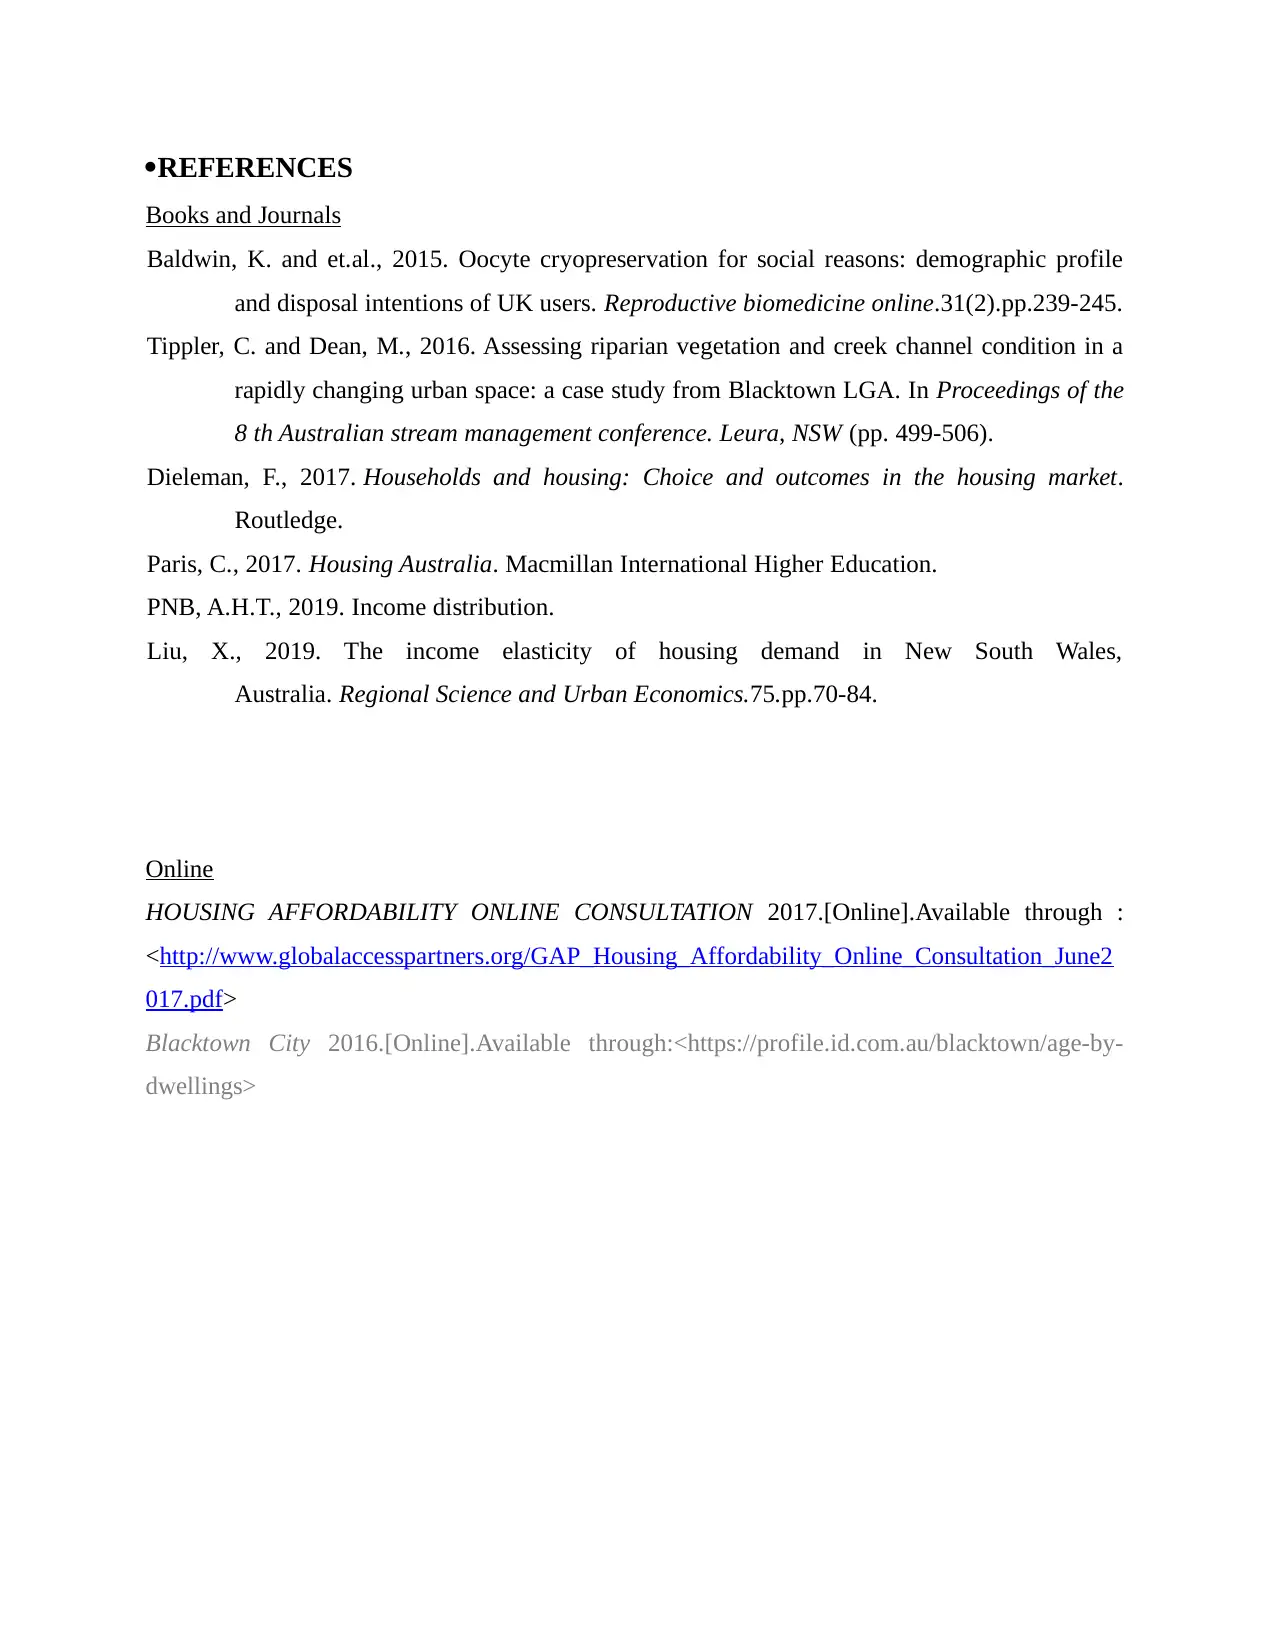
Employment status
earns a high income per week and there are around 13% of population who either earns very low
income or are unpaid.
l壱
l壱Expenditure On Mortgage And Rent
The census report of 2016 revealed the expenditure of households on mortgage and rent which
represents that there are people who have paid median rent of around 380.Further, the report
have disclosed that there are certain households who pay rent less than 30% of their income i.e.
85% of overall income whereas it depicts that there are people who pay rent equal to or more
than their 30% of the income which is 14% of overall income (Tippler and Dean,2016).
Moreover, the report depicts that the median mortgage repayments of the people which is
around 1500 or may be more. Further, it represents that there are people who repay mortgage less
than 30% of their income i.e. 90% of mortgage whereas, it depicts that there are households who
repay mortgage greater than 30% of their income which means 8.5% of the mortgage.
Employment status
Paraphrase This Document
Need a fresh take? Get an instant paraphrase of this document with our AI Paraphraser
l壱CONCLUSION
This report briefly highlight about the demographic framework of the Blacktown city situated in
New South Wales on the basis of how many people live in that city inclusive of how many
children are educated and how many children went to government or catholic schools. Further,
the report have outlined the household structure and dwellings in Blacktown city including the
flats and apartments, private dwellings, bedrooms etc. Moreover, the project have framed about
the income earned by the households and about the unpaid work of the people. Eventually, the
report have framed about the expenditure made by population on mortgage and rent.
·
·
·REFERENCES
Books and Journals
Baldwin, K. and et.al., 2015. Oocyte cryopreservation for social reasons: demographic profile
and disposal intentions of UK users. Reproductive biomedicine online.31(2).pp.239-245.
Tippler, C. and Dean, M., 2016. Assessing riparian vegetation and creek channel condition in a
rapidly changing urban space: a case study from Blacktown LGA. In Proceedings of the
8 th Australian stream management conference. Leura, NSW (pp. 499-506).
Dieleman, F., 2017. Households and housing: Choice and outcomes in the housing market.
Routledge.
Paris, C., 2017. Housing Australia. Macmillan International Higher Education.
PNB, A.H.T., 2019. Income distribution.
Liu, X., 2019. The income elasticity of housing demand in New South Wales,
Australia. Regional Science and Urban Economics.75.pp.70-84.
Online
HOUSING AFFORDABILITY ONLINE CONSULTATION 2017.[Online].Available through :
<http://www.globalaccesspartners.org/GAP_Housing_Affordability_Online_Consultation_June2
017.pdf>
Blacktown City 2016.[Online].Available through:<https://profile.id.com.au/blacktown/age-by-
dwellings>
⊘ This is a preview!⊘
Do you want full access?
Subscribe today to unlock all pages.
Trusted by 1+ million students worldwide
1 out of 12
Related Documents


Your All-in-One AI-Powered Toolkit for Academic Success.
+13062052269
info@desklib.com
Available 24*7 on WhatsApp / Email
![[object Object]](/_next/static/media/star-bottom.7253800d.svg)
Unlock your academic potential
Copyright © 2020–2026 A2Z Services. All Rights Reserved. Developed and managed by ZUCOL.