Business Analysis: BLITZ Department Store Customer Data Report

Verified

Added on  2020/03/01

|8
|585
|68
Report
AI Summary
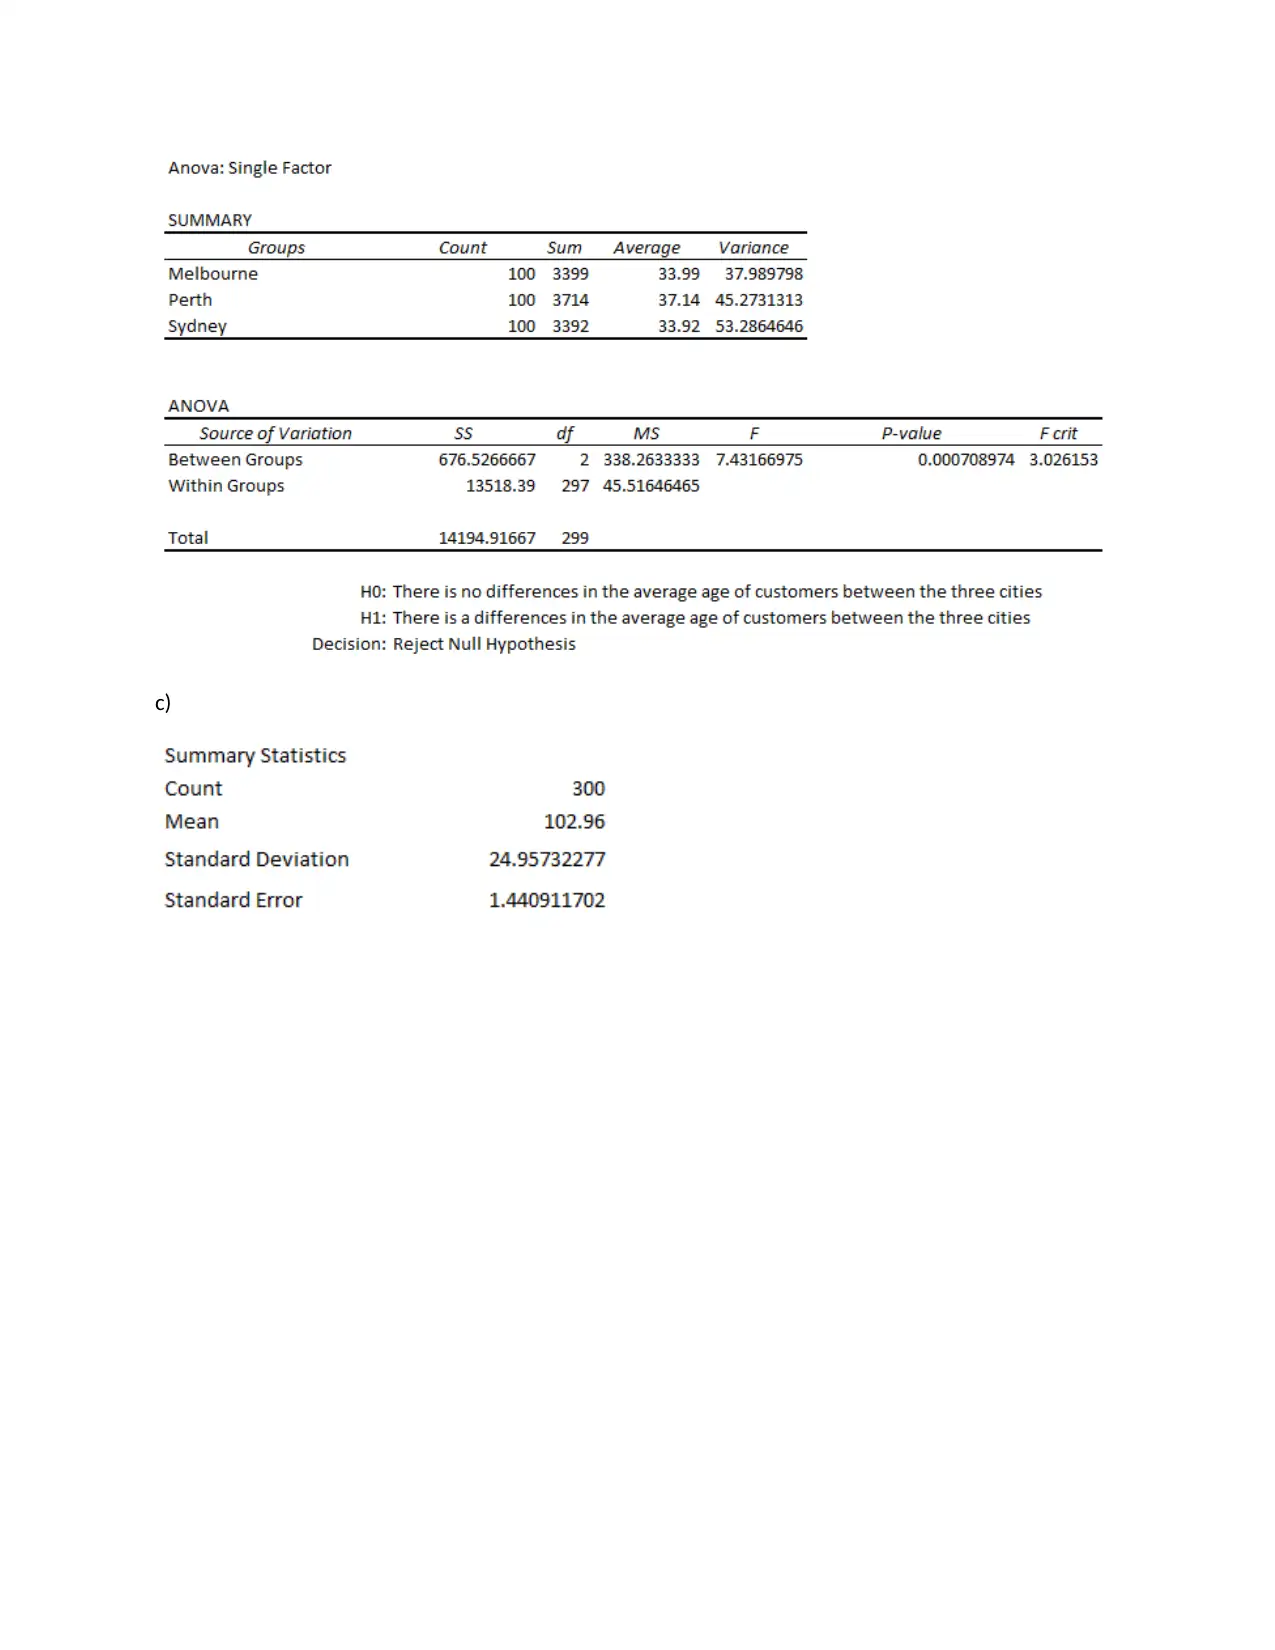
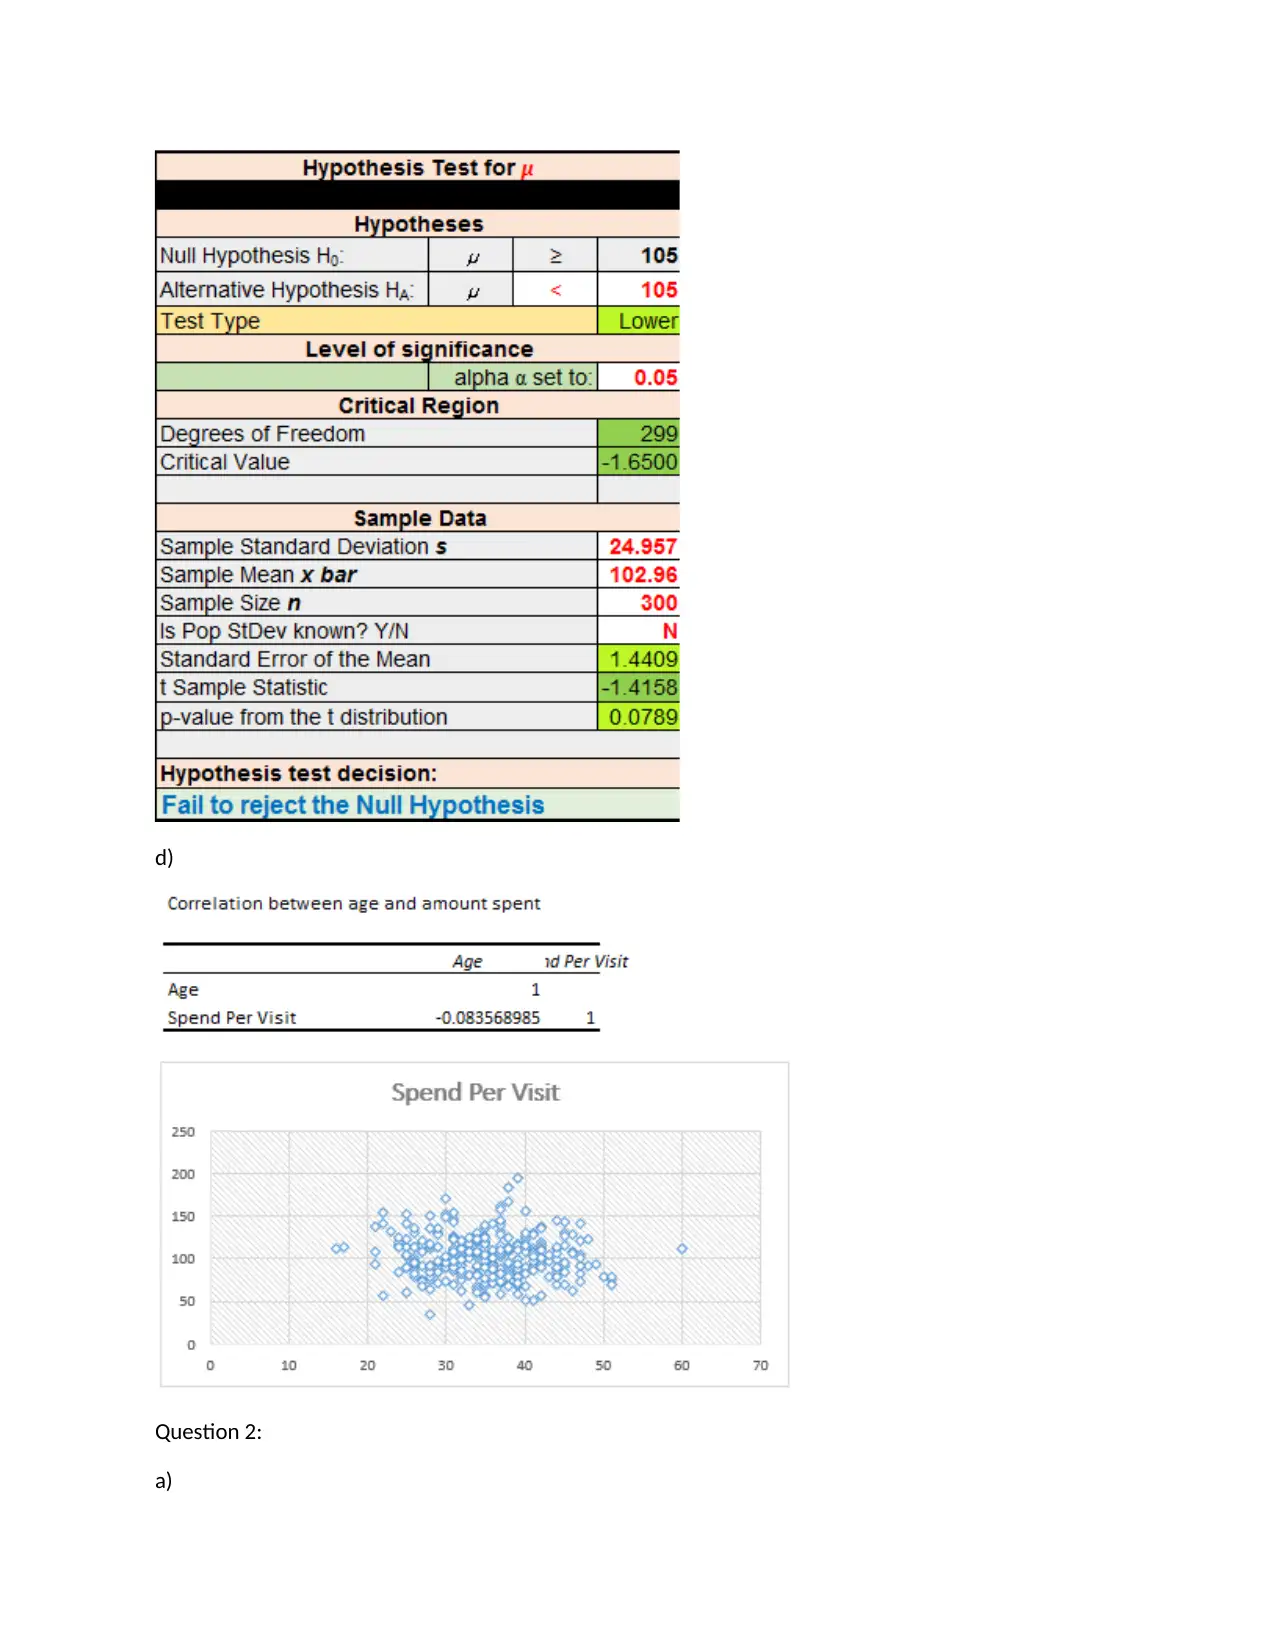
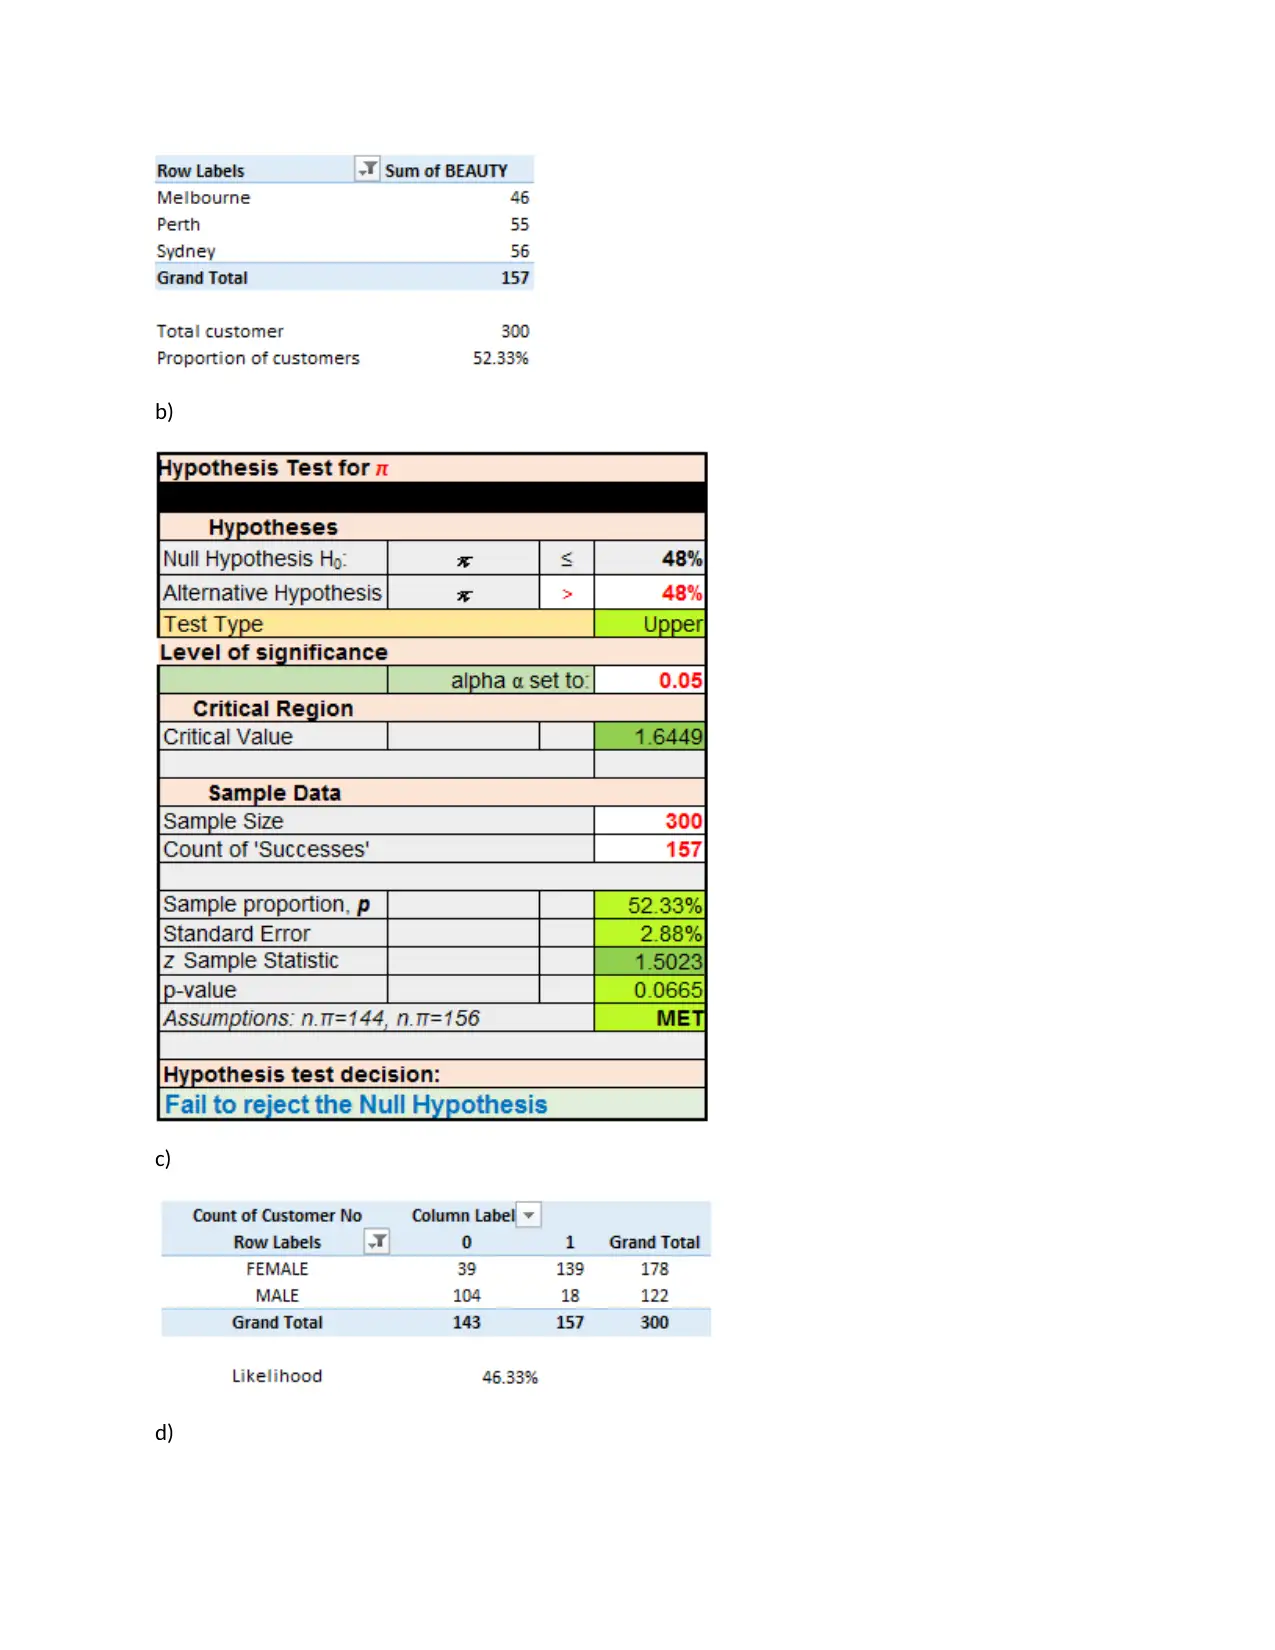
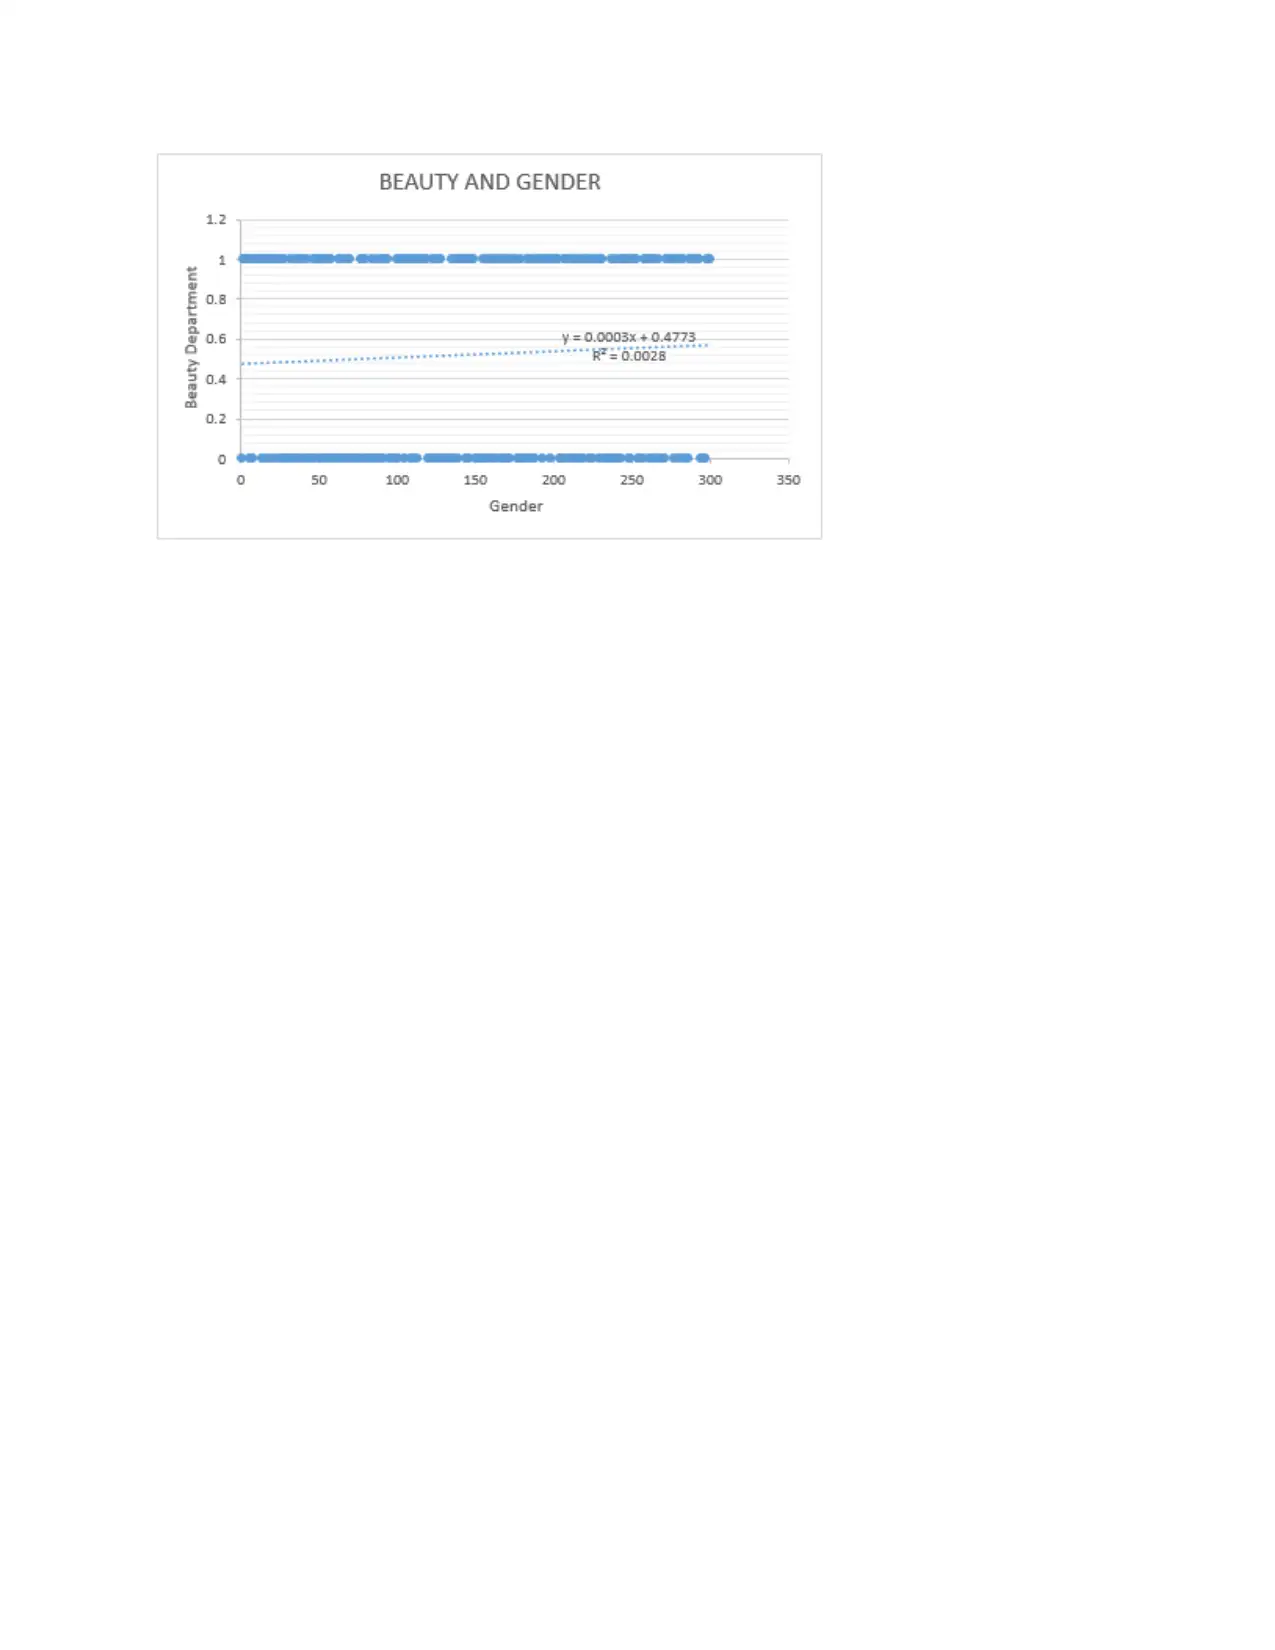
This report analyzes customer data from BLITZ department stores, focusing on a survey of 300 customers across three major Australian cities. The analysis includes the average age of customers, differences in age distribution across cities, and the average amount spent per visit. Statistical tests, such as ANOVA and hypothesis tests, are used to determine significant differences and relationships. Furthermore, the report investigates the proportion of customers who shop in the beauty section, comparing this across the three cities. The analysis also explores the relationship between gender and shopping behavior in the beauty section using cross-tabulation and scatter plots. The report provides key insights into customer demographics, spending habits, and shopping preferences, offering valuable information for business decision-making.
Document Page
Business Analytics – MIS171
Name of the Student
Name of the University
tabler-icon-diamond-filled.svg

Paraphrase This Document

Need a fresh take? Get an instant paraphrase of this document with our AI Paraphraser
Document Page
To: Jacinta Liu
From: Alex Cassidy
Subject: Analysis of the BLITZ Department store data
Dear Jacinta,
I have provided answers to the questions which was raised by you regarding the recent survey
conducted on the 300 customers in three major cities of Australia.
1)
a. Overall summary of the customer’s age
The average age of 300 customer is 35.02 years.
The highest age can be identified as 60 years while the lowest age is recorded as 16 years,
therefore the range is approximately 44 years.
Hence, there is a vast difference between the highest age and the lowest age.
Customers with an age of 35 have a high regularity.
b. The average age of customer in Melbourne city is 33.99 years; average age of customer in Perth is
37.14 years and average age of customer in Sydney is 33.92 years. The ANOVA test has shown that p
value was less than 0.05. Therefore, null hypothesis was rejected, that is, there is a differences exists
in the average age of customers between the three cities.
c. The average amount spent per visit by the customer is $102.96 with a standard deviation of
$24.96. The hypothesis test for mean has shown that p value was greater than 0.05. Therefore, null
hypothesis was accepted, that is, the average amount spent per visit by all customers is not less
than $105.
d. The amount of money spent per visit was not influenced by the age of the customer. Here there
was a slight negative association existed as the r^2 value was -0.0836.
2)
a. There was 46 customers who shop in the beauty section in Melbourne. Similarly, 55 customers
were from Perth and 56 customers were from Sydney customers who shop in the beauty
section. Therefore, the proportions of customer customers who shop in the beauty section in
each of the three cities is 52.33%.
b. Here the proportions of customer customers who shop in the beauty section in each of the
three cities is 52.33%. The hypothesis test for proportion has shown that p value was greater
than 0.05. Therefore, null hypothesis was accepted, that is, the proportion who do shop in the
beauty sections of all of our stores, could now be less than 48%.
c. The cross table has shown that there was 139 female customers who shop in the beauty section
in each of the three cities. Therefore, the likelihood that they might shop in the beauty section
of our department store is 46.33%
Document Page
d. The scatter plot has shown that the r^ value between shopping in the beauty sections of
department stores and whether or not a person is male or female is 0.0028. Hence, no
relationship exists between shopping in the beauty sections of our department stores and
whether or not a person is male or female.
I believe that these responses will assist you with the comparison report of customers across three
cities in Australia.
Thank You,
With Best Regards,
Alex Cassidy
Document Page
Part 2:
Question 1:
a)
b)
tabler-icon-diamond-filled.svg

Paraphrase This Document

Need a fresh take? Get an instant paraphrase of this document with our AI Paraphraser
Document Page
c)
Document Page
d)
Question 2:
a)
Document Page
b)
c)
d)
tabler-icon-diamond-filled.svg

Paraphrase This Document

Need a fresh take? Get an instant paraphrase of this document with our AI Paraphraser
Document Page
chevron_up_icon
1 out of 8
circle_padding
hide_on_mobile
zoom_out_icon
[object Object]