Framingham Study: Investigating the Link Between Blood Pressure & Age

Verified

Added on  2023/06/04

|7
|986
|205
Report
AI Summary
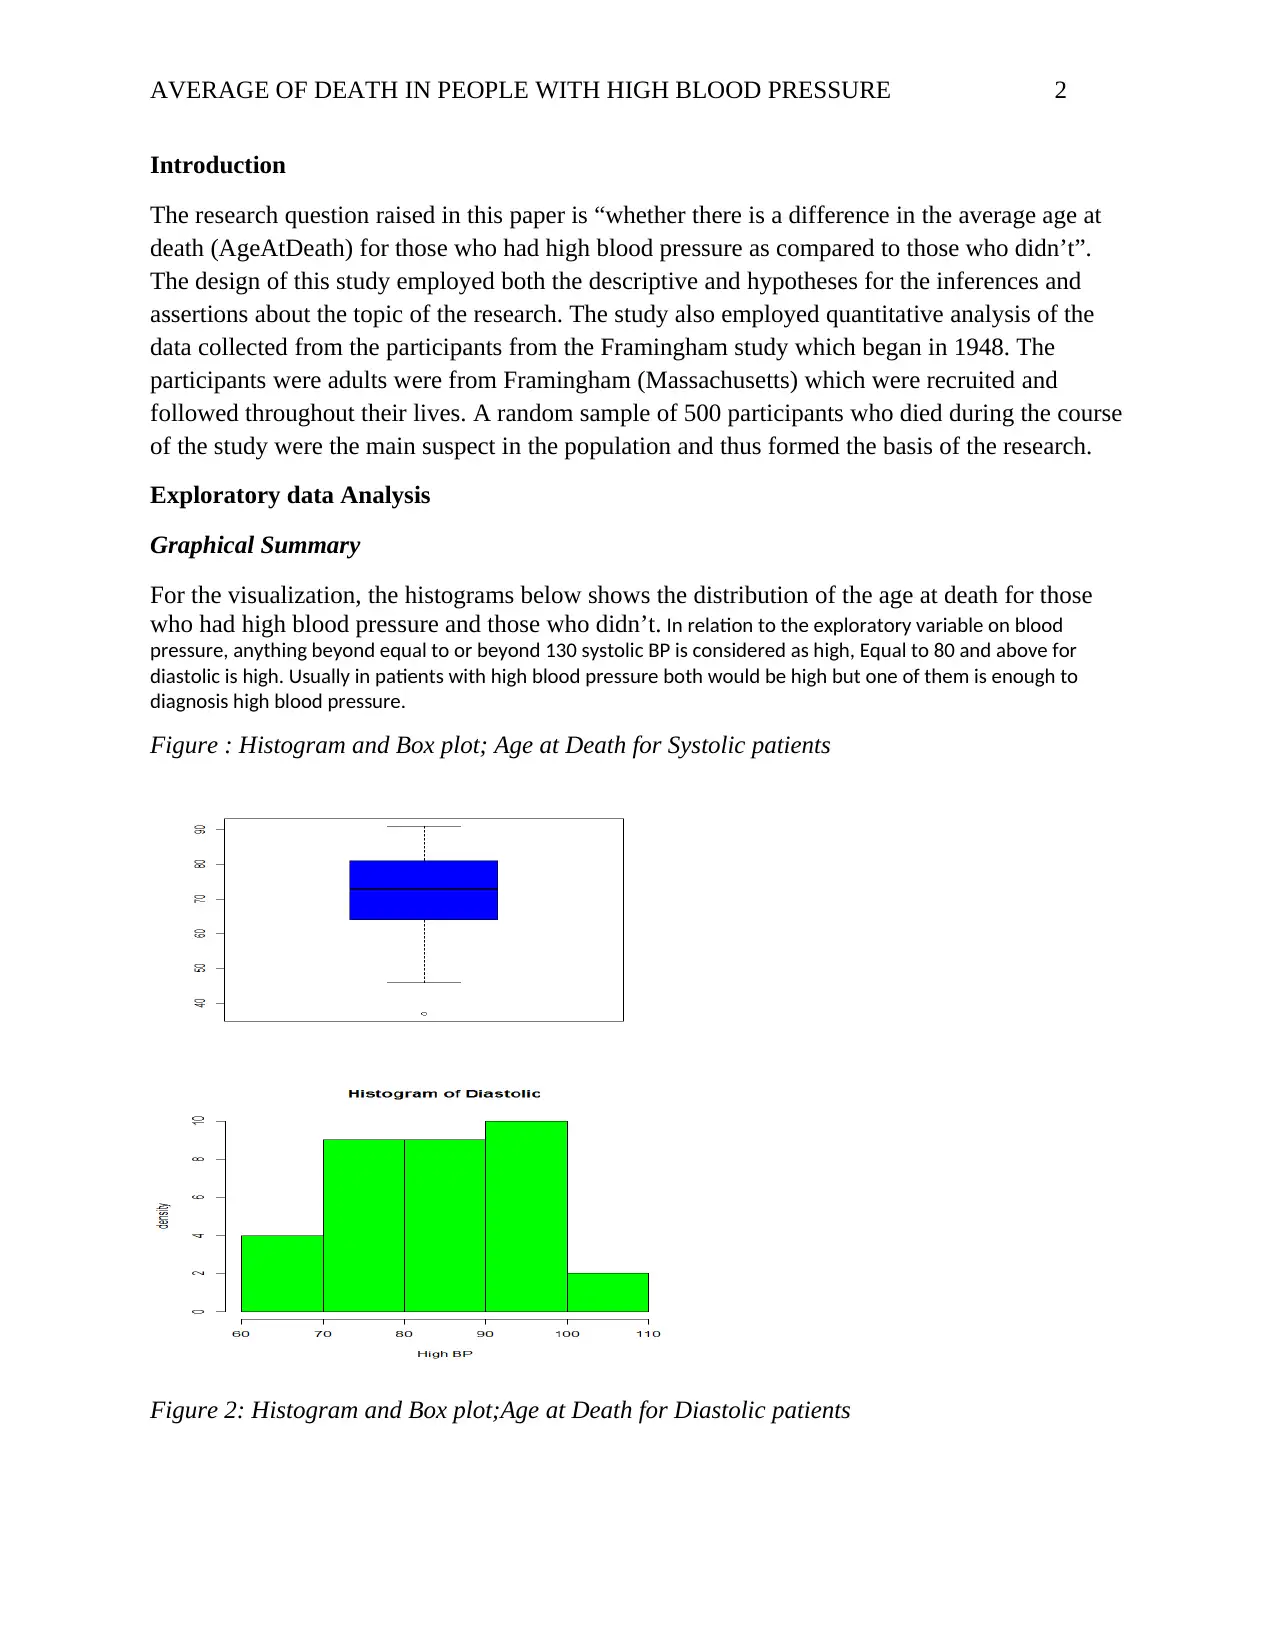
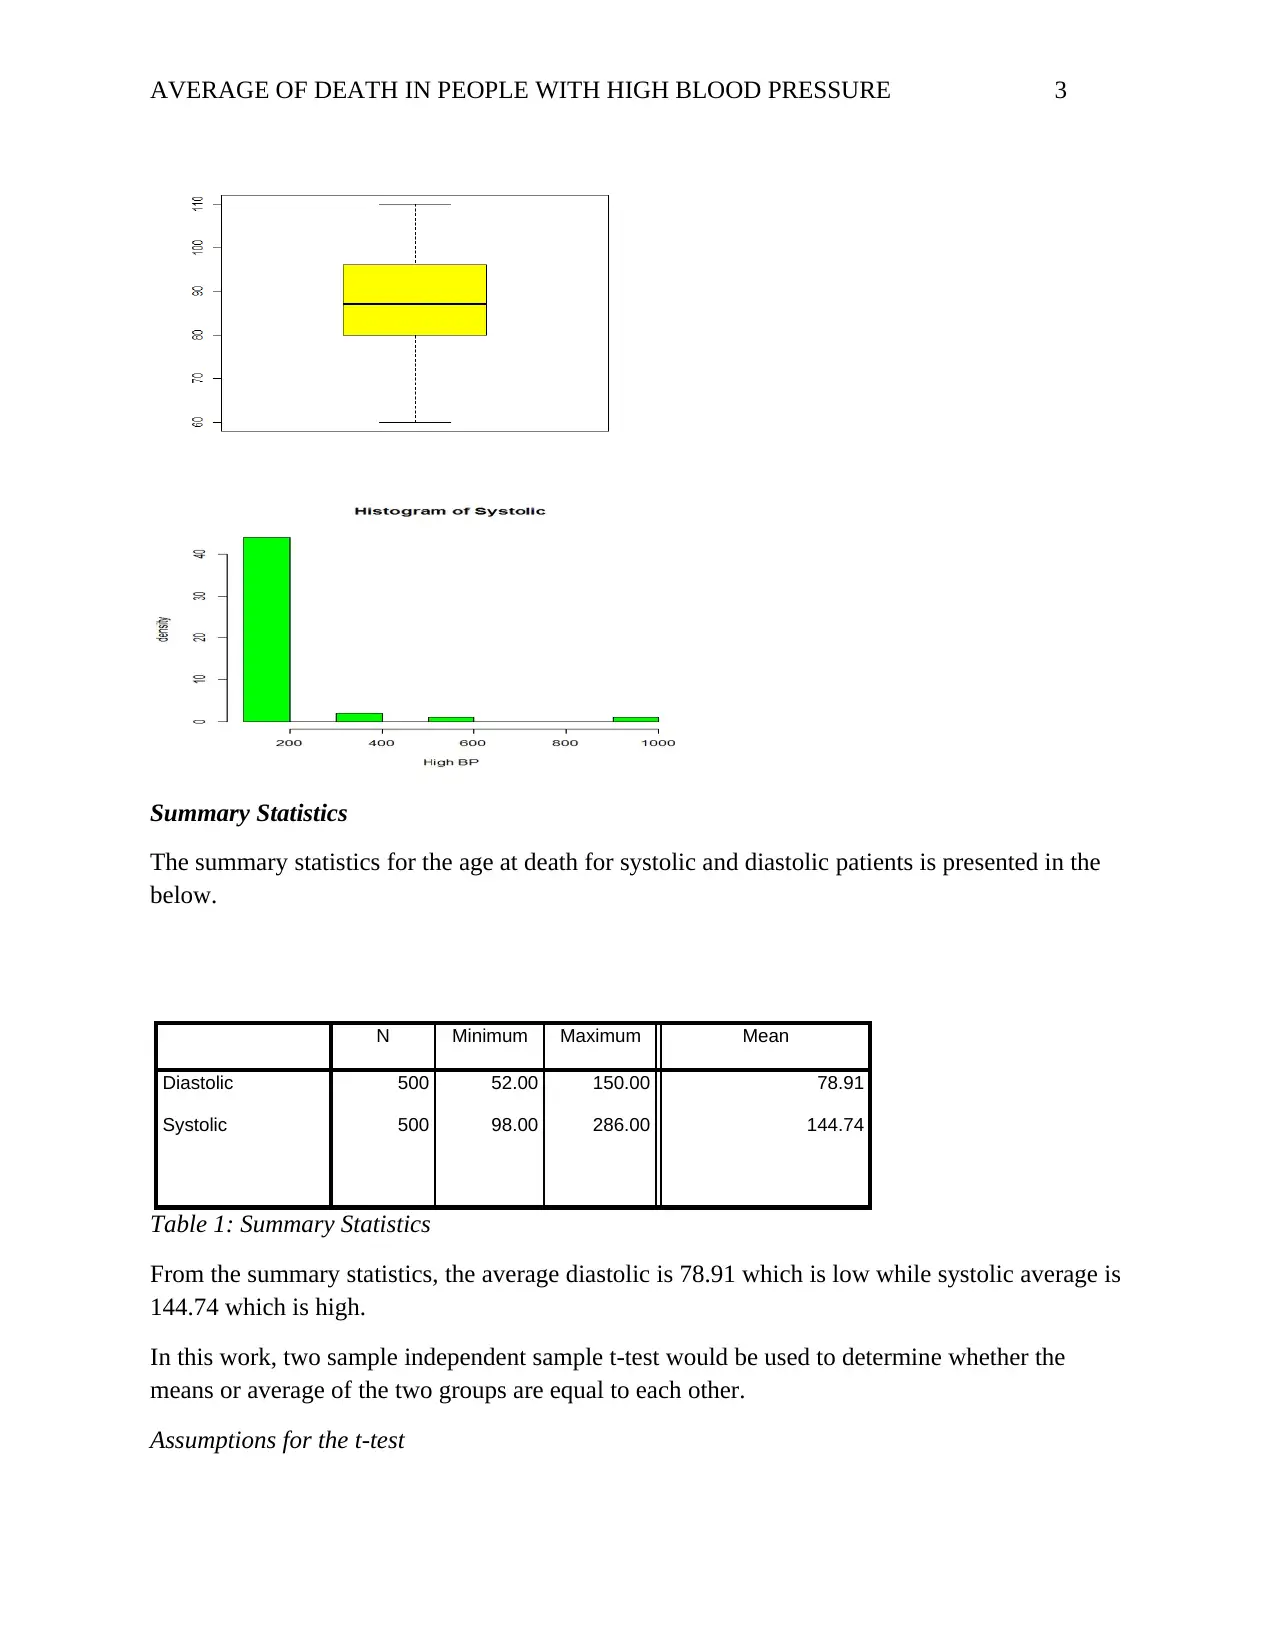
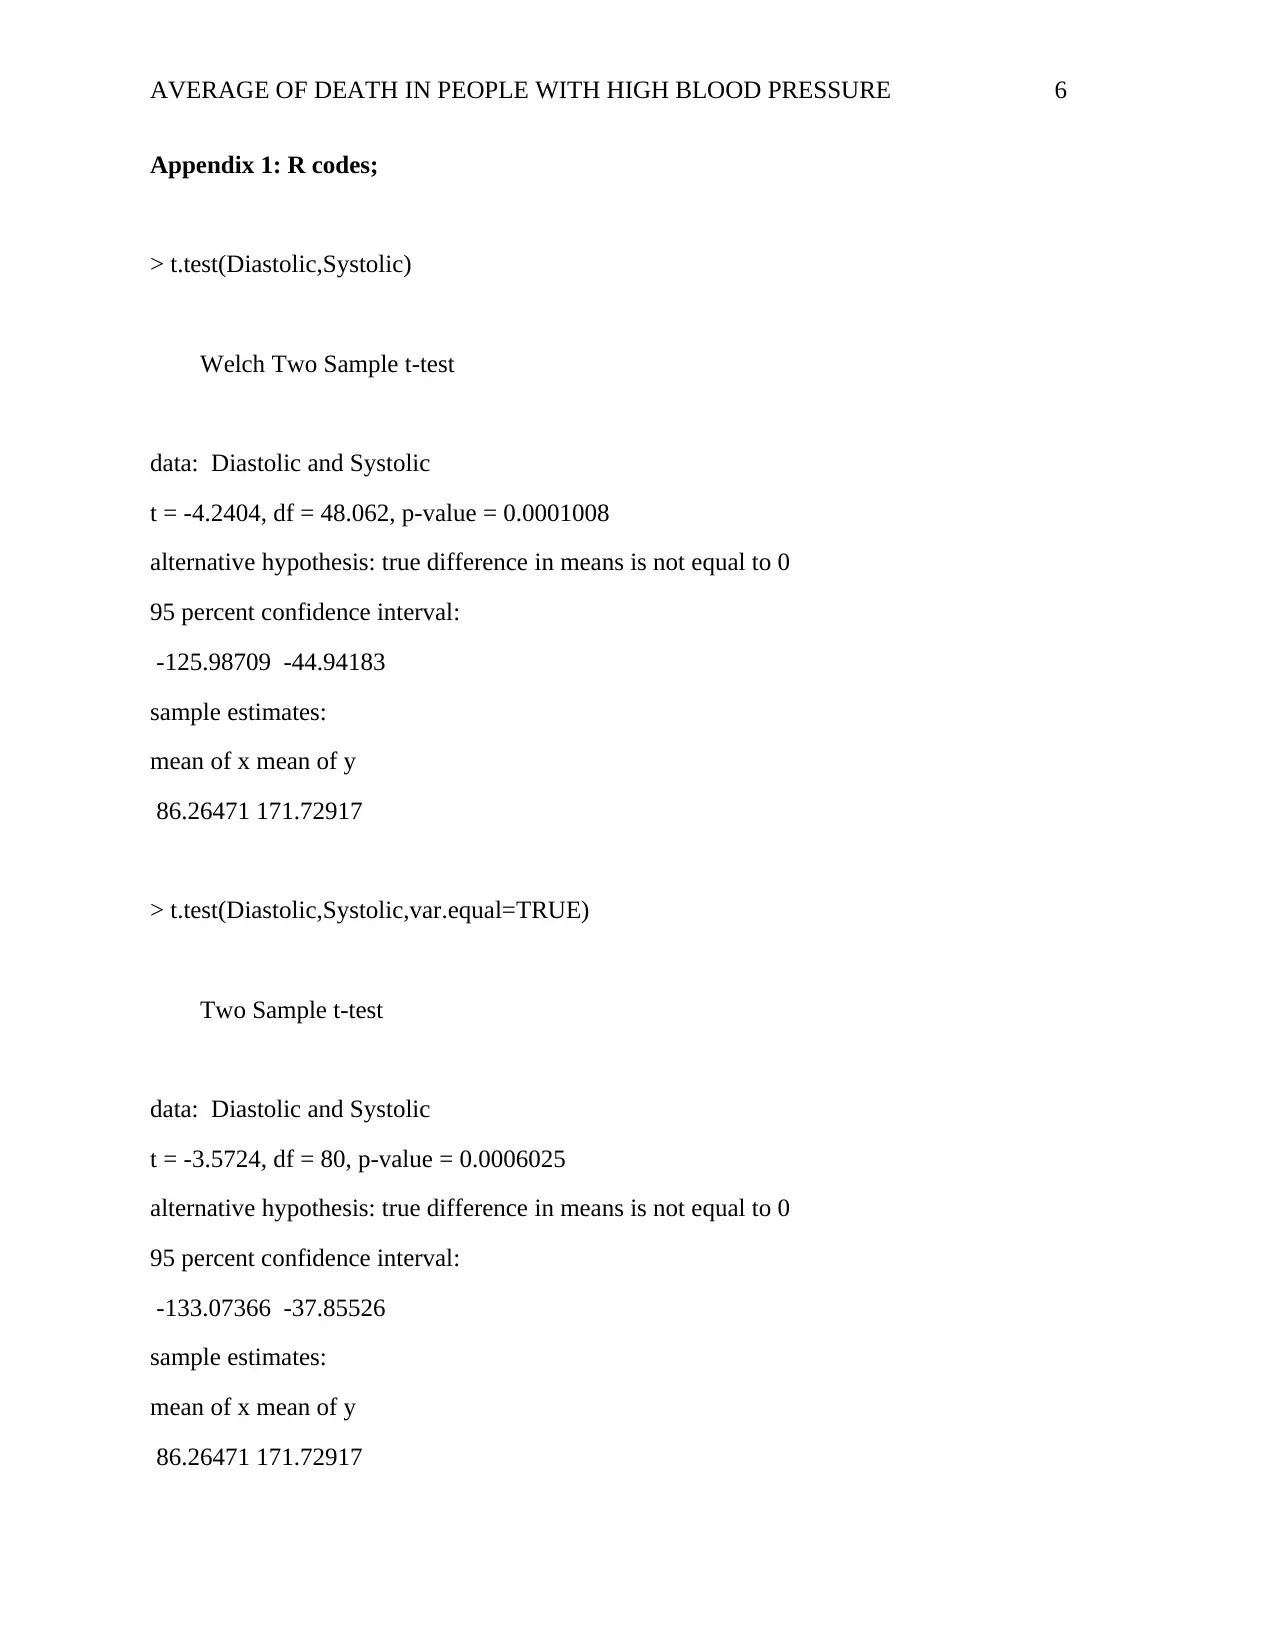
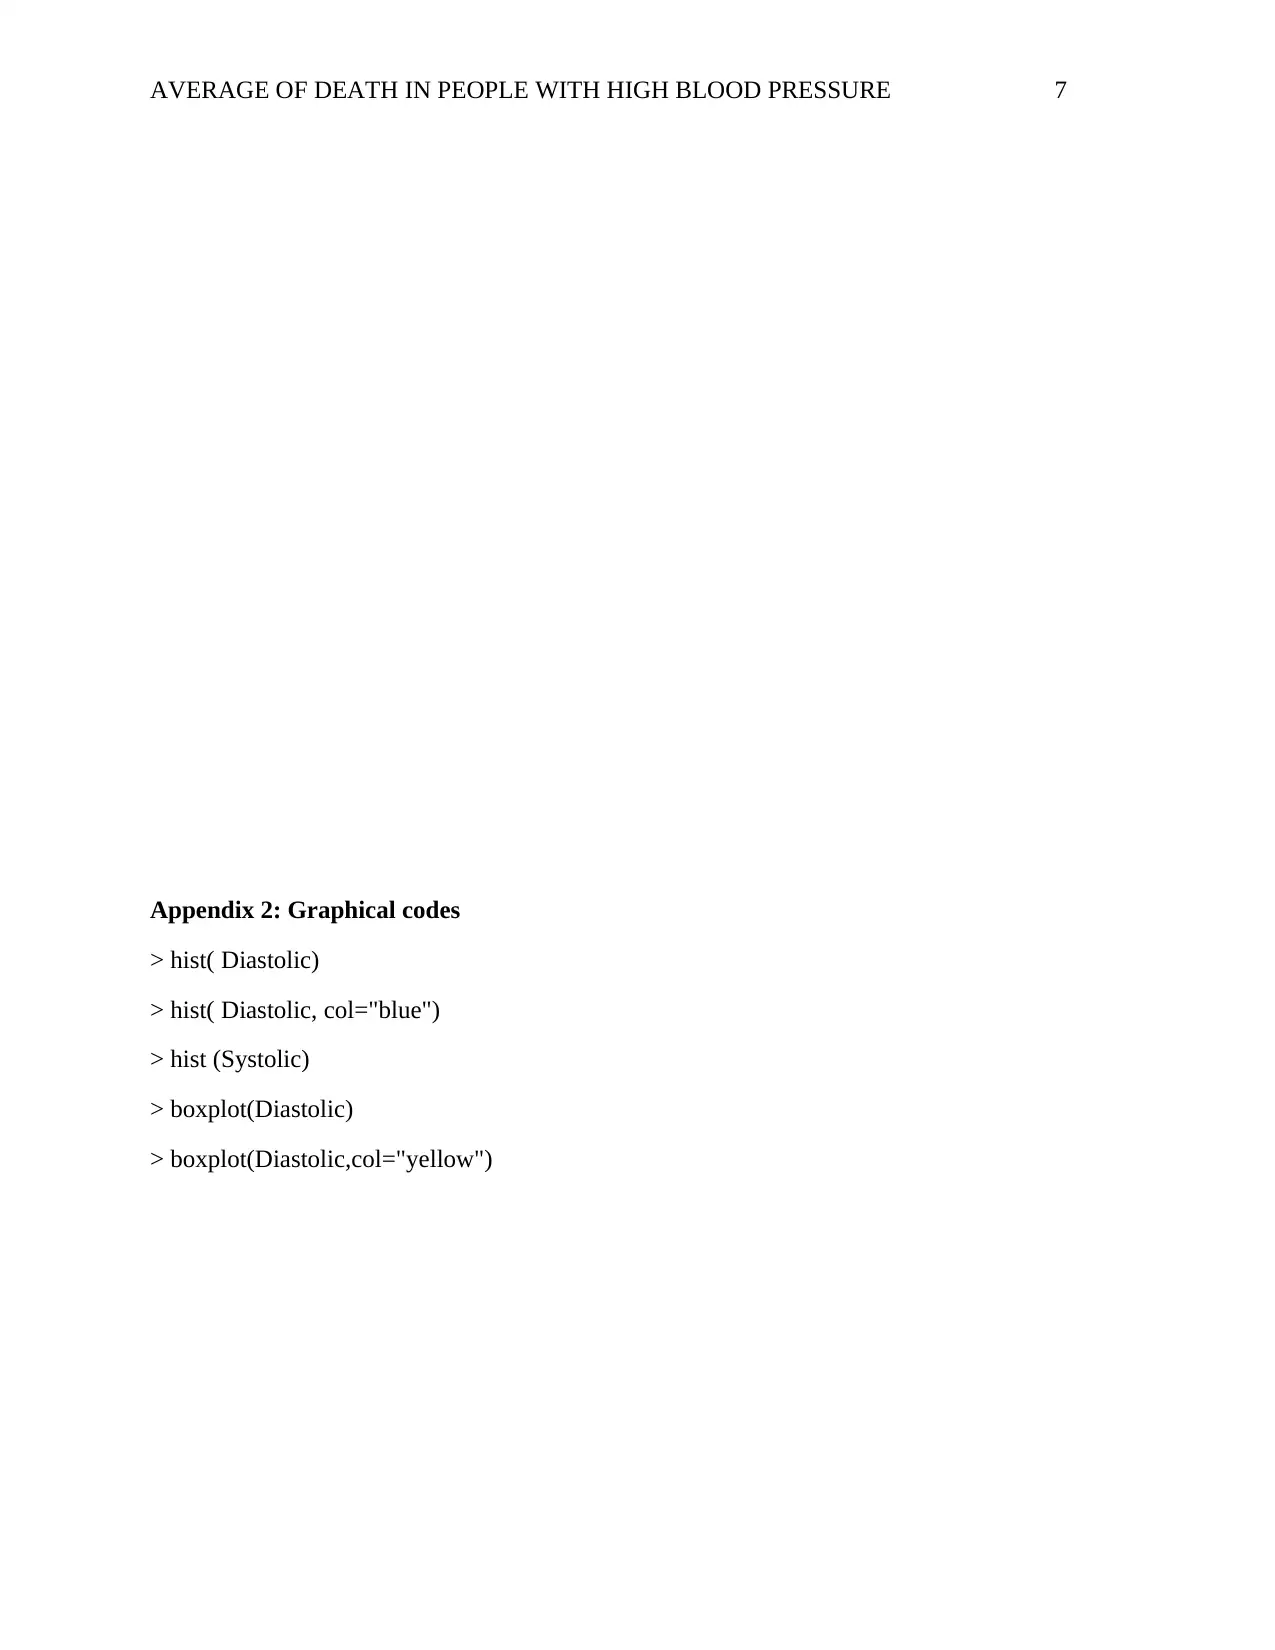
This report investigates the potential difference in the average age at death between individuals with and without high blood pressure, utilizing data from the Framingham study. The study employs both descriptive statistics and hypothesis testing, focusing on a random sample of 500 deceased participants. Exploratory data analysis, including histograms and box plots, visualizes the distribution of age at death for systolic and diastolic blood pressure levels. Summary statistics reveal the mean age at death for both groups, and a two-sample independent t-test is used to determine if the means are statistically different. The null hypothesis, stating no significant difference in average age at death, is tested against the alternative hypothesis. Based on the t-test results, the report concludes that there is no statistically significant difference in the average age at death between those with and without high blood pressure within the studied sample. However, it acknowledges the limitations of generalizing these findings to the entire US adult population due to the sample size.
Document Page
Running head: AVERAGE OF DEATH IN PEOPLE WITH HIGH BLOOD PRESSURE 1
Average of Death in People with High Blood Pressure
[Name of Student]
[Institutional Affiliation]
[Date of Submission]
tabler-icon-diamond-filled.svg

Paraphrase This Document

Need a fresh take? Get an instant paraphrase of this document with our AI Paraphraser
Document Page
AVERAGE OF DEATH IN PEOPLE WITH HIGH BLOOD PRESSURE 2
Introduction
The research question raised in this paper is “whether there is a difference in the average age at
death (AgeAtDeath) for those who had high blood pressure as compared to those who didn’t”.
The design of this study employed both the descriptive and hypotheses for the inferences and
assertions about the topic of the research. The study also employed quantitative analysis of the
data collected from the participants from the Framingham study which began in 1948. The
participants were adults were from Framingham (Massachusetts) which were recruited and
followed throughout their lives. A random sample of 500 participants who died during the course
of the study were the main suspect in the population and thus formed the basis of the research.
Exploratory data Analysis
Graphical Summary
For the visualization, the histograms below shows the distribution of the age at death for those
who had high blood pressure and those who didn’t. In relation to the exploratory variable on blood
pressure, anything beyond equal to or beyond 130 systolic BP is considered as high, Equal to 80 and above for
diastolic is high. Usually in patients with high blood pressure both would be high but one of them is enough to
diagnosis high blood pressure.
Figure : Histogram and Box plot; Age at Death for Systolic patients
Figure 2: Histogram and Box plot;Age at Death for Diastolic patients
Document Page
AVERAGE OF DEATH IN PEOPLE WITH HIGH BLOOD PRESSURE 3
Summary Statistics
The summary statistics for the age at death for systolic and diastolic patients is presented in the
below.
N Minimum Maximum Mean
Diastolic 500 52.00 150.00 78.91
Systolic 500 98.00 286.00 144.74
Table 1: Summary Statistics
From the summary statistics, the average diastolic is 78.91 which is low while systolic average is
144.74 which is high.
In this work, two sample independent sample t-test would be used to determine whether the
means or average of the two groups are equal to each other.
Assumptions for the t-test
Document Page
AVERAGE OF DEATH IN PEOPLE WITH HIGH BLOOD PRESSURE 4
The first assumption which need to be confirmed is randomization and from the case given, the
data is from random sample of 500 participants.
Secondly, the assumption is that both the two groups are samples from the normal distributions
with equal variances.
Inference
Here, hypothesis testing was done to determine whether there is difference in the average age at
death (AgeAtDeath) for those who had high blood pressure (Systolic BP≥ 140 or diastolic BP≥
90) as compared to those who did not have.
Hypothesis testing
The null and alternative hypotheses for this study can be formulated and stated as follows;
H0: There is no significant difference in the average age at death for those who had high blood
pressure as compared to those who did not have high blood pressure.
H1: There is significant difference in the average age at death for those who had high blood
pressure as compared to those who did not have high blood pressure.
The p-value is α = 0.05
The 95% confidence interval for this work is (140≤BP≤90).
By using alpha α=0.05, we test the hypothesis in r using the commands below in the appendix.
The output is in the appendix 1 of this work.
Therefore 0.000625≤0.05 hence we reject the null hypothesis and conclude that there is no
significant difference in the average age at death for those who had high blood pressure as
compared to those who did not have.
Conclusion
Based on the t-test, there is no significant difference in means between the systolic and diastolic
patients since the obtained p values are less than 0.05; for this reason, we reject the null
hypothesis. We can therefore conclude that there is no significant difference in the average age at
death for those who had high blood pressure as compared to those who did not have. Given that
this sample (500 participants), the results above cannot apply to United States adults population
since the sample size is relative smaller. The entire US population will need a reference of more
than 5000 participants for reliable and better results for inference.
tabler-icon-diamond-filled.svg

Paraphrase This Document

Need a fresh take? Get an instant paraphrase of this document with our AI Paraphraser
Document Page
AVERAGE OF DEATH IN PEOPLE WITH HIGH BLOOD PRESSURE 5
Document Page
AVERAGE OF DEATH IN PEOPLE WITH HIGH BLOOD PRESSURE 6
Appendix 1: R codes;
> t.test(Diastolic,Systolic)
Welch Two Sample t-test
data: Diastolic and Systolic
t = -4.2404, df = 48.062, p-value = 0.0001008
alternative hypothesis: true difference in means is not equal to 0
95 percent confidence interval:
-125.98709 -44.94183
sample estimates:
mean of x mean of y
86.26471 171.72917
> t.test(Diastolic,Systolic,var.equal=TRUE)
Two Sample t-test
data: Diastolic and Systolic
t = -3.5724, df = 80, p-value = 0.0006025
alternative hypothesis: true difference in means is not equal to 0
95 percent confidence interval:
-133.07366 -37.85526
sample estimates:
mean of x mean of y
86.26471 171.72917
Document Page
AVERAGE OF DEATH IN PEOPLE WITH HIGH BLOOD PRESSURE 7
Appendix 2: Graphical codes
> hist( Diastolic)
> hist( Diastolic, col="blue")
> hist (Systolic)
> boxplot(Diastolic)
> boxplot(Diastolic,col="yellow")
chevron_up_icon
1 out of 7
circle_padding
hide_on_mobile
zoom_out_icon
[object Object]