Analysis of Posture Effect on Arterial Blood Pressure
VerifiedAdded on 2023/04/23
|7
|1332
|57
Practical Assignment
AI Summary
This practical assignment details an experiment conducted to determine the effect of posture on arterial blood pressure. The introduction provides a background on blood pressure, cardiac output, and the factors influencing blood flow. The methodology section outlines the apparatus used (sphygmomanometer, chair, stethoscope, table), the procedure followed (recording subject data, identifying brachial artery, taking blood pressure readings in multiple trials), and data analysis techniques. The results section presents the recorded blood pressure readings (systolic and diastolic) and the analysis of the data. The conclusion summarizes the findings, including the impact of exercise and recovery time on blood pressure and pulse pressure. The assignment references several scientific publications related to blood pressure and cardiovascular physiology.

Blood Pressure
First name, Last name
Institution
First name, Last name
Institution
Paraphrase This Document
Need a fresh take? Get an instant paraphrase of this document with our AI Paraphraser

Introduction
Hydrostatic pressure of blood (fluid) helps in producing the blood flow pressure against the
blood vessels walls (Funamoto, Nam, Kimura et al, 2010). In general for a flow of fluid to be
initiated then it must move from the area where the hydrostatic pressure will be higher to area
where there is a low hydrostatic pressure. In arteries, the area where we expect to have a higher
hydrostatic pressure is the area near the heart, therefore blood will be pumped by the heart and
will flow through the arteries but this will slowed by narrow arterioles openings. During systole,
the walls of the arteries stretch when new blood is allowed to enter the arteries (Levy, Ehret et al,
2009); therefore the stretch helps in accommodating the pressure that is increased by extra blood.
During diastole (Conen, Tedrow et al, 2009, the walls of the arteries return back normal positions
this is due to elastic properties they hold. The blood pressure reading for both systole phase and
diastole phase is shown in figure 1 below. For example if a blood pressure reading is recorded as
130/50 will indicate that during systole the reading will be 130 mm Hg, while during diastole the
reading will be 50 mm Hg. In process of cardiac cycle the arterioles blood is emptied at a
constant flow rate. The blood flow resistance experienced during the cardiac cycle is called
peripheral resistance.

Figure 1: The relationship between blood pressure to blood velocity through the arterioles and
arteries (Brothers, Bhella et al, 2009.
The volume of blood that is pumped at one minute by the heart is called cardiac output (Mayer
and Suttner, 2009). Its calculation entails a multiplication of the number of contraction of heart
which occurs per minute by the stroke volume, which is the pumped blood volume per left
ventricle contraction into the aorta. Therefore an increase in heart rate will increase the cardiac
output; this can be experienced majorly during exercise activities. Furthermore an increase in
stroke volume will similarly increase the cardiac output, this will be experienced when their will
be a greater contraction of the heart with a higher strength. In order to increase the stroke volume
then the speed of the blood circulation must also be increased throughout the body as more blood
will be allowed to enter the heart as it contracts and expands. The blood vessels will relax during
high exertion and in the process it will increase its diameter, moderating the heart rate and
ensures that the muscles are supplied with adequate oxygenated blood. The blood vessels
diameter can be decreased by stress and in the process increasing the blood pressure. The high
blood pressure can also be resulted from signals of nerves, hormones, lying down and also
standing.
Objectives
To determine the posture effect on arterial blood pressure
⊘ This is a preview!⊘
Do you want full access?
Subscribe today to unlock all pages.

Trusted by 1+ million students worldwide

Methodology
Apparatus
1. Sphygmomanometer, which consists of cuff that is an inflatable bag, inflated bulb,
manometer where the pressure of blood is read and a valve which is mainly used for
deflation.
2. Chair
3. Stethoscope
4. Table
Procedure
1. The age of the subject, the subject’s stature, the subject’s body mass and the subject’s sex
were recorded.
2. The left brachial artery by palpation was identified.
3. The sphygmomanometer cuff was positioned on the left arm of the subject on the table
while the subject was seating on the chair.
4. The sphygmomanometer cuff was inflated to approximate suitable value between 170
mm Hg to 180 mm Hg.
5. The stethoscope was positioned over the brachial artery.
6. The sphygmomanometer cuff was deflated until the tapping rhythm sounds could be
heard and the mercury column reading was recorded, the reading recorded is known as
systolic pressure
7. The process of deflation of sphygmomanometer cuff was continued until the sounds
disappeared. The reading recorded at this point was known as diastolic pressure.
8. The procedure was repeated for 2 more trials.
9. The results on the table below was then completed
Paraphrase This Document
Need a fresh take? Get an instant paraphrase of this document with our AI Paraphraser

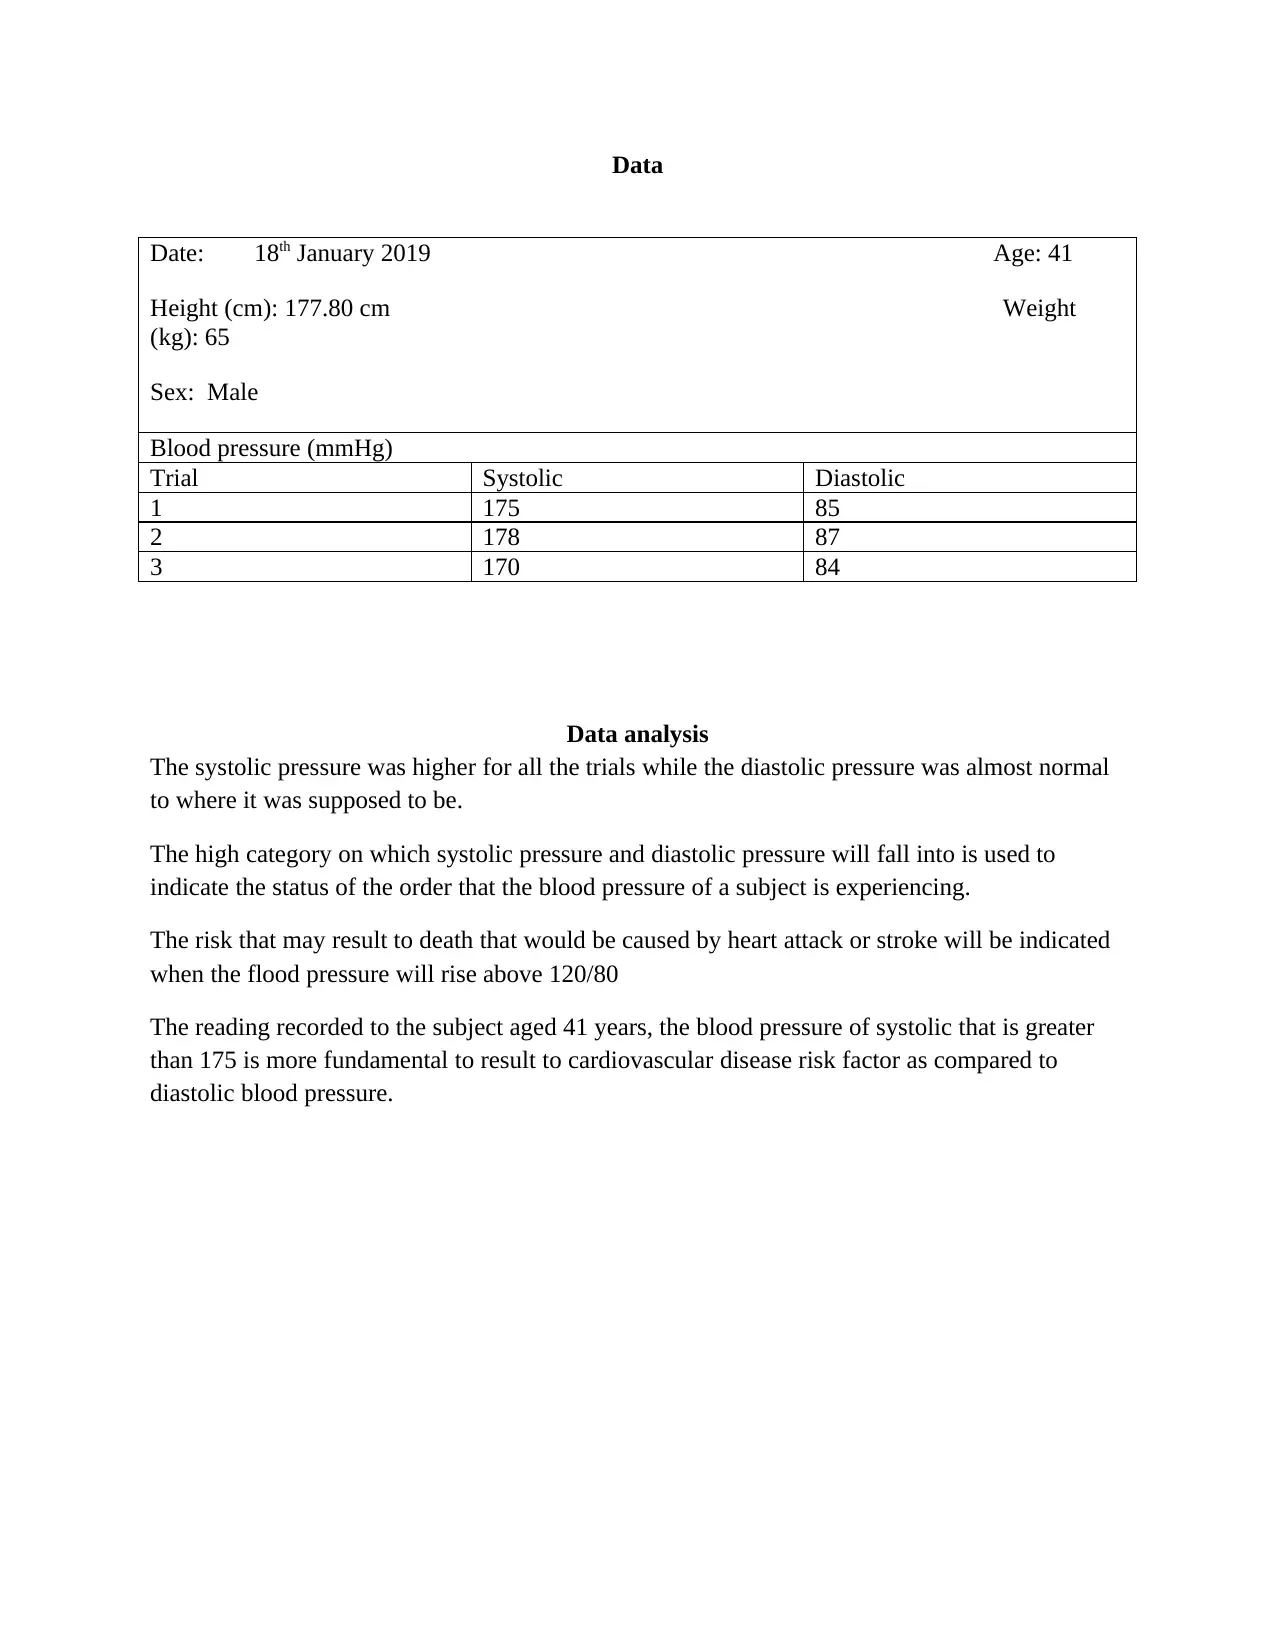
Data
Date: 18th January 2019 Age: 41
Height (cm): 177.80 cm Weight
(kg): 65
Sex: Male
Blood pressure (mmHg)
Trial Systolic Diastolic
1 175 85
2 178 87
3 170 84
Data analysis
The systolic pressure was higher for all the trials while the diastolic pressure was almost normal
to where it was supposed to be.
The high category on which systolic pressure and diastolic pressure will fall into is used to
indicate the status of the order that the blood pressure of a subject is experiencing.
The risk that may result to death that would be caused by heart attack or stroke will be indicated
when the flood pressure will rise above 120/80
The reading recorded to the subject aged 41 years, the blood pressure of systolic that is greater
than 175 is more fundamental to result to cardiovascular disease risk factor as compared to
diastolic blood pressure.

Conclusion
The diastolic and systolic increased when the subject involved himself in an exercise together
with the pulse rate. The normal status of blood pressure for diastolic and systolic will be resulted
when the subject is subjected to a recovery time.
The pulse pressure that is resulted from the different between systolic pressure and diastolic
pressure was less when the subject person was not involved in exercise than when the person
involved in an exercise. During this process the left ventricle will ejects blood and these results
to aorta pressure. The changes are caused by the ventricle stroke volume.
The maximum heart rate is normally experienced when one involves in a rigorous exercise,
where the heart rate will increase the supply of oxygenated blood throughout the body. The
recovery time was noted to be faster since the subject person mainly involves in doing exercise.
⊘ This is a preview!⊘
Do you want full access?
Subscribe today to unlock all pages.

Trusted by 1+ million students worldwide

References
Brothers, R.M., Bhella, P.S., Shibata, S., Wingo, J.E., Levine, B.D. and Crandall, C.G., 2009.
Cardiac systolic and diastolic function during whole body heat stress. American Journal of
Physiology-Heart and Circulatory Physiology, 296(4), pp.H1150-H1156.
Conen, D., Tedrow, U.B., Koplan, B.A., Glynn, R.J., Buring, J.E. and Albert, C.M., 2009.
Influence of systolic and diastolic blood pressure on the risk of incident atrial fibrillation in
women. Circulation, 119(16), pp.2146-2152.
Levy, D., Ehret, G.B., Rice, K., Verwoert, G.C., Launer, L.J., Dehghan, A., Glazer, N.L.,
Morrison, A.C., Johnson, A.D., Aspelund, T. and Aulchenko, Y., 2009. Genome-wide
association study of blood pressure and hypertension. Nature genetics, 41(6), p.677.
Funamoto, S., Nam, K., Kimura, T., Murakoshi, A., Hashimoto, Y., Niwaya, K., Kitamura, S.,
Fujisato, T. and Kishida, A., 2010. The use of high-hydrostatic pressure treatment to
decellularize blood vessels. Biomaterials, 31(13), pp.3590-3595.
Mayer, J. and Suttner, S., 2009. Cardiac output derived from arterial pressure waveform. Current
Opinion in Anesthesiology, 22(6), pp.804-808
.
1 out of 7
Related Documents
Your All-in-One AI-Powered Toolkit for Academic Success.
+13062052269
info@desklib.com
Available 24*7 on WhatsApp / Email
![[object Object]](/_next/static/media/star-bottom.7253800d.svg)
Unlock your academic potential
Copyright © 2020–2026 A2Z Services. All Rights Reserved. Developed and managed by ZUCOL.


