Comprehensive Analysis: Bluechiip Limited Annual Report, 2017
VerifiedAdded on 2019/11/25
|13
|2713
|405
Report
AI Summary
This report presents a detailed analysis of Bluechiip Limited's annual report, focusing on its financial performance, industry position, and future strategies. The analysis includes a comprehensive review of the company's profit and loss statements, balance sheets, and cash flow statements for the years 2015, 2016, and 2017. Key aspects such as revenue, operating income, and net income are examined using trend analysis to assess performance over time. The report also delves into the company's financial ratios, including liquidity and profitability ratios, to evaluate its financial health and efficiency. Furthermore, it considers the industry outlook and Bluechiip's strategic plans, including its focus on commercialization and specific market areas. The report aims to provide a thorough understanding of Bluechiip Limited's financial position and future prospects, offering valuable insights for investors and stakeholders. The company's financial statements have been prepared in accordance with the accounting standards and is having the true and fair view of the financial position of the company.
ANALYSIS OF ANNUAL REPORT OF BLUECHIIP LIMITED
Student Name: Student
ID:
9/15/2017
Student Name: Student
ID:
9/15/2017
Paraphrase This Document
Need a fresh take? Get an instant paraphrase of this document with our AI Paraphraser
EXECUTIVE SUMMARY
The report has been given the title of the analysis of the annual report of the company –
Bluechiip limited. It in itself has given the path for the better construction and the presentation of
the report. The first objective of the report is to perform the analysis of the financial situation of
the company and the performance of the company. For this purpose the annual report for the
earlier consecutive years has been considered. The analysis includes the analysis of the cash flow
position of the company made during the year and as on date of the annual financial statements.
The second objective is the means for extending the analysis further with the inclusion of the
calculation and analysis of the financial ratios. Throughout the report, these two aims have been
flowed and thus the report has been presented with defined headings and sub headings wherever
necessary.
Contents
EXECUTIVE SUMMARY.................................................................................................................................2
INTRODUCTION...........................................................................................................................................4
SITUATION OF THE INDUSTRY AND THE FUTURE PLANS OF THE COMPANY...............................................5
DESCRIPTION OF INDUSTRY AND ITS OUTLOOK......................................................................................5
PLANS OF THE COMPANY FOR FUTURE...................................................................................................5
FINANCIAL STATEMENT ANALYSIS...............................................................................................................6
ANALYSIS OF PROFIT AND LOSS STATEMENT..........................................................................................6
ANALYSIS OF STATEMENT OF AFFAIRS....................................................................................................8
ANALYSIS OF CASH FLOWS......................................................................................................................9
ANALYSIS OF THE ACCOUNTING RATIOS.....................................................................................................9
CONCLUSION.............................................................................................................................................11
REFERENCES..............................................................................................................................................12
⊘ This is a preview!⊘
Do you want full access?
Subscribe today to unlock all pages.
Trusted by 1+ million students worldwide
INTRODUCTION
Analysis of each and every thing shall be done before proceeding to that action. Similarly
analysis of the operations and the position of the company shall be made on regularly basis so as
to equip the investor with the health of the company in all the terms. The company so selected
for the study is the Bluechiip Limited. The company has been established in the year of two
thousand and three in the country of Australia and has been listed in the Australia Stock
Exchange in the year of two thousand and eleven. The head quarter of the company is located at
1 Dalmore Drive, Caribbean Business Park, Scoresby, Victoria, 3179, Australia. The company is
providing the unique facility of tracking the item with the wireless arrangement with the security
and that too clubbed with the working in the different temperature levels in every environments.
The company has left all other companies which are using the bar code scanner or radio
frequency identification instruments. The company’s principle place of business is Australia and
other one is United States of America. The chief executive officer of the company is Mr. Andrew
Mc Lellan (ASX Website,2017). The ending date of the latest financial year is 30th of June 2017.
The independent auditors of the company which have audited the financial statements of the
company is Deloitte through its partner Anneke Du Toit. The auditors of the company have
though disclosed that the financial statements have been prepared in accordance with the
accounting standards and is having the true and fair view of the financial position of the
company but has disclosed the key matters in accordance with the new auditing standard 701 on
the Communicating the key audit matters in the auditor report (Company Official Website,
2017). The auditor has stated that the management of the company is required to exercise the
judgment to estimate the net realizable value of the inventory. The current market price of the
share of the company on the 15th day of September 2017 is 0.033 AUD (ASX Website, 2017).
Since the start of financial year 2016-2017, the company has neither declared any dividend nor
paid any dividend (Company Official Website, 2017).
Paraphrase This Document
Need a fresh take? Get an instant paraphrase of this document with our AI Paraphraser
SITUATION OF THE INDUSTRY AND THE FUTURE PLANS OF THE
COMPANY
The company is categorized under the GICS having serial number 4520 relating to Technology
hardware and equipment and within that code the sub industry is of electronic components. At
first the industry’s health has been detailed and after that the company’s plan in accordance with
the situation of the industry has been discussed.
DESCRIPTION OF INDUSTRY AND ITS OUTLOOK
The industry of the Technology hardware and equipment in the country of Australia has been
considered as the technology hub across the world. As per the report of technavio for the year of
two thousand and fifteen the investment in this particular industry will reach approximately 73
billion dollars by the end of the financial year two thousand and nineteen (Technavio, 2017).
Companies in this particular industry are trying to introduce as many new IT products and
services the no their competitor has manufactured. Companies are generally spending their
approximately 20% of their budget defined for the IT department in the hardware sector. With
the passage of the time, the investment in the particular field has been increasing on year on year
basis. The main companies engaged in the technology sector are the major players in the market
of Australia. It includes Dell Inc. Google Inc, Apple Inc, Lenovo and many other top players
(Bartlet, 2016). Every company has the urge to develop new and new products and services and
that’s why their spending in the collection of data has been increased. Thus, the Technology
hardware and equipment industry has the positive indications for much bigger growth in the
future
PLANS OF THE COMPANY FOR FUTURE
The main strategic action that the company has mentioned in the annual report for the financial
year ending 30th of June 2017 is that the company is more focusing on the era of
commercialization. The company has also mentioned that in order to start with the
commercialization of the company, the company has entered into the three agreements which are
known as OEM agreement. OEM agreement is studied as the agreement which led the company
to manufacture its own product and services that’s why the agreement is known as the Original
Equipment Manufacturer. Under this agreement, the company collects or purchases the raw
material from different companies and manufactures their own product in their own brand. This
will not only give the company an insight of making the product but will also create the brand
name across the world. This strategic action taken by the company will develop the future of the
company. The second strategic action that the company has taken and will bring the drastic
change in the future of the company is the company’s focus on the areas where the failure of an
action will be expensive. These areas are like IVF, Medicine which helps in regeneration, cryo
transport and the health care medicines and equipments. These companies are always ready to
take the steps which can reduce the risk of having the failure cost and hence with the entrance of
the company in this particular areas will provide the company with goodwill in the market.
(Company Official Website, 2017).
FINANCIAL STATEMENT ANALYSIS
The analysis of the financial statements have been done with the available annual report of the
company for the year ending 30th of June 2017, 30th of June 2016 and 30th of June 2015. The
analysis has been made in the three parts. In the first part the financial performance of the
company has been analysed through the statement of the profit and loss for the aforesaid
financial years. In the second part the financial position has been analysed from statement of the
affairs and in the third part cash flow position has been analysed from the statement of the cash
flows.
ANALYSIS OF PROFIT AND LOSS STATEMENT
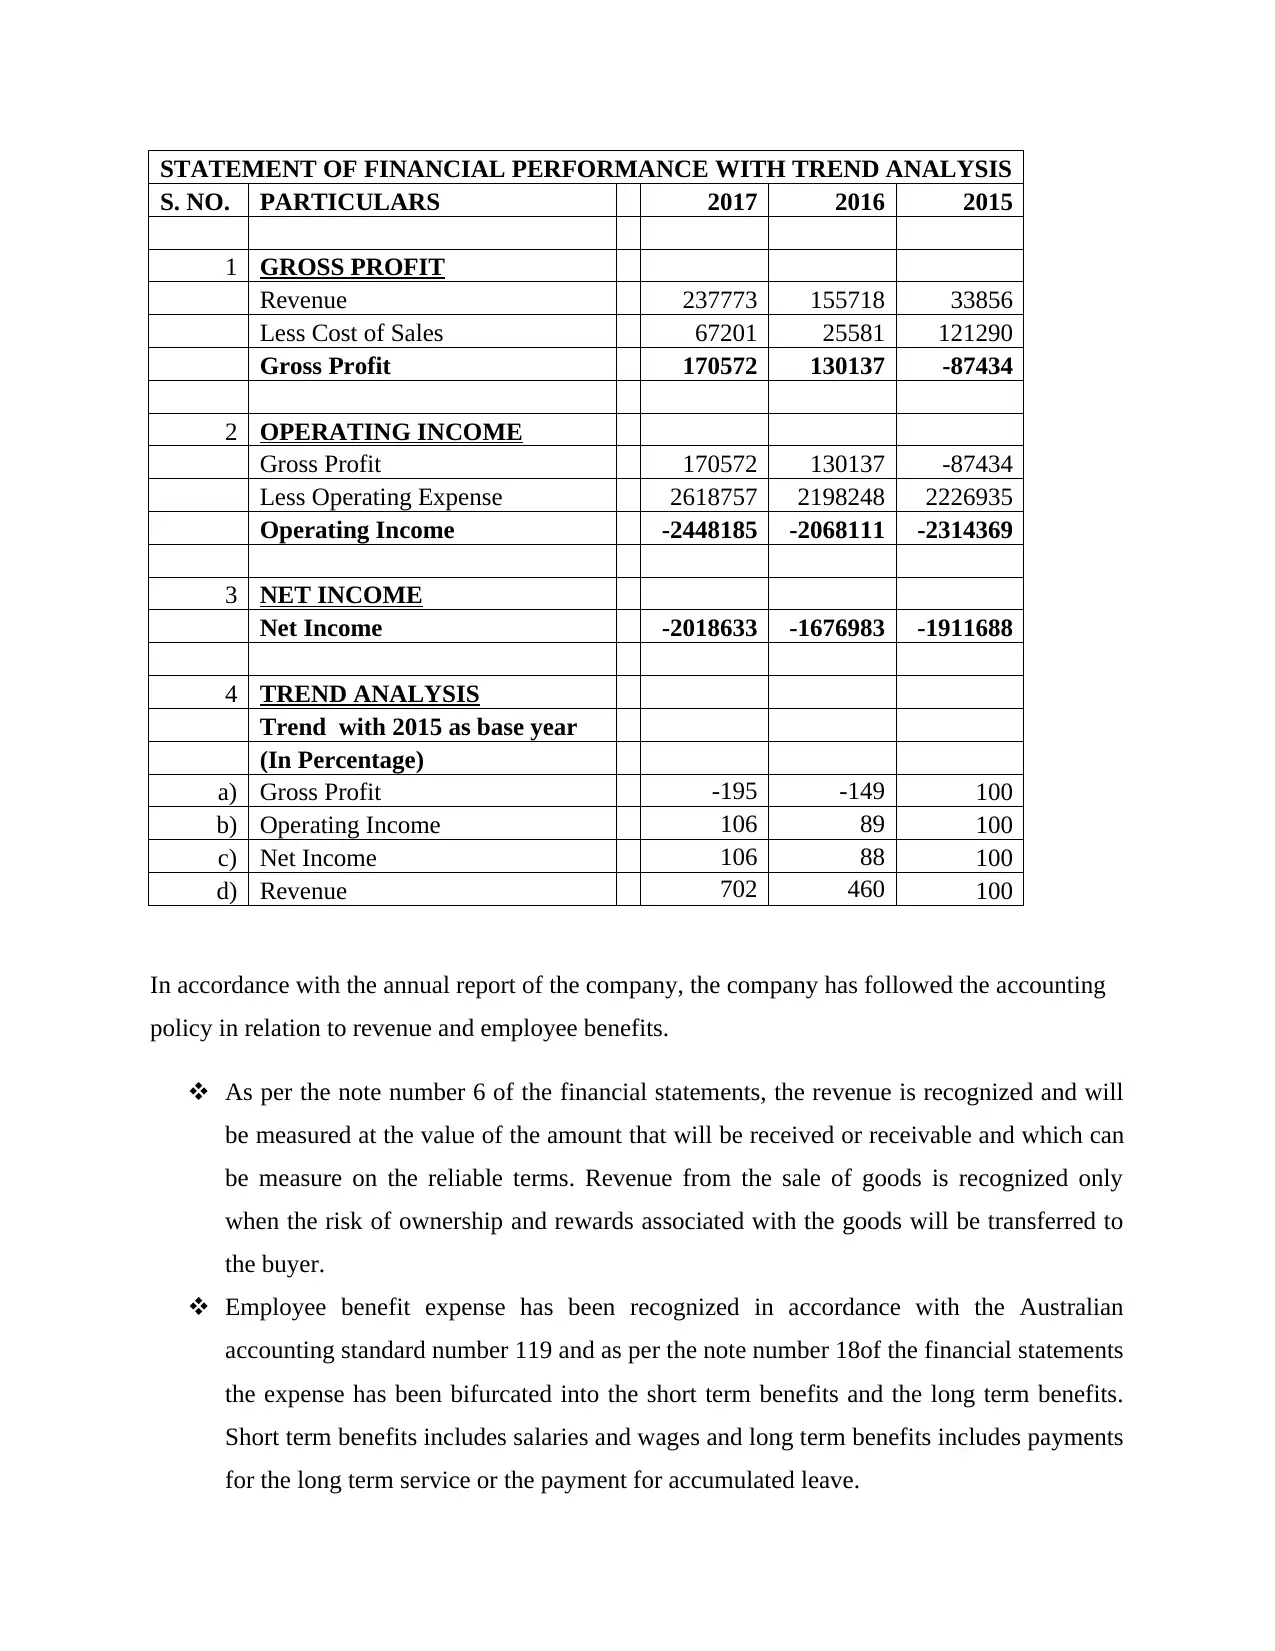
The calculations of the different items have been made in the following table to facilitate the
analysis of the performance of the company that the company has made during the financial year
ending for the last three consecutive years (White, Sondh, and Fried, 2005). After having the
calculations, the changes has been analysed by adopting the statistical method of trend analysis.
(Taylor, 2010).
known as OEM agreement. OEM agreement is studied as the agreement which led the company
to manufacture its own product and services that’s why the agreement is known as the Original
Equipment Manufacturer. Under this agreement, the company collects or purchases the raw
material from different companies and manufactures their own product in their own brand. This
will not only give the company an insight of making the product but will also create the brand
name across the world. This strategic action taken by the company will develop the future of the
company. The second strategic action that the company has taken and will bring the drastic
change in the future of the company is the company’s focus on the areas where the failure of an
action will be expensive. These areas are like IVF, Medicine which helps in regeneration, cryo
transport and the health care medicines and equipments. These companies are always ready to
take the steps which can reduce the risk of having the failure cost and hence with the entrance of
the company in this particular areas will provide the company with goodwill in the market.
(Company Official Website, 2017).
FINANCIAL STATEMENT ANALYSIS
The analysis of the financial statements have been done with the available annual report of the
company for the year ending 30th of June 2017, 30th of June 2016 and 30th of June 2015. The
analysis has been made in the three parts. In the first part the financial performance of the
company has been analysed through the statement of the profit and loss for the aforesaid
financial years. In the second part the financial position has been analysed from statement of the
affairs and in the third part cash flow position has been analysed from the statement of the cash
flows.
ANALYSIS OF PROFIT AND LOSS STATEMENT
The calculations of the different items have been made in the following table to facilitate the
analysis of the performance of the company that the company has made during the financial year
ending for the last three consecutive years (White, Sondh, and Fried, 2005). After having the
calculations, the changes has been analysed by adopting the statistical method of trend analysis.
(Taylor, 2010).
⊘ This is a preview!⊘
Do you want full access?
Subscribe today to unlock all pages.
Trusted by 1+ million students worldwide
STATEMENT OF FINANCIAL PERFORMANCE WITH TREND ANALYSIS
S. NO. PARTICULARS 2017 2016 2015
1 GROSS PROFIT
Revenue 237773 155718 33856
Less Cost of Sales 67201 25581 121290
Gross Profit 170572 130137 -87434
2 OPERATING INCOME
Gross Profit 170572 130137 -87434
Less Operating Expense 2618757 2198248 2226935
Operating Income -2448185 -2068111 -2314369
3 NET INCOME
Net Income -2018633 -1676983 -1911688
4 TREND ANALYSIS
Trend with 2015 as base year
(In Percentage)
a) Gross Profit -195 -149 100
b) Operating Income 106 89 100
c) Net Income 106 88 100
d) Revenue 702 460 100
In accordance with the annual report of the company, the company has followed the accounting
policy in relation to revenue and employee benefits.
As per the note number 6 of the financial statements, the revenue is recognized and will
be measured at the value of the amount that will be received or receivable and which can
be measure on the reliable terms. Revenue from the sale of goods is recognized only
when the risk of ownership and rewards associated with the goods will be transferred to
the buyer.
Employee benefit expense has been recognized in accordance with the Australian
accounting standard number 119 and as per the note number 18of the financial statements
the expense has been bifurcated into the short term benefits and the long term benefits.
Short term benefits includes salaries and wages and long term benefits includes payments
for the long term service or the payment for accumulated leave.
Paraphrase This Document
Need a fresh take? Get an instant paraphrase of this document with our AI Paraphraser
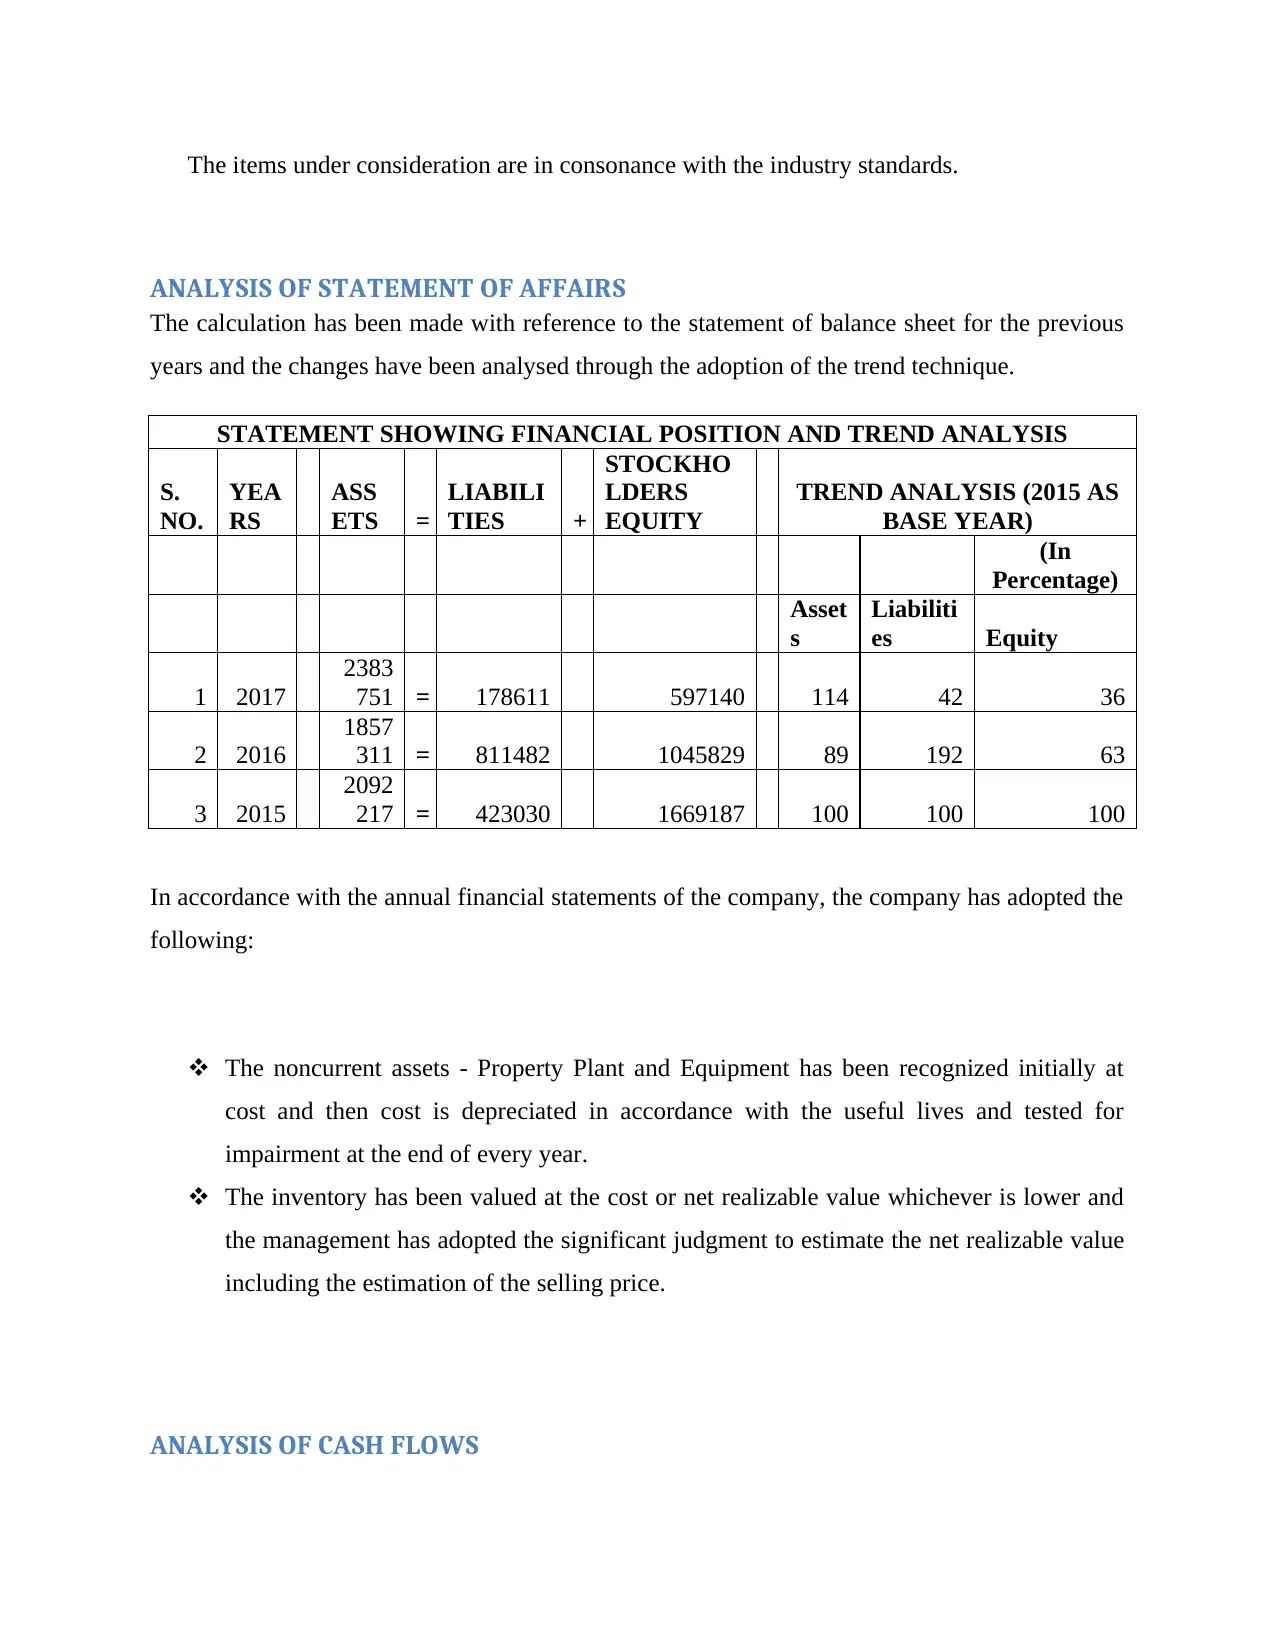
The items under consideration are in consonance with the industry standards.
ANALYSIS OF STATEMENT OF AFFAIRS
The calculation has been made with reference to the statement of balance sheet for the previous
years and the changes have been analysed through the adoption of the trend technique.
STATEMENT SHOWING FINANCIAL POSITION AND TREND ANALYSIS
S.
NO.
YEA
RS
ASS
ETS =
LIABILI
TIES +
STOCKHO
LDERS
EQUITY
TREND ANALYSIS (2015 AS
BASE YEAR)
(In
Percentage)
Asset
s
Liabiliti
es Equity
1 2017
2383
751 = 178611 597140 114 42 36
2 2016
1857
311 = 811482 1045829 89 192 63
3 2015
2092
217 = 423030 1669187 100 100 100
In accordance with the annual financial statements of the company, the company has adopted the
following:
The noncurrent assets - Property Plant and Equipment has been recognized initially at
cost and then cost is depreciated in accordance with the useful lives and tested for
impairment at the end of every year.
The inventory has been valued at the cost or net realizable value whichever is lower and
the management has adopted the significant judgment to estimate the net realizable value
including the estimation of the selling price.
ANALYSIS OF CASH FLOWS
STATEMENT SHOWING CASH FLOWS AND ANALYSIS
($)
S.
NO. PARTICULARS 2017 2016 2015
1 Operating Cash Flows -1682111 -1664486 -2269802
2 Net Income -2018633 -1676983 -1911688
3 Investing Cash Flows -4214 -2999 0
4 Financing Cash Flows 2171158 1412616 2402921
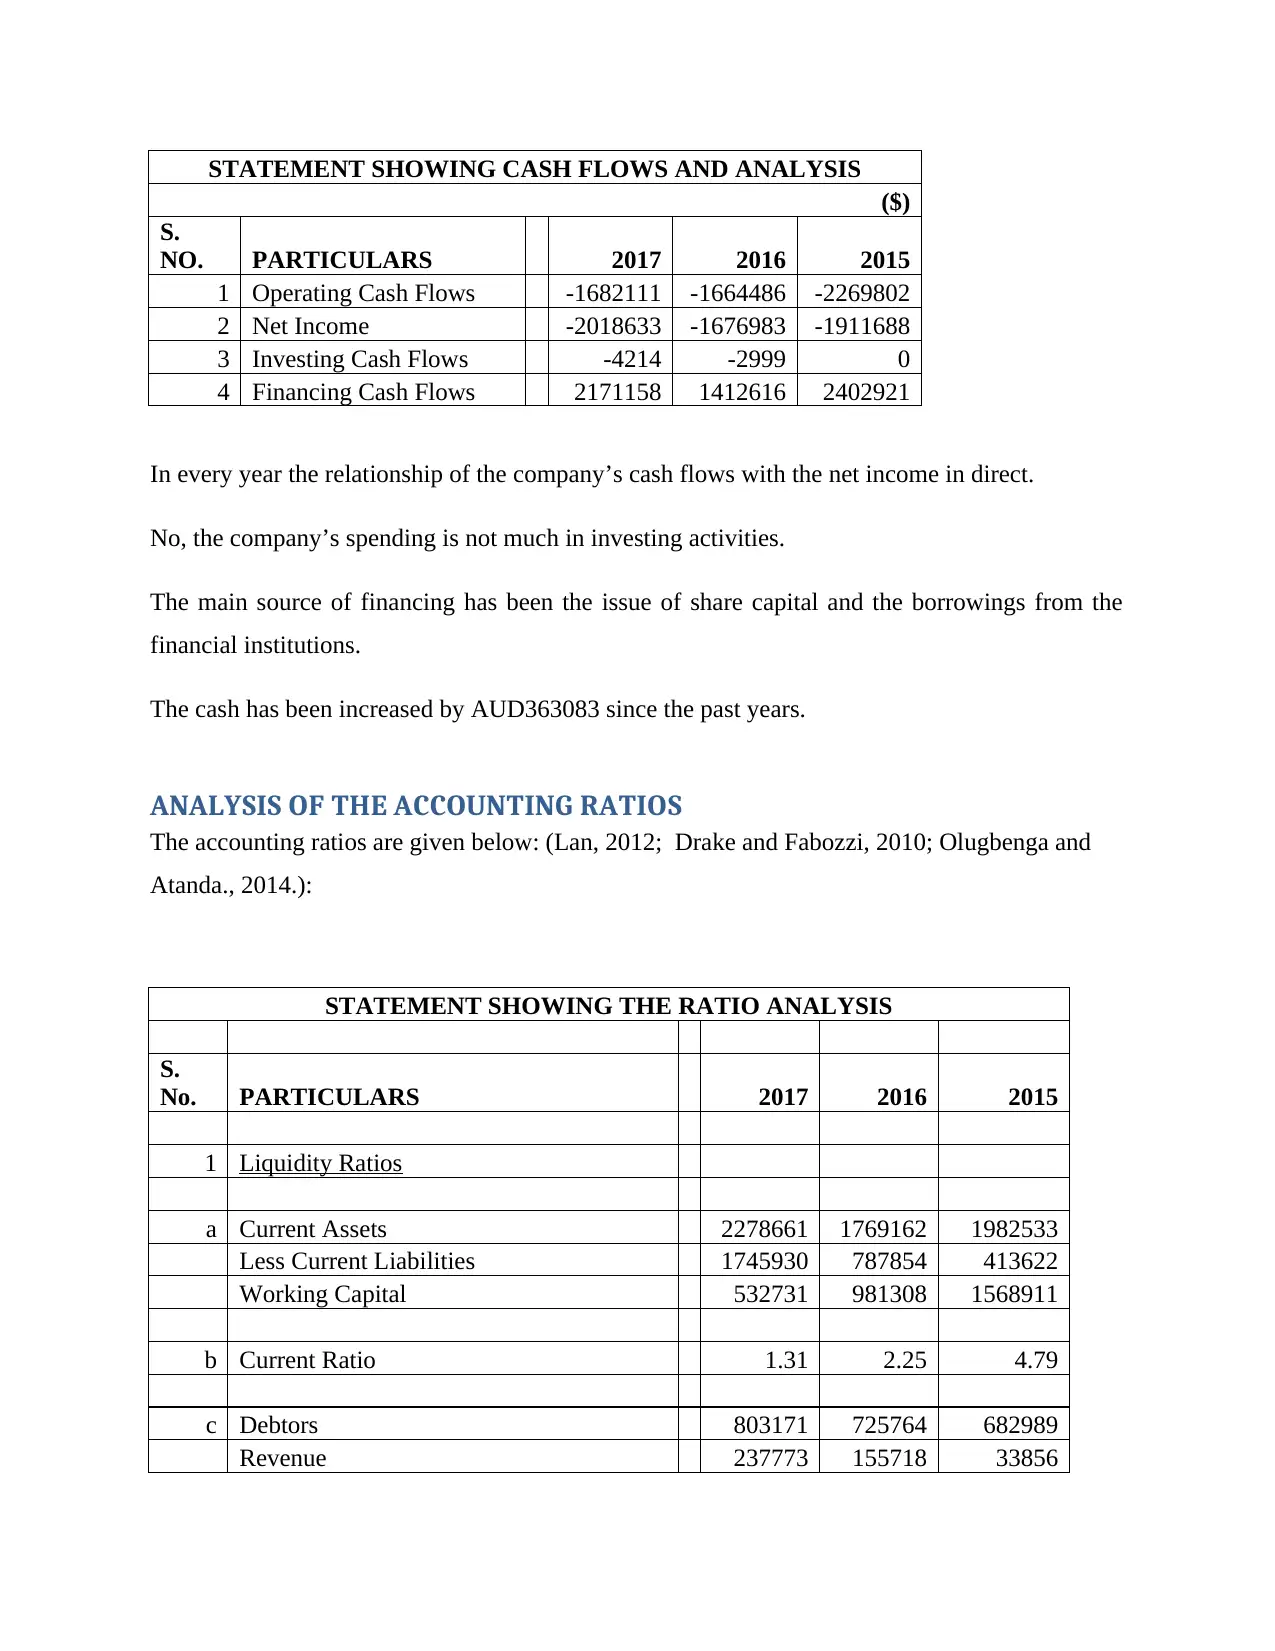
In every year the relationship of the company’s cash flows with the net income in direct.
No, the company’s spending is not much in investing activities.
The main source of financing has been the issue of share capital and the borrowings from the
financial institutions.
The cash has been increased by AUD363083 since the past years.
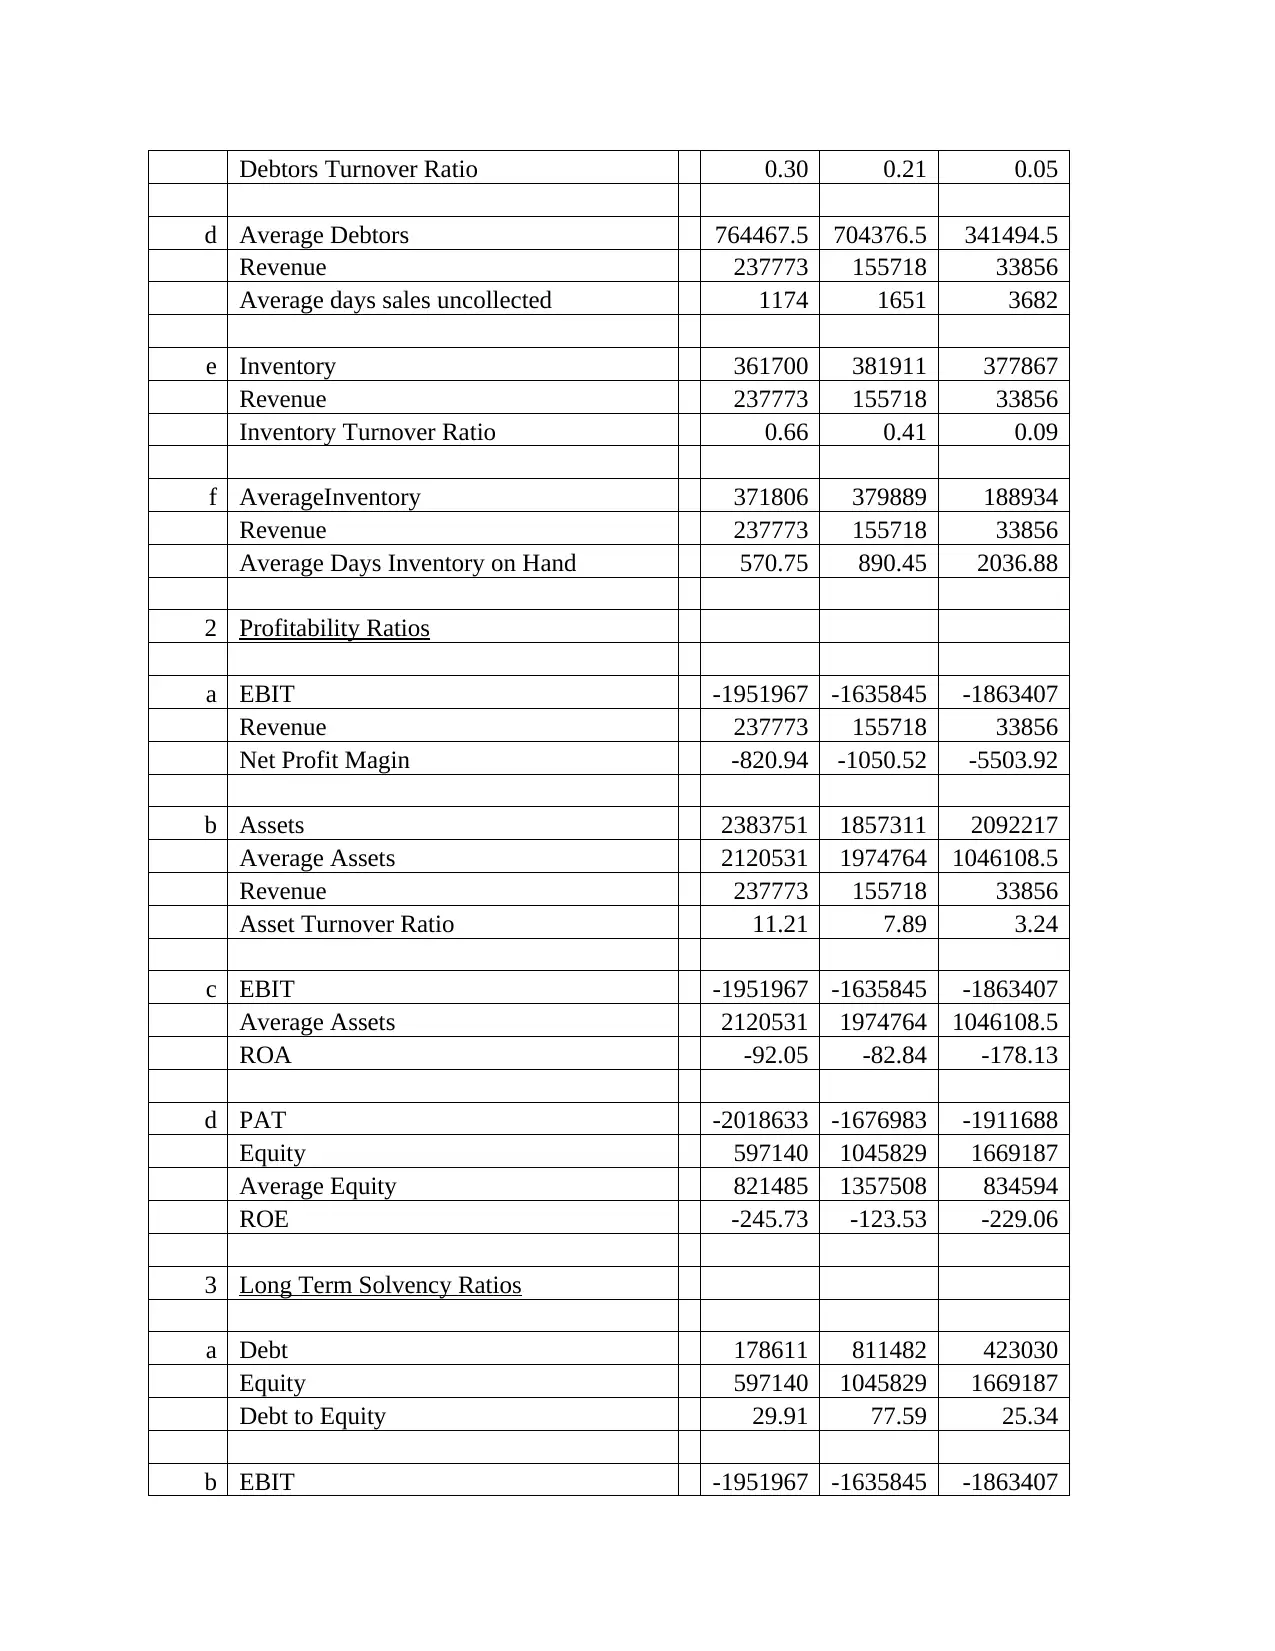
ANALYSIS OF THE ACCOUNTING RATIOS
The accounting ratios are given below: (Lan, 2012; Drake and Fabozzi, 2010; Olugbenga and
Atanda., 2014.):
STATEMENT SHOWING THE RATIO ANALYSIS
S.
No. PARTICULARS 2017 2016 2015
1 Liquidity Ratios
a Current Assets 2278661 1769162 1982533
Less Current Liabilities 1745930 787854 413622
Working Capital 532731 981308 1568911
b Current Ratio 1.31 2.25 4.79
c Debtors 803171 725764 682989
Revenue 237773 155718 33856
($)
S.
NO. PARTICULARS 2017 2016 2015
1 Operating Cash Flows -1682111 -1664486 -2269802
2 Net Income -2018633 -1676983 -1911688
3 Investing Cash Flows -4214 -2999 0
4 Financing Cash Flows 2171158 1412616 2402921
In every year the relationship of the company’s cash flows with the net income in direct.
No, the company’s spending is not much in investing activities.
The main source of financing has been the issue of share capital and the borrowings from the
financial institutions.
The cash has been increased by AUD363083 since the past years.
ANALYSIS OF THE ACCOUNTING RATIOS
The accounting ratios are given below: (Lan, 2012; Drake and Fabozzi, 2010; Olugbenga and
Atanda., 2014.):
STATEMENT SHOWING THE RATIO ANALYSIS
S.
No. PARTICULARS 2017 2016 2015
1 Liquidity Ratios
a Current Assets 2278661 1769162 1982533
Less Current Liabilities 1745930 787854 413622
Working Capital 532731 981308 1568911
b Current Ratio 1.31 2.25 4.79
c Debtors 803171 725764 682989
Revenue 237773 155718 33856
⊘ This is a preview!⊘
Do you want full access?
Subscribe today to unlock all pages.
Trusted by 1+ million students worldwide
Debtors Turnover Ratio 0.30 0.21 0.05
d Average Debtors 764467.5 704376.5 341494.5
Revenue 237773 155718 33856
Average days sales uncollected 1174 1651 3682
e Inventory 361700 381911 377867
Revenue 237773 155718 33856
Inventory Turnover Ratio 0.66 0.41 0.09
f AverageInventory 371806 379889 188934
Revenue 237773 155718 33856
Average Days Inventory on Hand 570.75 890.45 2036.88
2 Profitability Ratios
a EBIT -1951967 -1635845 -1863407
Revenue 237773 155718 33856
Net Profit Magin -820.94 -1050.52 -5503.92
b Assets 2383751 1857311 2092217
Average Assets 2120531 1974764 1046108.5
Revenue 237773 155718 33856
Asset Turnover Ratio 11.21 7.89 3.24
c EBIT -1951967 -1635845 -1863407
Average Assets 2120531 1974764 1046108.5
ROA -92.05 -82.84 -178.13
d PAT -2018633 -1676983 -1911688
Equity 597140 1045829 1669187
Average Equity 821485 1357508 834594
ROE -245.73 -123.53 -229.06
3 Long Term Solvency Ratios
a Debt 178611 811482 423030
Equity 597140 1045829 1669187
Debt to Equity 29.91 77.59 25.34
b EBIT -1951967 -1635845 -1863407
Paraphrase This Document
Need a fresh take? Get an instant paraphrase of this document with our AI Paraphraser
Interest 66666 41138 48281
Interest Coverage Ratio -29.28 -39.76 -38.60
4 Cash Flow Adequacy Ratios
a Cash 972767 487934 742803
Current Liabilities 1745930 787854 413622
Cash Flow Yield 0.56 0.62 1.80
b Cash Flow from Operating Activities -1682111 -1664486 -2269802
Sales 237773 155718 33856
Cash Flow to Sales -7.07 -10.69 -67.04
c Cash Flow -1682111 -1664486 -2269802
Assets 2383751 1857311 2092217
Cash Flow to Assets -0.71 -0.90 -1.08
5 Market Strength Ratios
a Earnings Per Share -0.73 -0.83 -1.3
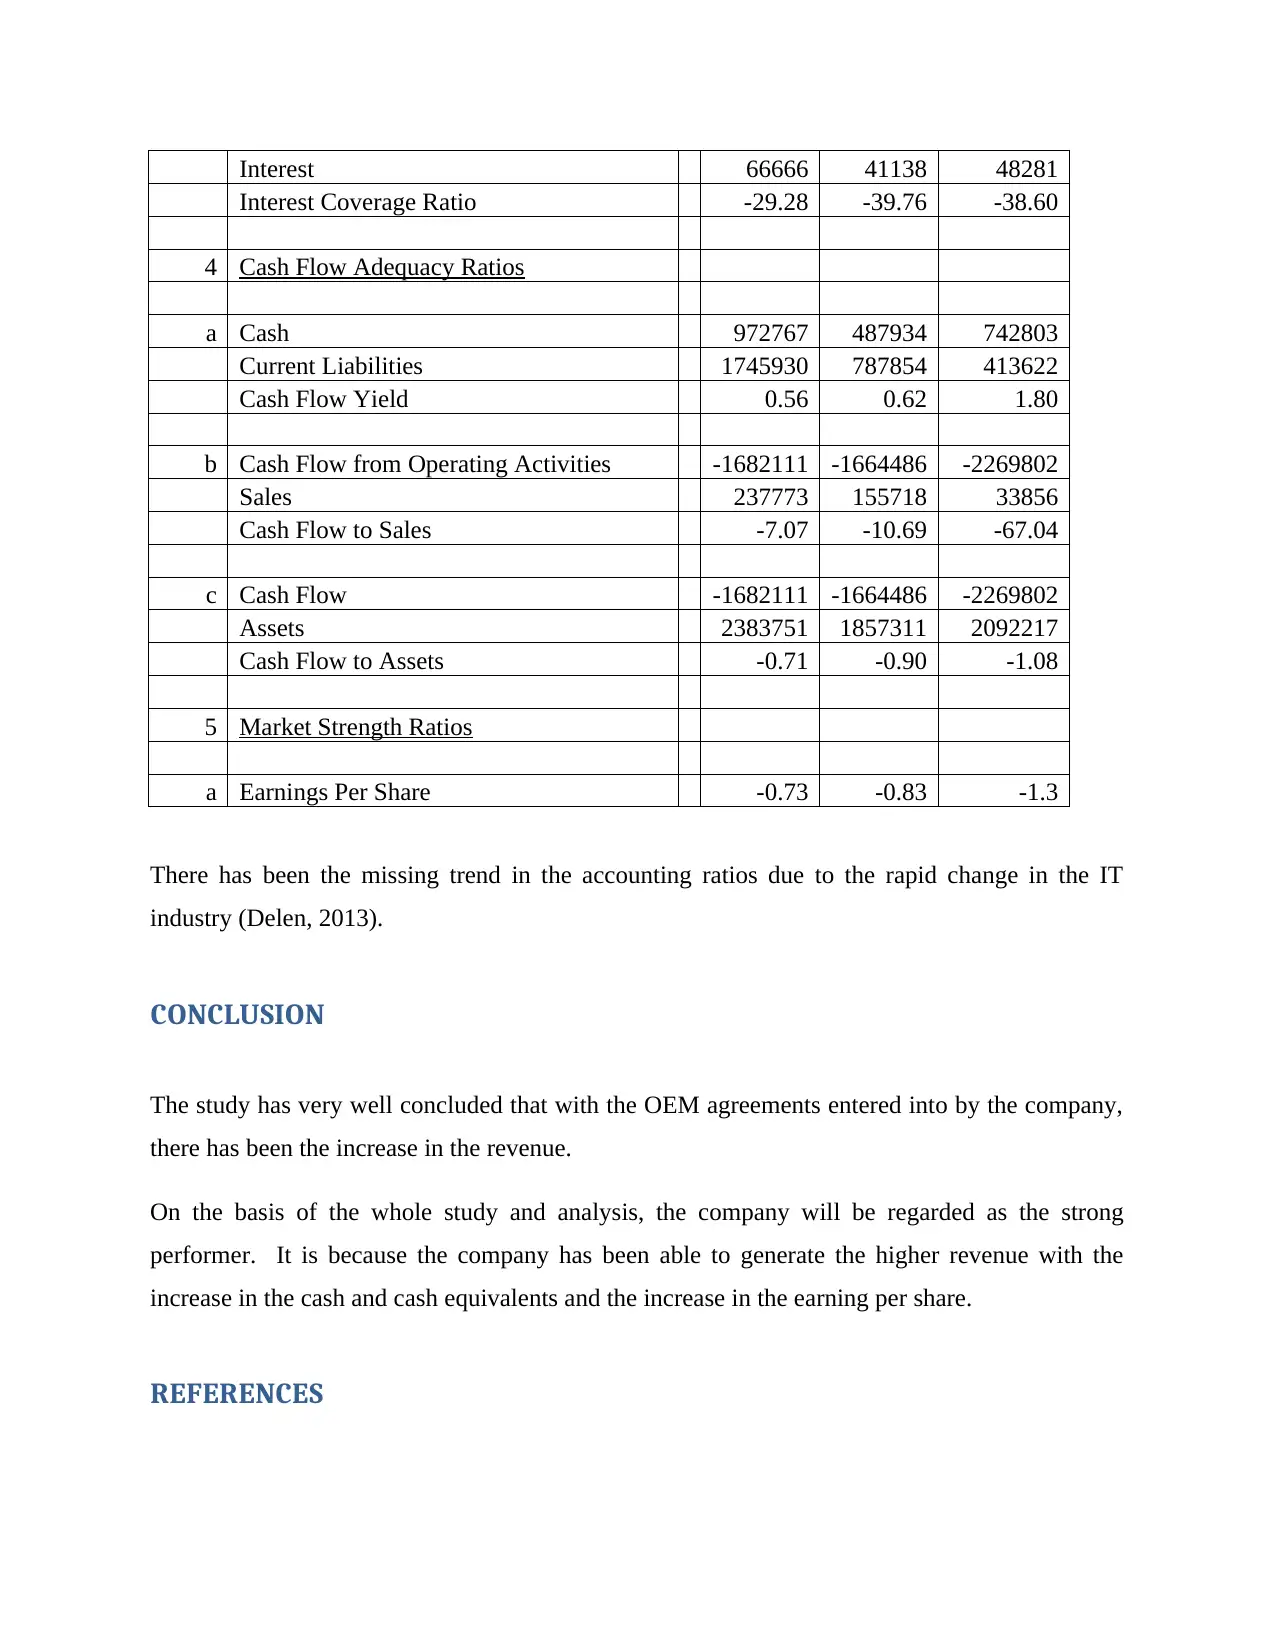
There has been the missing trend in the accounting ratios due to the rapid change in the IT
industry (Delen, 2013).
CONCLUSION
The study has very well concluded that with the OEM agreements entered into by the company,
there has been the increase in the revenue.
On the basis of the whole study and analysis, the company will be regarded as the strong
performer. It is because the company has been able to generate the higher revenue with the
increase in the cash and cash equivalents and the increase in the earning per share.
REFERENCES
Interest Coverage Ratio -29.28 -39.76 -38.60
4 Cash Flow Adequacy Ratios
a Cash 972767 487934 742803
Current Liabilities 1745930 787854 413622
Cash Flow Yield 0.56 0.62 1.80
b Cash Flow from Operating Activities -1682111 -1664486 -2269802
Sales 237773 155718 33856
Cash Flow to Sales -7.07 -10.69 -67.04
c Cash Flow -1682111 -1664486 -2269802
Assets 2383751 1857311 2092217
Cash Flow to Assets -0.71 -0.90 -1.08
5 Market Strength Ratios
a Earnings Per Share -0.73 -0.83 -1.3
There has been the missing trend in the accounting ratios due to the rapid change in the IT
industry (Delen, 2013).
CONCLUSION
The study has very well concluded that with the OEM agreements entered into by the company,
there has been the increase in the revenue.
On the basis of the whole study and analysis, the company will be regarded as the strong
performer. It is because the company has been able to generate the higher revenue with the
increase in the cash and cash equivalents and the increase in the earning per share.
REFERENCES
ASX Website, (2017), “Bluechiip Limited” available at http://www.asx.com.au/asx/share-price-
research/company/BCT accessed on 15/09/2017.
Bartlet C, (2016), “Australia’s Health Care System: An Opportunity for Economic Growth”
available at https://www.strategyand.pwc.com/reports/australias-healthcare-system accessed on
14/09/2017.
Company Official Website, (2015), “Annual Report 2015”, available at
http://www.bluechiip.com/ accessed on 14/09/2017.
Company Official Website, (2016), “Annual Report 2016”, available at
http://www.bluechiip.com/ accessed on 14/09/2017.
Company Official Website, (2017), “Annual Report 2017”, available at
http://www.bluechiip.com/ accessed on 14/09/2017.
Dechow, P.M., Richardson, S.A. and Sloan, R.G., 2008. The persistence and pricing of the cash
component of earnings. Journal of Accounting Research, 46(3), pp.537-566.
Delen, D., 2013. Measuring firm performance using financial ratios: A decision tree
approach. Expert Systems with Applications, 40(10), pp.3970-3983.
Drake, P.P. and Fabozzi, F.J., 2010. Financial ratio analysis. Handbook of Finance.
Lan J, (2012), “16 Financial Ratios for Analyzing Company’s Strength and Weaknesses”
available at http://www.aaii.com/journal/article/16-financial-ratios-for-analyzing-a-companys-
strengths-and-weaknesses.touch accessed on 14/09/2017.
Olugbenga, A.A. and Atanda, O.A., 2014. Value relevance of financial accounting information
of quoted companies in Nigeria: A trend analysis. Research Journal of Finance and
Accounting, 5(8), pp.86-93.
Taylor, M., 2010. Financial statement analysis.
Technavio, (2015), “Top companies in the Australian IT Market” available at
https://www.technavio.com/blog/top-companies-australian-it-market accessed on 15/09/2017.
⊘ This is a preview!⊘
Do you want full access?
Subscribe today to unlock all pages.
Trusted by 1+ million students worldwide
1 out of 13
Related Documents


Your All-in-One AI-Powered Toolkit for Academic Success.
+13062052269
info@desklib.com
Available 24*7 on WhatsApp / Email
![[object Object]](/_next/static/media/star-bottom.7253800d.svg)
Unlock your academic potential
Copyright © 2020–2026 A2Z Services. All Rights Reserved. Developed and managed by ZUCOL.