Financial Trends Analysis: BlueScope Steel Limited - MBA901
VerifiedAdded on 2022/11/28
|11
|1839
|499
Report
AI Summary
This report offers a detailed financial analysis of BlueScope Steel Limited, examining its performance over a five-year period using key financial ratios. The analysis covers profitability ratios, working capital ratios, solvency ratios, and market prospect ratios to assess the company's financial health and operational efficiency. The report also includes a horizontal analysis of balance sheet items to identify significant trends in assets, liabilities, and equity. The findings are contextualized within the global market trends of the flat steel product industry, considering factors such as infrastructure development and growth in emerging economies. The report concludes with an interpretation of the financial statements, emphasizing their importance for stakeholders and the insights gained from the ratio analysis. The study utilizes data from BlueScope Steel's annual reports and relevant industry sources, providing a comprehensive overview of the company's financial position and performance.

FINANCE
TRENDS ANALYSIS- BlueScope Steel Limited
TRENDS ANALYSIS- BlueScope Steel Limited
Paraphrase This Document
Need a fresh take? Get an instant paraphrase of this document with our AI Paraphraser
Contents
Introduction................................................................................................................................2
Background of the company......................................................................................................2
Ratio analysis.............................................................................................................................2
Conclusion..................................................................................................................................5
References..................................................................................................................................6
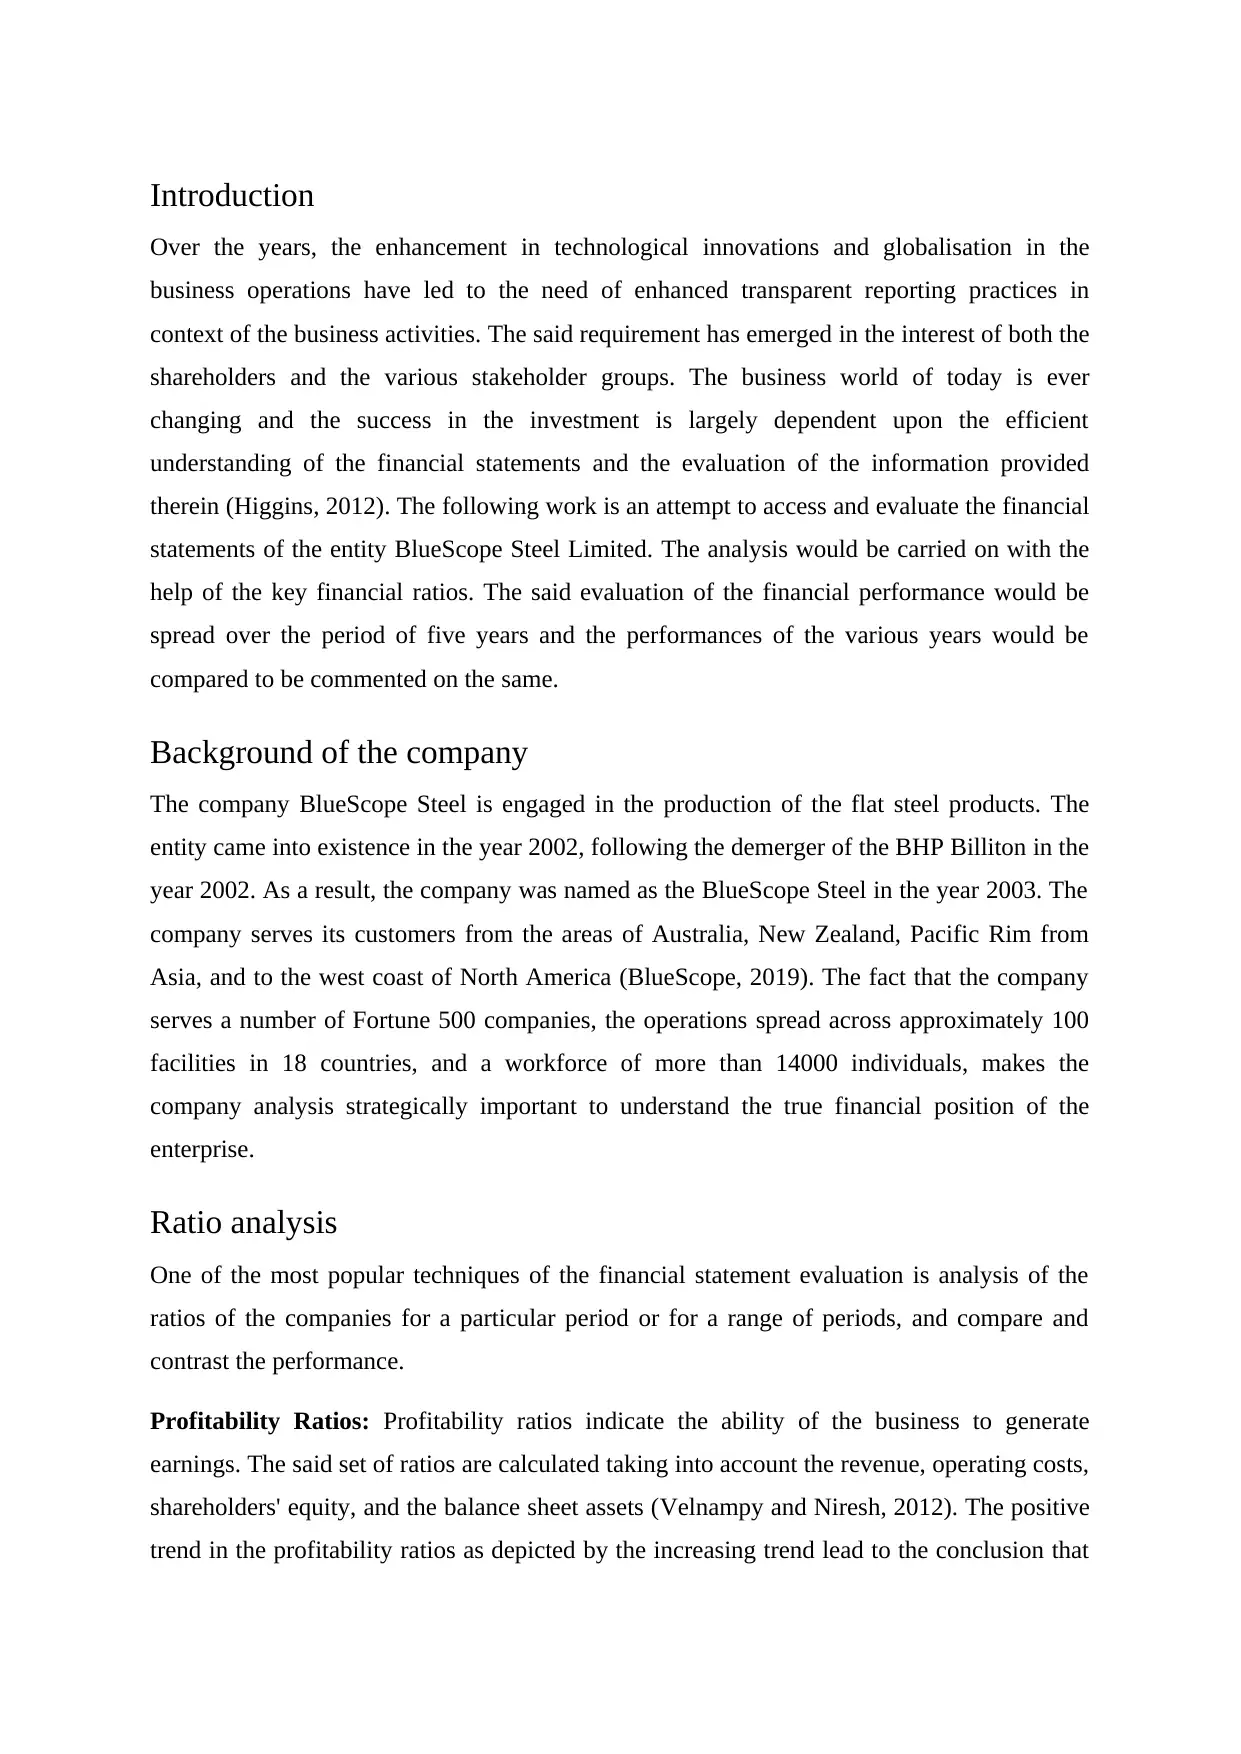
Introduction
Over the years, the enhancement in technological innovations and globalisation in the
business operations have led to the need of enhanced transparent reporting practices in
context of the business activities. The said requirement has emerged in the interest of both the
shareholders and the various stakeholder groups. The business world of today is ever
changing and the success in the investment is largely dependent upon the efficient
understanding of the financial statements and the evaluation of the information provided
therein (Higgins, 2012). The following work is an attempt to access and evaluate the financial
statements of the entity BlueScope Steel Limited. The analysis would be carried on with the
help of the key financial ratios. The said evaluation of the financial performance would be
spread over the period of five years and the performances of the various years would be
compared to be commented on the same.
Background of the company
The company BlueScope Steel is engaged in the production of the flat steel products. The
entity came into existence in the year 2002, following the demerger of the BHP Billiton in the
year 2002. As a result, the company was named as the BlueScope Steel in the year 2003. The
company serves its customers from the areas of Australia, New Zealand, Pacific Rim from
Asia, and to the west coast of North America (BlueScope, 2019). The fact that the company
serves a number of Fortune 500 companies, the operations spread across approximately 100
facilities in 18 countries, and a workforce of more than 14000 individuals, makes the
company analysis strategically important to understand the true financial position of the
enterprise.
Ratio analysis
One of the most popular techniques of the financial statement evaluation is analysis of the
ratios of the companies for a particular period or for a range of periods, and compare and
contrast the performance.
Profitability Ratios: Profitability ratios indicate the ability of the business to generate
earnings. The said set of ratios are calculated taking into account the revenue, operating costs,
shareholders' equity, and the balance sheet assets (Velnampy and Niresh, 2012). The positive
trend in the profitability ratios as depicted by the increasing trend lead to the conclusion that
⊘ This is a preview!⊘
Do you want full access?
Subscribe today to unlock all pages.
Trusted by 1+ million students worldwide
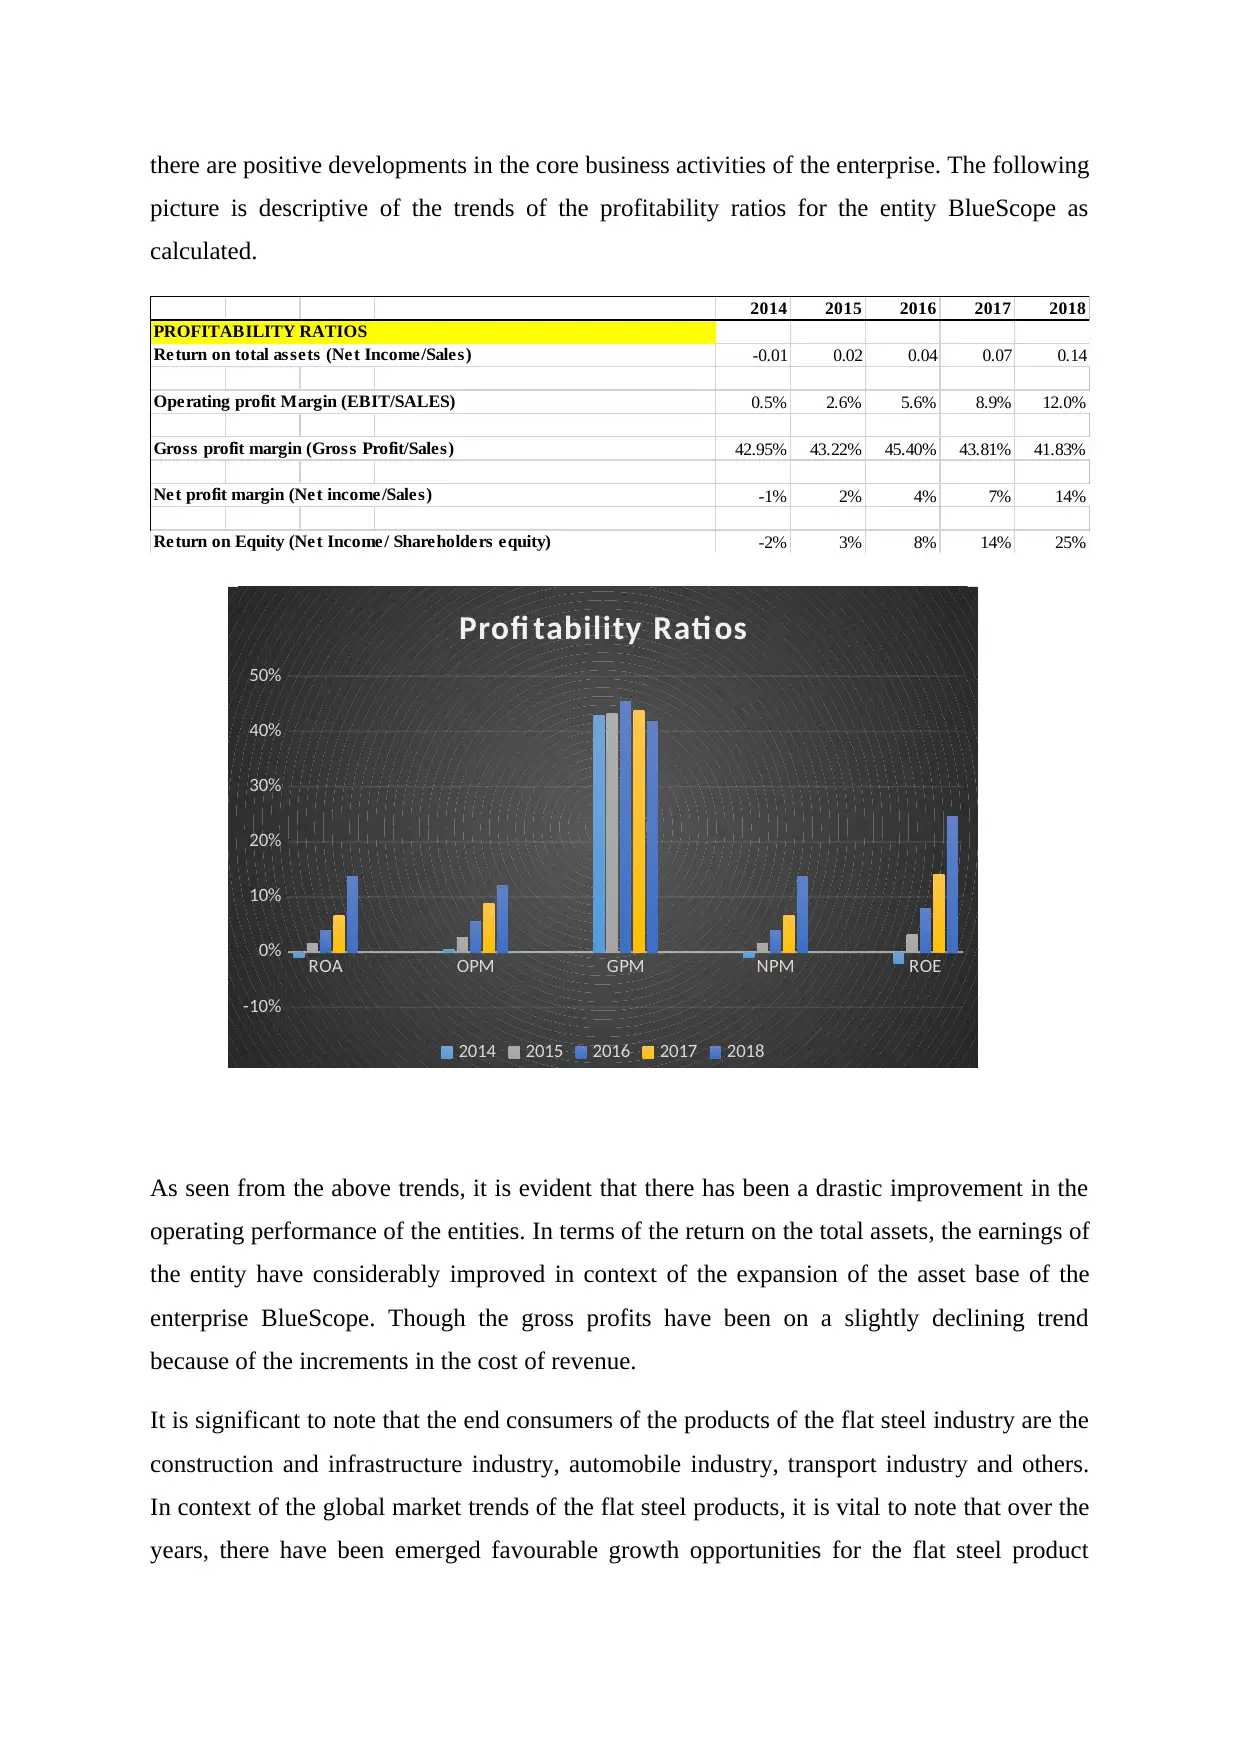
there are positive developments in the core business activities of the enterprise. The following
picture is descriptive of the trends of the profitability ratios for the entity BlueScope as
calculated.
2014 2015 2016 2017 2018
PROFITABILITY RATIOS
Return on total assets (Net Income/Sales) -0.01 0.02 0.04 0.07 0.14
Operating profit Margin (EBIT/SALES) 0.5% 2.6% 5.6% 8.9% 12.0%
Gross profit margin (Gross Profit/Sales) 42.95% 43.22% 45.40% 43.81% 41.83%
Net profit margin (Net income/Sales) -1% 2% 4% 7% 14%
Return on Equity (Net Income/ Shareholders equity) -2% 3% 8% 14% 25%
As seen from the above trends, it is evident that there has been a drastic improvement in the
operating performance of the entities. In terms of the return on the total assets, the earnings of
the entity have considerably improved in context of the expansion of the asset base of the
enterprise BlueScope. Though the gross profits have been on a slightly declining trend
because of the increments in the cost of revenue.
It is significant to note that the end consumers of the products of the flat steel industry are the
construction and infrastructure industry, automobile industry, transport industry and others.
In context of the global market trends of the flat steel products, it is vital to note that over the
years, there have been emerged favourable growth opportunities for the flat steel product
ROA OPM GPM NPM ROE
-10%
0%
10%
20%
30%
40%
50%
Profi tability Rati os
2014 2015 2016 2017 2018
Paraphrase This Document
Need a fresh take? Get an instant paraphrase of this document with our AI Paraphraser
industry by the virtue of extensive infrastructural activities happening. This is in addition to
the boom in the construction industry in the developing economies, like that of China, India,
and Japan (Reuters, 2019). In addition, a steady growth can be seen in Europe as well in
terms of the automotive industry and hence the growing trends. Thus, the financial
performance of the entity BlueScope Steels is very much in the lines with the global financial
trends, as depicted by the drastic increase in the net profit margin and the return on equity.
Working capital ratios: The working capital ratios are considered as one of the prime ratios
in the financial analysis. These set of the ratios indicate the indicators liquidity position of the
company. In addition, they shed a light on the short-term financial health and the overall
operational efficiency of an enterprise (Saleem and Rehman, 2011). In terms of drawing the
conclusions from the ratio analysis, it must be noted that the high working capital ratio values
are desired to indicate the soundness in the financial position. Generally, the values near two
or more is preferred. The ratios chiefly indicate the ability of the entity to pay off the short
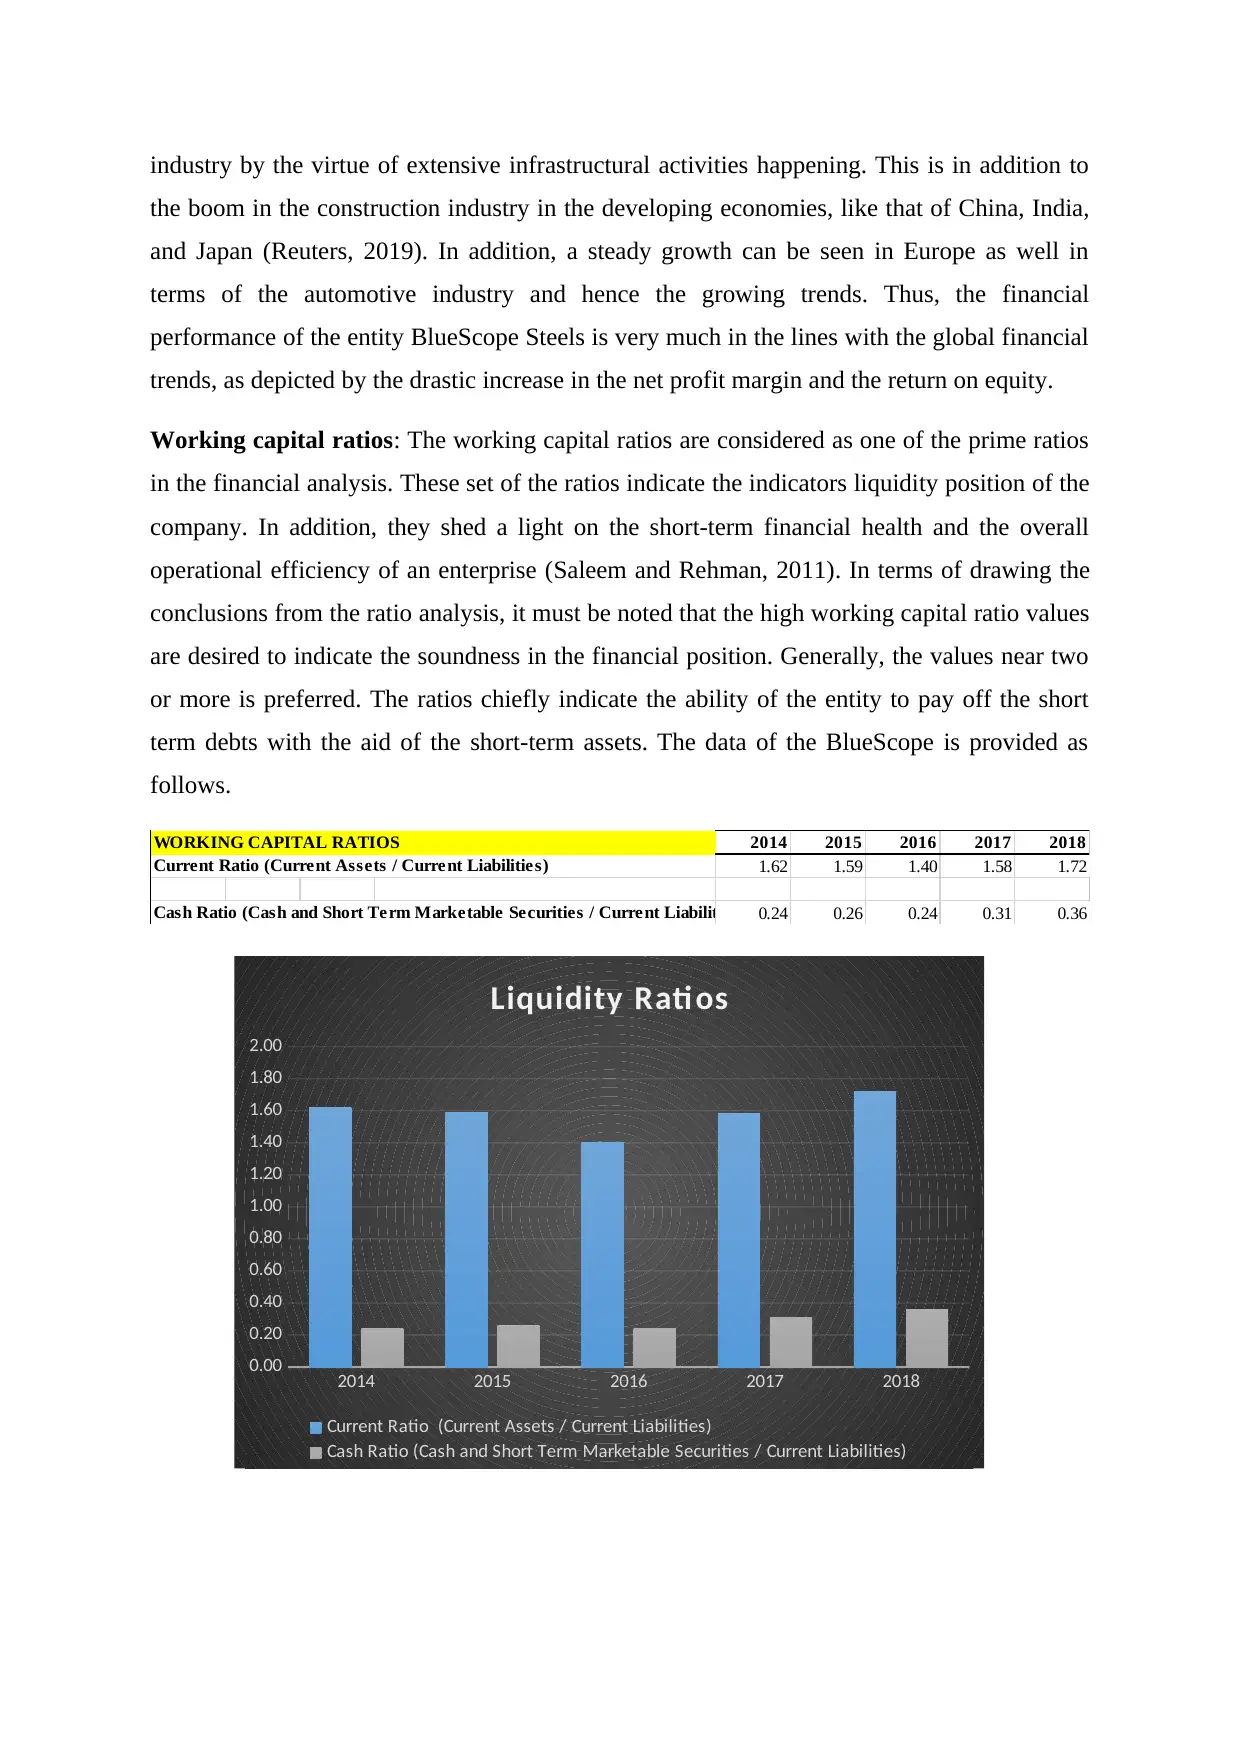
term debts with the aid of the short-term assets. The data of the BlueScope is provided as
follows.
WORKING CAPITAL RATIOS 2014 2015 2016 2017 2018
Current Ratio (Current Assets / Current Liabilities) 1.62 1.59 1.40 1.58 1.72
Cash Ratio (Cash and Short Term Marketable Securities / Current Liabilities) 0.24 0.26 0.24 0.31 0.36
2014 2015 2016 2017 2018
0.00
0.20
0.40
0.60
0.80
1.00
1.20
1.40
1.60
1.80
2.00
Liquidity Rati os
Current Ratio (Current Assets / Current Liabilities)
Cash Ratio (Cash and Short Term Marketable Securities / Current Liabilities)
the boom in the construction industry in the developing economies, like that of China, India,
and Japan (Reuters, 2019). In addition, a steady growth can be seen in Europe as well in
terms of the automotive industry and hence the growing trends. Thus, the financial
performance of the entity BlueScope Steels is very much in the lines with the global financial
trends, as depicted by the drastic increase in the net profit margin and the return on equity.
Working capital ratios: The working capital ratios are considered as one of the prime ratios
in the financial analysis. These set of the ratios indicate the indicators liquidity position of the
company. In addition, they shed a light on the short-term financial health and the overall
operational efficiency of an enterprise (Saleem and Rehman, 2011). In terms of drawing the
conclusions from the ratio analysis, it must be noted that the high working capital ratio values
are desired to indicate the soundness in the financial position. Generally, the values near two
or more is preferred. The ratios chiefly indicate the ability of the entity to pay off the short
term debts with the aid of the short-term assets. The data of the BlueScope is provided as
follows.
WORKING CAPITAL RATIOS 2014 2015 2016 2017 2018
Current Ratio (Current Assets / Current Liabilities) 1.62 1.59 1.40 1.58 1.72
Cash Ratio (Cash and Short Term Marketable Securities / Current Liabilities) 0.24 0.26 0.24 0.31 0.36
2014 2015 2016 2017 2018
0.00
0.20
0.40
0.60
0.80
1.00
1.20
1.40
1.60
1.80
2.00
Liquidity Rati os
Current Ratio (Current Assets / Current Liabilities)
Cash Ratio (Cash and Short Term Marketable Securities / Current Liabilities)
There has been desirable position in terms of the working capital, as demonstrated by the
ratios closer to 2. The increment in the working capital ratio can be stated to be because of
the rising trends in the inventory levels and the debtors of the company BlueScope, as evident
from the balance sheet values.
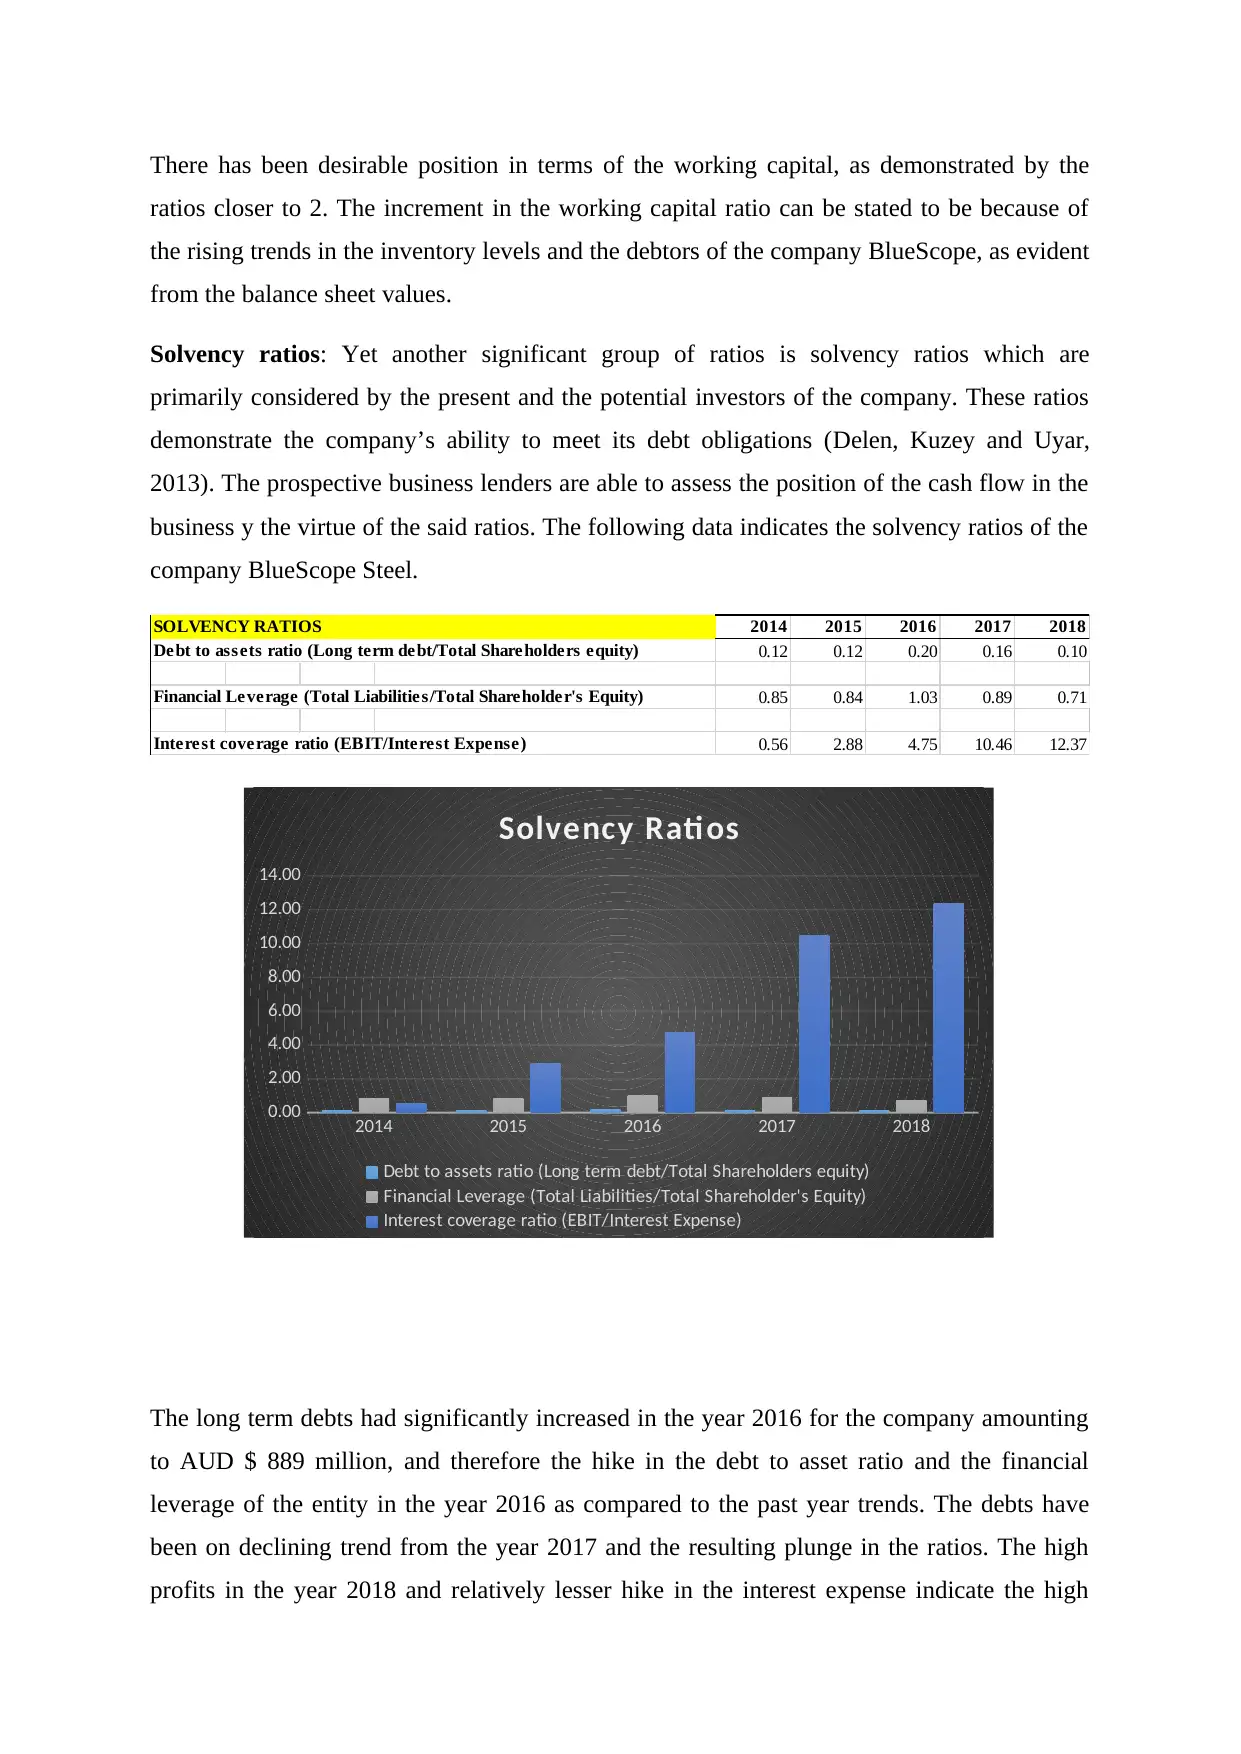
Solvency ratios: Yet another significant group of ratios is solvency ratios which are
primarily considered by the present and the potential investors of the company. These ratios
demonstrate the company’s ability to meet its debt obligations (Delen, Kuzey and Uyar,
2013). The prospective business lenders are able to assess the position of the cash flow in the
business y the virtue of the said ratios. The following data indicates the solvency ratios of the
company BlueScope Steel.
SOLVENCY RATIOS 2014 2015 2016 2017 2018
Debt to assets ratio (Long term debt/Total Shareholders equity) 0.12 0.12 0.20 0.16 0.10
Financial Leverage (Total Liabilities/Total Shareholder's Equity) 0.85 0.84 1.03 0.89 0.71
Interest coverage ratio (EBIT/Interest Expense) 0.56 2.88 4.75 10.46 12.37
The long term debts had significantly increased in the year 2016 for the company amounting
to AUD $ 889 million, and therefore the hike in the debt to asset ratio and the financial
leverage of the entity in the year 2016 as compared to the past year trends. The debts have
been on declining trend from the year 2017 and the resulting plunge in the ratios. The high
profits in the year 2018 and relatively lesser hike in the interest expense indicate the high
2014 2015 2016 2017 2018
0.00
2.00
4.00
6.00
8.00
10.00
12.00
14.00
Solvency Ratios
Debt to assets ratio (Long term debt/Total Shareholders equity)
Financial Leverage (Total Liabilities/Total Shareholder's Equity)
Interest coverage ratio (EBIT/Interest Expense)
ratios closer to 2. The increment in the working capital ratio can be stated to be because of
the rising trends in the inventory levels and the debtors of the company BlueScope, as evident
from the balance sheet values.
Solvency ratios: Yet another significant group of ratios is solvency ratios which are
primarily considered by the present and the potential investors of the company. These ratios
demonstrate the company’s ability to meet its debt obligations (Delen, Kuzey and Uyar,
2013). The prospective business lenders are able to assess the position of the cash flow in the
business y the virtue of the said ratios. The following data indicates the solvency ratios of the
company BlueScope Steel.
SOLVENCY RATIOS 2014 2015 2016 2017 2018
Debt to assets ratio (Long term debt/Total Shareholders equity) 0.12 0.12 0.20 0.16 0.10
Financial Leverage (Total Liabilities/Total Shareholder's Equity) 0.85 0.84 1.03 0.89 0.71
Interest coverage ratio (EBIT/Interest Expense) 0.56 2.88 4.75 10.46 12.37
The long term debts had significantly increased in the year 2016 for the company amounting
to AUD $ 889 million, and therefore the hike in the debt to asset ratio and the financial
leverage of the entity in the year 2016 as compared to the past year trends. The debts have
been on declining trend from the year 2017 and the resulting plunge in the ratios. The high
profits in the year 2018 and relatively lesser hike in the interest expense indicate the high
2014 2015 2016 2017 2018
0.00
2.00
4.00
6.00
8.00
10.00
12.00
14.00
Solvency Ratios
Debt to assets ratio (Long term debt/Total Shareholders equity)
Financial Leverage (Total Liabilities/Total Shareholder's Equity)
Interest coverage ratio (EBIT/Interest Expense)
⊘ This is a preview!⊘
Do you want full access?
Subscribe today to unlock all pages.
Trusted by 1+ million students worldwide
interest coverage ratios for the year 2017 and 2018 of the company, and the same is a good
indicator.
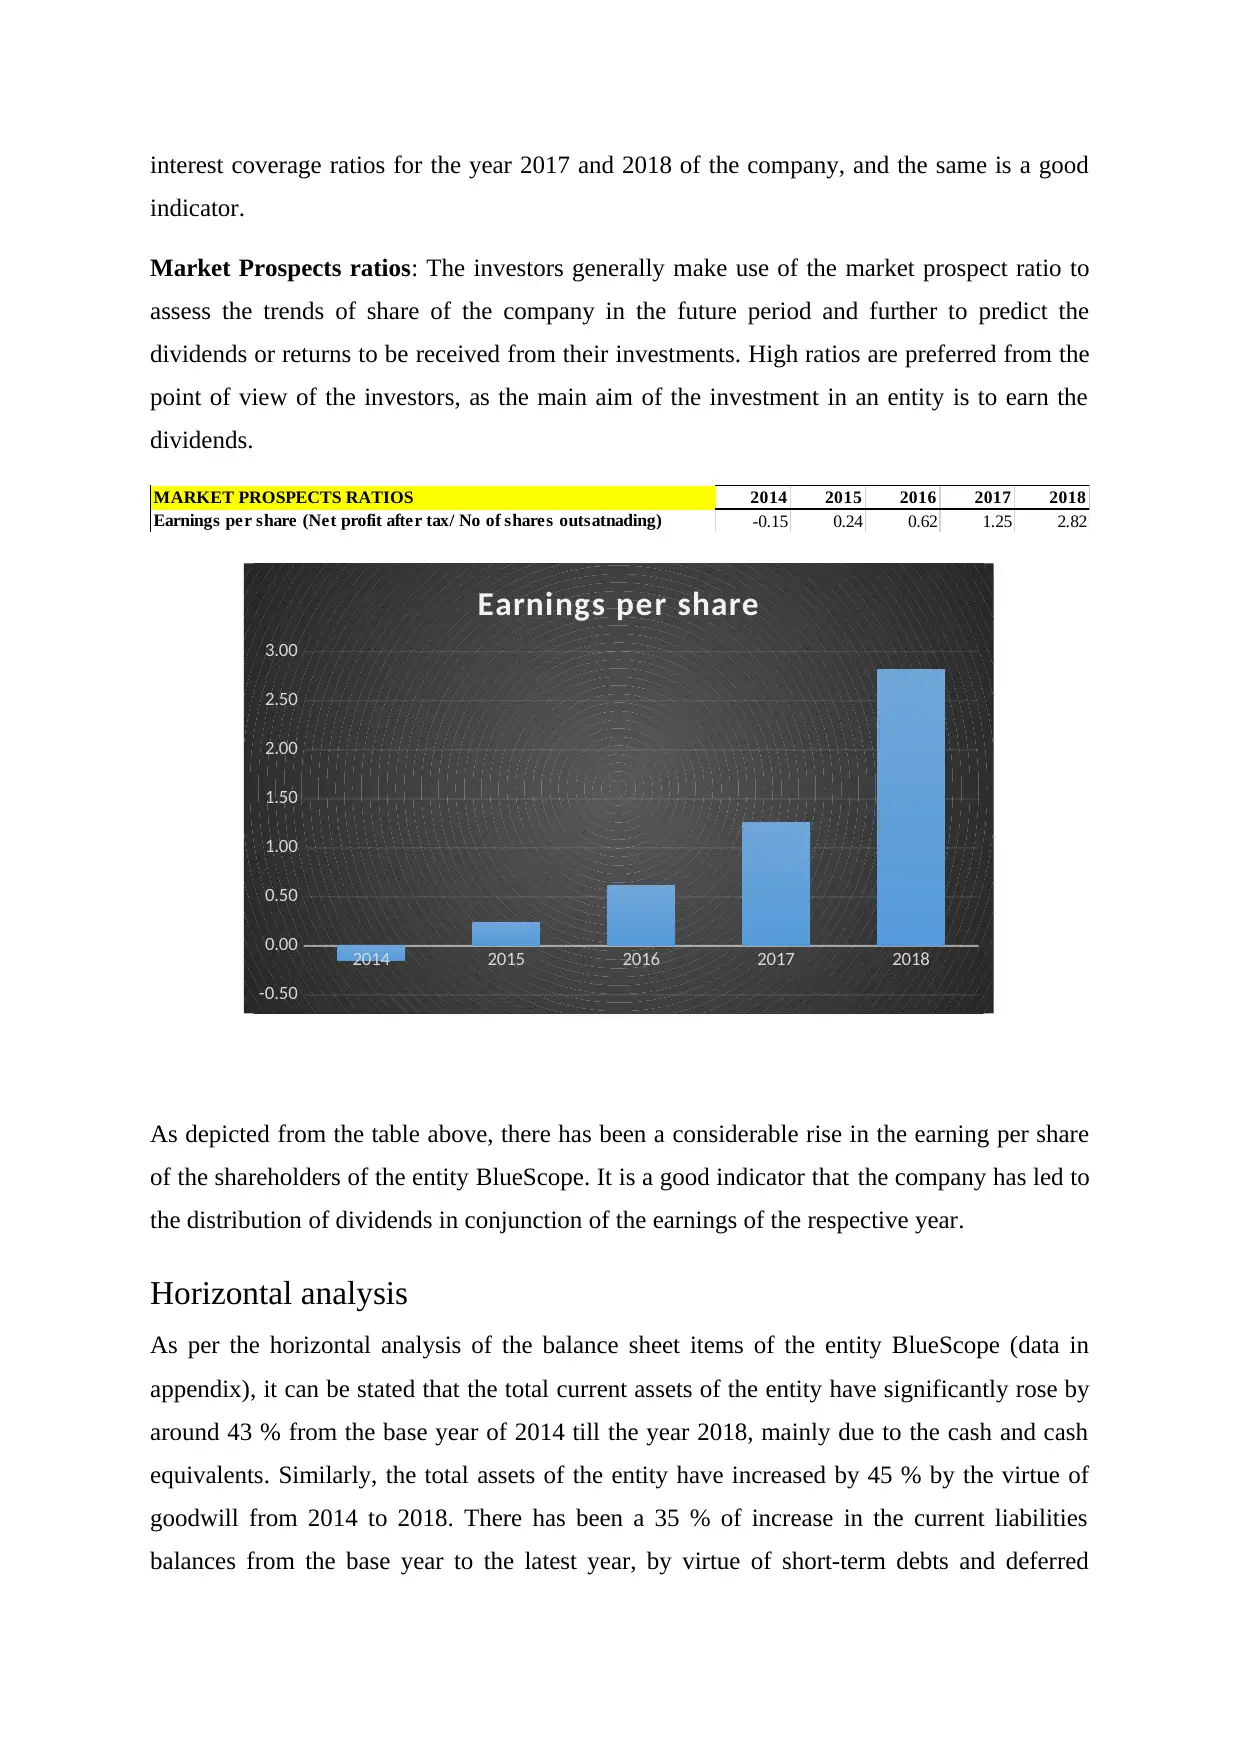
Market Prospects ratios: The investors generally make use of the market prospect ratio to
assess the trends of share of the company in the future period and further to predict the
dividends or returns to be received from their investments. High ratios are preferred from the
point of view of the investors, as the main aim of the investment in an entity is to earn the
dividends.
MARKET PROSPECTS RATIOS 2014 2015 2016 2017 2018
Earnings per share (Net profit after tax/ No of shares outsatnading) -0.15 0.24 0.62 1.25 2.82
As depicted from the table above, there has been a considerable rise in the earning per share
of the shareholders of the entity BlueScope. It is a good indicator that the company has led to
the distribution of dividends in conjunction of the earnings of the respective year.
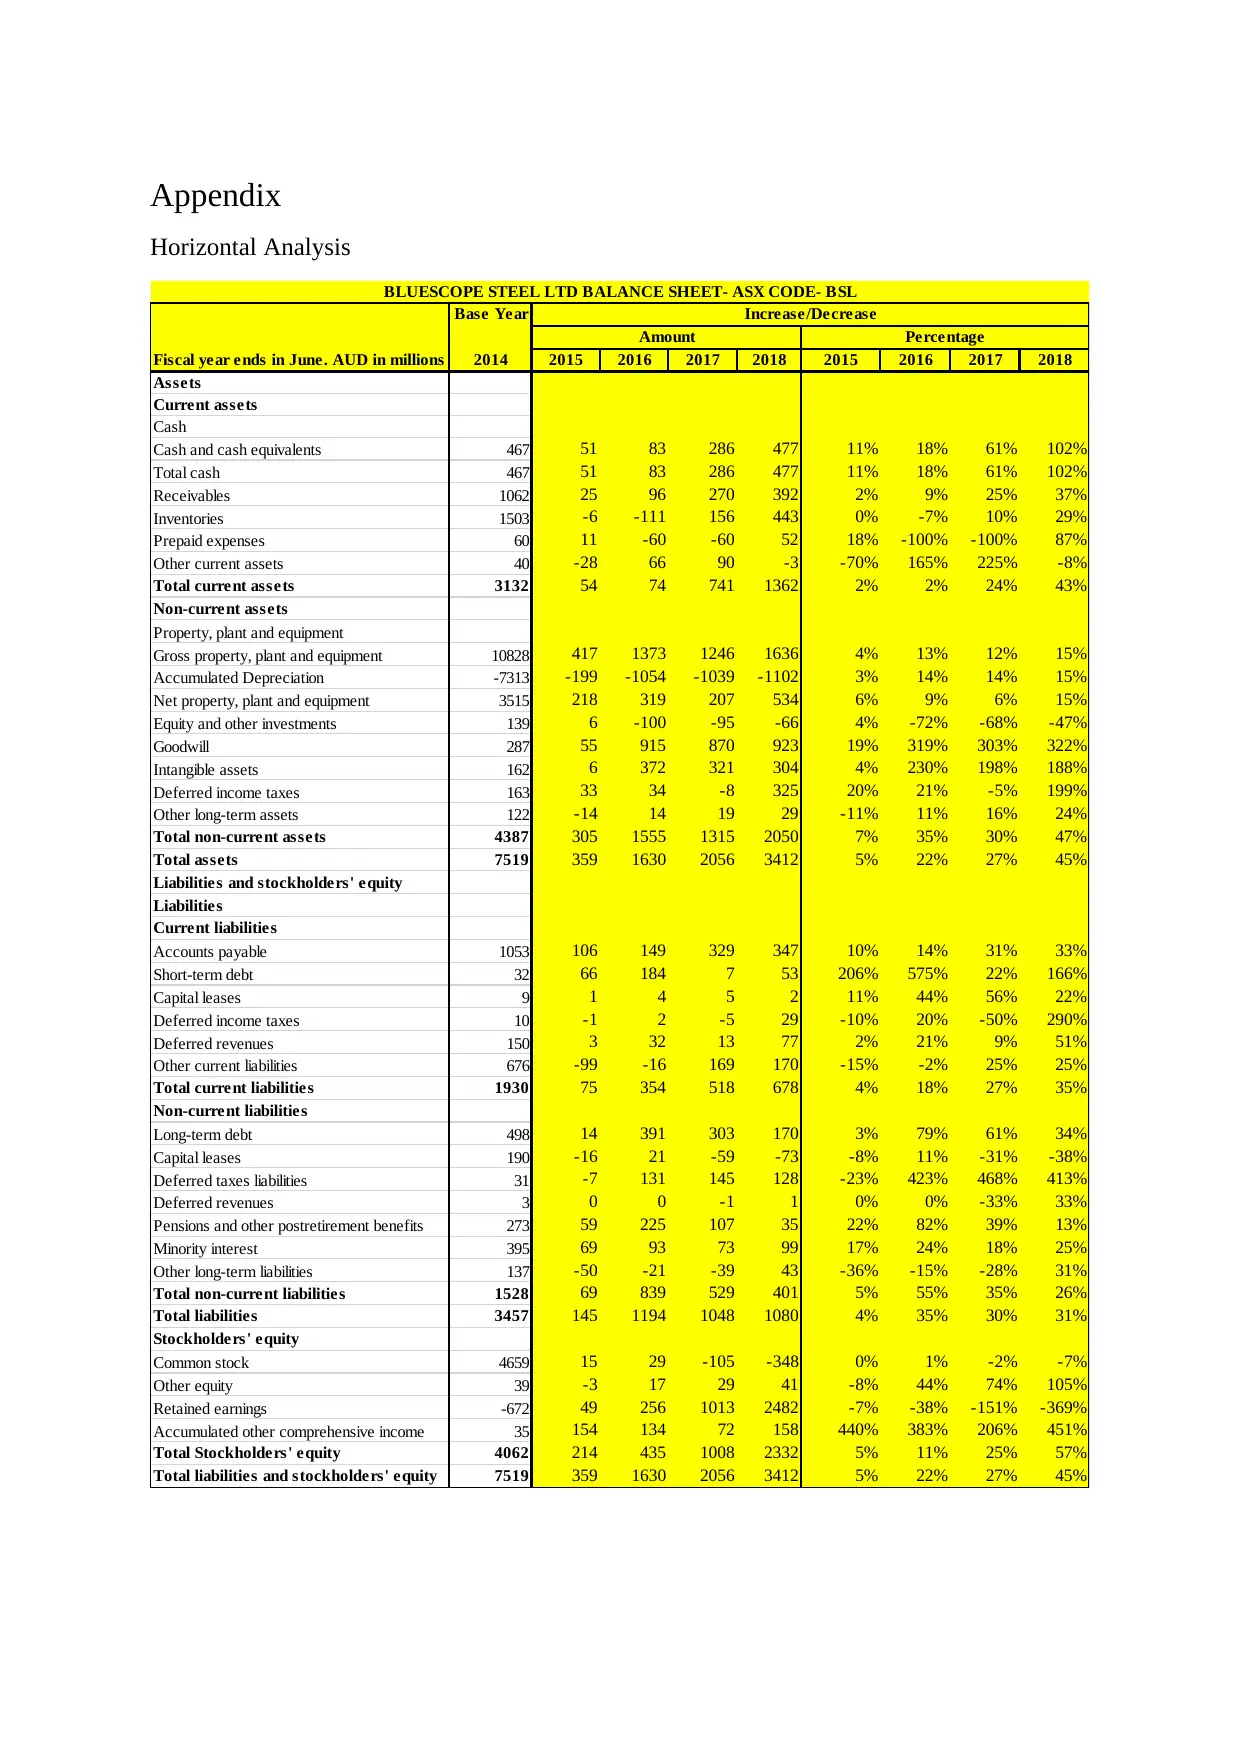
Horizontal analysis
As per the horizontal analysis of the balance sheet items of the entity BlueScope (data in
appendix), it can be stated that the total current assets of the entity have significantly rose by
around 43 % from the base year of 2014 till the year 2018, mainly due to the cash and cash
equivalents. Similarly, the total assets of the entity have increased by 45 % by the virtue of
goodwill from 2014 to 2018. There has been a 35 % of increase in the current liabilities
balances from the base year to the latest year, by virtue of short-term debts and deferred
2014 2015 2016 2017 2018
-0.50
0.00
0.50
1.00
1.50
2.00
2.50
3.00
Earnings per share
indicator.
Market Prospects ratios: The investors generally make use of the market prospect ratio to
assess the trends of share of the company in the future period and further to predict the
dividends or returns to be received from their investments. High ratios are preferred from the
point of view of the investors, as the main aim of the investment in an entity is to earn the
dividends.
MARKET PROSPECTS RATIOS 2014 2015 2016 2017 2018
Earnings per share (Net profit after tax/ No of shares outsatnading) -0.15 0.24 0.62 1.25 2.82
As depicted from the table above, there has been a considerable rise in the earning per share
of the shareholders of the entity BlueScope. It is a good indicator that the company has led to
the distribution of dividends in conjunction of the earnings of the respective year.
Horizontal analysis
As per the horizontal analysis of the balance sheet items of the entity BlueScope (data in
appendix), it can be stated that the total current assets of the entity have significantly rose by
around 43 % from the base year of 2014 till the year 2018, mainly due to the cash and cash
equivalents. Similarly, the total assets of the entity have increased by 45 % by the virtue of
goodwill from 2014 to 2018. There has been a 35 % of increase in the current liabilities
balances from the base year to the latest year, by virtue of short-term debts and deferred
2014 2015 2016 2017 2018
-0.50
0.00
0.50
1.00
1.50
2.00
2.50
3.00
Earnings per share
Paraphrase This Document
Need a fresh take? Get an instant paraphrase of this document with our AI Paraphraser
income taxes. Lastly, in the balance sheet items, there has been a significant increase of 34%
in the long-term debts leading to an overall increase in the total liabilities of 31 percent from
base year to the latest year.
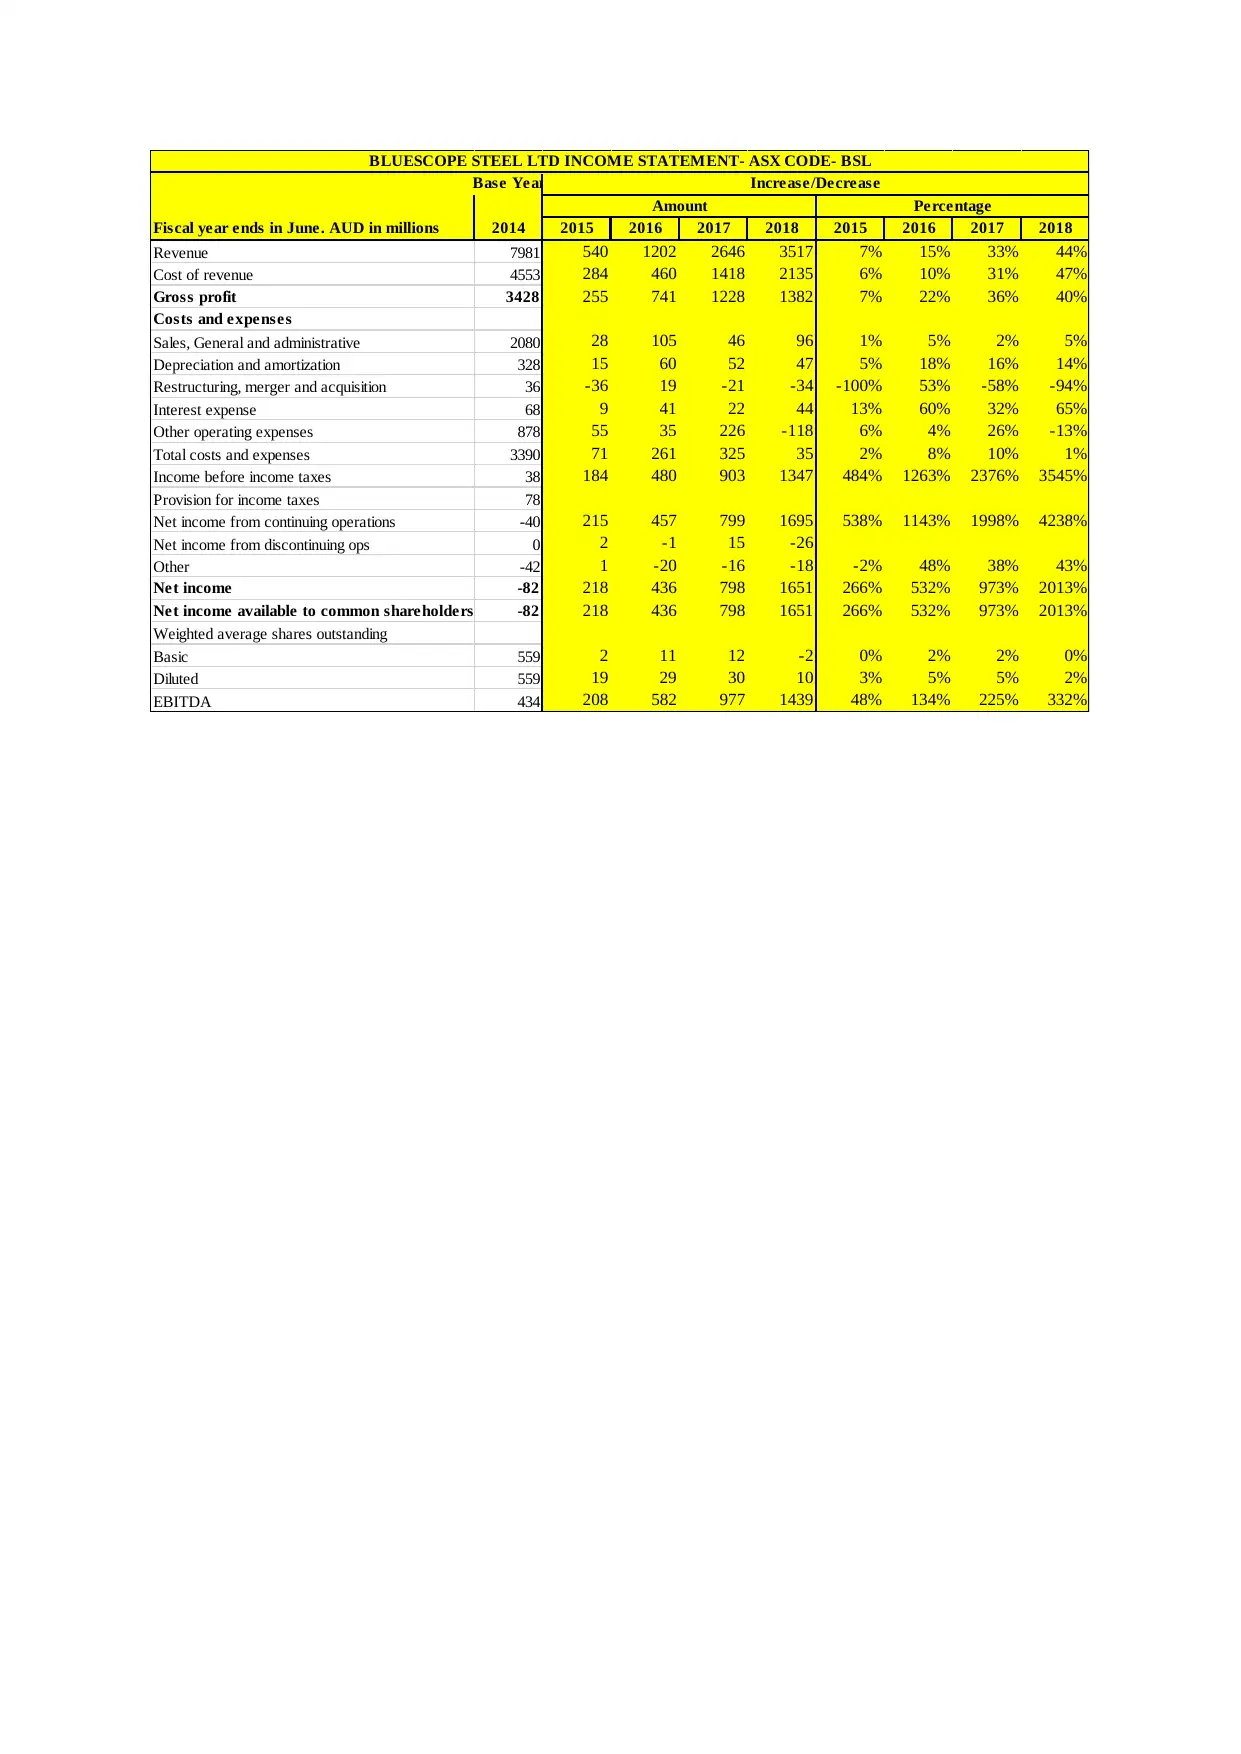
Among the items of the income taxes, there has been a 44 % increase in the revenues of the
entity from the base year leading to an overall 40 % increase in the gross profits of the
company. An overall whopping increase in the net income is also visible with a change of
around 2013%, with the main income being attributed to the income from discontinuing
operations and not much increment in the production costs as against the rises in the
revenues.
Conclusion
The discussions conducted above facilitate to conclude that the interpretation of the financial
statements is a crucial exercise for the various stakeholder groups due to various interests
associated with the company. The evaluation of the financial performance gives an insight of
the financial health and the soundness of the business activities of an entity. The work made
use of the technique of financial ratios computation to evaluate the various aspects of the
business of the entity BlueScope Steels. The evaluation of the performance in terms of year
wise internal comparison and the global trends enable better understanding of the financial
picture. However, it must be noted that the success of a business is beyond the financial
figures, and includes social wellbeing and value addition for the stakeholders as well.
in the long-term debts leading to an overall increase in the total liabilities of 31 percent from
base year to the latest year.
Among the items of the income taxes, there has been a 44 % increase in the revenues of the
entity from the base year leading to an overall 40 % increase in the gross profits of the
company. An overall whopping increase in the net income is also visible with a change of
around 2013%, with the main income being attributed to the income from discontinuing
operations and not much increment in the production costs as against the rises in the
revenues.
Conclusion
The discussions conducted above facilitate to conclude that the interpretation of the financial
statements is a crucial exercise for the various stakeholder groups due to various interests
associated with the company. The evaluation of the financial performance gives an insight of
the financial health and the soundness of the business activities of an entity. The work made
use of the technique of financial ratios computation to evaluate the various aspects of the
business of the entity BlueScope Steels. The evaluation of the performance in terms of year
wise internal comparison and the global trends enable better understanding of the financial
picture. However, it must be noted that the success of a business is beyond the financial
figures, and includes social wellbeing and value addition for the stakeholders as well.
References
BlueScope Steel (2019) We are BlueScope [online] Available from:
https://www.bluescope.com/about-us/ [Accessed on: 30/06/2019].
Delen, D., Kuzey, C., and Uyar, A. (2013) Measuring firm performance using financial
ratios: A decision tree approach. Expert Systems with Applications, 40(10), pp. 3970-3983.
Fridson, M. S., and Alvarez, F. (2011) Financial statement analysis: a practitioner's guide
Vol. 597. UK: John Wiley & Sons.
Higgins, R. C. (2012). Analysis for financial management. UK: McGraw-Hill/Irwin.
Reuters (2019) Flat Steel Market Share Analysis 2018, Updated Top Manufacturers, Global
Industry Size, Growth, Latest Trends, Research Report Forecast 2023 [online] Available
from: https://www.reuters.com/brandfeatures/venture-capital/article?id=88109 [Accessed on:
30/06/2019].
Saleem, Q., and Rehman, R. U. (2011) Impacts of liquidity ratios on profitability.
Interdisciplinary journal of research in business, 1(7), pp. 95-98.
Velnampy, T., and Niresh, J. A. (2012) The relationship between capital structure and
profitability. Global Journal of Management and Business Research, 12(13).
⊘ This is a preview!⊘
Do you want full access?
Subscribe today to unlock all pages.
Trusted by 1+ million students worldwide
Appendix
Horizontal Analysis
Base Year
Fiscal year ends in June. AUD in millions 2014 2015 2016 2017 2018 2015 2016 2017 2018
Assets
Current assets
Cash
Cash and cash equivalents 467 51 83 286 477 11% 18% 61% 102%
Total cash 467 51 83 286 477 11% 18% 61% 102%
Receivables 1062 25 96 270 392 2% 9% 25% 37%
Inventories 1503 -6 -111 156 443 0% -7% 10% 29%
Prepaid expenses 60 11 -60 -60 52 18% -100% -100% 87%
Other current assets 40 -28 66 90 -3 -70% 165% 225% -8%
Total current assets 3132 54 74 741 1362 2% 2% 24% 43%
Non-current assets
Property, plant and equipment
Gross property, plant and equipment 10828 417 1373 1246 1636 4% 13% 12% 15%
Accumulated Depreciation -7313 -199 -1054 -1039 -1102 3% 14% 14% 15%
Net property, plant and equipment 3515 218 319 207 534 6% 9% 6% 15%
Equity and other investments 139 6 -100 -95 -66 4% -72% -68% -47%
Goodwill 287 55 915 870 923 19% 319% 303% 322%
Intangible assets 162 6 372 321 304 4% 230% 198% 188%
Deferred income taxes 163 33 34 -8 325 20% 21% -5% 199%
Other long-term assets 122 -14 14 19 29 -11% 11% 16% 24%
Total non-current assets 4387 305 1555 1315 2050 7% 35% 30% 47%
Total assets 7519 359 1630 2056 3412 5% 22% 27% 45%
Liabilities and stockholders' equity
Liabilities
Current liabilities
Accounts payable 1053 106 149 329 347 10% 14% 31% 33%
Short-term debt 32 66 184 7 53 206% 575% 22% 166%
Capital leases 9 1 4 5 2 11% 44% 56% 22%
Deferred income taxes 10 -1 2 -5 29 -10% 20% -50% 290%
Deferred revenues 150 3 32 13 77 2% 21% 9% 51%
Other current liabilities 676 -99 -16 169 170 -15% -2% 25% 25%
Total current liabilities 1930 75 354 518 678 4% 18% 27% 35%
Non-current liabilities
Long-term debt 498 14 391 303 170 3% 79% 61% 34%
Capital leases 190 -16 21 -59 -73 -8% 11% -31% -38%
Deferred taxes liabilities 31 -7 131 145 128 -23% 423% 468% 413%
Deferred revenues 3 0 0 -1 1 0% 0% -33% 33%
Pensions and other postretirement benefits 273 59 225 107 35 22% 82% 39% 13%
Minority interest 395 69 93 73 99 17% 24% 18% 25%
Other long-term liabilities 137 -50 -21 -39 43 -36% -15% -28% 31%
Total non-current liabilities 1528 69 839 529 401 5% 55% 35% 26%
Total liabilities 3457 145 1194 1048 1080 4% 35% 30% 31%
Stockholders' equity
Common stock 4659 15 29 -105 -348 0% 1% -2% -7%
Other equity 39 -3 17 29 41 -8% 44% 74% 105%
Retained earnings -672 49 256 1013 2482 -7% -38% -151% -369%
Accumulated other comprehensive income 35 154 134 72 158 440% 383% 206% 451%
Total Stockholders' equity 4062 214 435 1008 2332 5% 11% 25% 57%
Total liabilities and stockholders' equity 7519 359 1630 2056 3412 5% 22% 27% 45%
Amount Percentage
BLUESCOPE STEEL LTD BALANCE SHEET- ASX CODE- BSL
Increase/Decrease
Paraphrase This Document
Need a fresh take? Get an instant paraphrase of this document with our AI Paraphraser
Base Year
Fiscal year ends in June. AUD in millions 2014 2015 2016 2017 2018 2015 2016 2017 2018
Revenue 7981 540 1202 2646 3517 7% 15% 33% 44%
Cost of revenue 4553 284 460 1418 2135 6% 10% 31% 47%
Gross profit 3428 255 741 1228 1382 7% 22% 36% 40%
Costs and expenses
Sales, General and administrative 2080 28 105 46 96 1% 5% 2% 5%
Depreciation and amortization 328 15 60 52 47 5% 18% 16% 14%
Restructuring, merger and acquisition 36 -36 19 -21 -34 -100% 53% -58% -94%
Interest expense 68 9 41 22 44 13% 60% 32% 65%
Other operating expenses 878 55 35 226 -118 6% 4% 26% -13%
Total costs and expenses 3390 71 261 325 35 2% 8% 10% 1%
Income before income taxes 38 184 480 903 1347 484% 1263% 2376% 3545%
Provision for income taxes 78
Net income from continuing operations -40 215 457 799 1695 538% 1143% 1998% 4238%
Net income from discontinuing ops 0 2 -1 15 -26
Other -42 1 -20 -16 -18 -2% 48% 38% 43%
Net income -82 218 436 798 1651 266% 532% 973% 2013%
Net income available to common shareholders -82 218 436 798 1651 266% 532% 973% 2013%
Weighted average shares outstanding
Basic 559 2 11 12 -2 0% 2% 2% 0%
Diluted 559 19 29 30 10 3% 5% 5% 2%
EBITDA 434 208 582 977 1439 48% 134% 225% 332%
BLUESCOPE STEEL LTD INCOME STATEMENT- ASX CODE- BSL
Increase/Decrease
Amount Percentage
1 out of 11
Related Documents


Your All-in-One AI-Powered Toolkit for Academic Success.
+13062052269
info@desklib.com
Available 24*7 on WhatsApp / Email
![[object Object]](/_next/static/media/star-bottom.7253800d.svg)
Unlock your academic potential
Copyright © 2020–2026 A2Z Services. All Rights Reserved. Developed and managed by ZUCOL.