Analyzing Demand, Supply, and Economic Models in Business Economics
VerifiedAdded on 2022/11/25
|12
|3140
|449
Report
AI Summary
This report delves into the core principles of contemporary business economics, commencing with a detailed examination of demand and supply dynamics. Task 1 meticulously explores the law of demand, differentiating between movements along the demand curve and shifts in the demand curve, supported by illustrative diagrams. Similarly, the law of supply is analyzed, elucidating movements along the supply curve and shifts in the supply curve, also accompanied by graphical representations. Task 2 broadens the scope by comparing and contrasting emerging economic theories and models of the 21st century with those prevalent in the 20th century, relating both to modern business practices. The report emphasizes the importance of understanding these microeconomic concepts for business growth and success, providing a comprehensive overview of how businesses can adapt to economic changes and leverage various pricing strategies for optimal performance and profit maximization.
Contemporary business
economics
economics
Paraphrase This Document
Need a fresh take? Get an instant paraphrase of this document with our AI Paraphraser
TABLE OF CONTENTS
INTRODUCTION...............................................................................................................3
TASK 1...............................................................................................................................3
LAW OF DEMAND, MOVEMENT ALONG THE SAME DEMAND CURVE..................3
LAW OF SUPPLY, MOVEMENT ALONG THE SAME SUPPLY CURVE.....................5
TASK 2...............................................................................................................................7
CONCLUSION...................................................................................................................9
REFERENCES................................................................................................................11
Books and Journals......................................................................................................11
INTRODUCTION
Contemporary Business Economics are those that will revolve around the different
aspects of economic approaches which are traditional and are also those that are
mostly related with behavioural economics (Mazurek and et.al, 2019). There are
different economic theories that are involved in it which will reflect upon the choices that
are included in quantitative methods of any organisation or a business. It is a
requirement that the quantitative analysis will have to be carry forwarded in order to
determine the factors which are necessary to analyse the diversity of different structures
in the organisation. The entire report will portray different aspects that are related in the
contemporary business economics and that with regard to the practical information
which is derived from an organisation or a business. Its contribution in various factors of
an enterprise are listed and explained in detail.
TASK 1
LAW OF DEMAND, MOVEMENT ALONG THE SAME DEMAND CURVE
The study of demand curve in Economics is said to be one of the crucial component in
order to identify the distinction between movement and shift of the curve which is also
known to be the demand curve. It is a necessity to understand this difference because it
will contribute for a greater change in the policy of economic integration. The demand
curve is said to be a representative aspect of many organisations operation policy
where every organisation is said to be dealing with its goods and services (Rand, 2018).
The demand that is oriented where the different products and services are the
operational activities are said to be affected by the changes that are pertaining and the
sector. Based on these factors and the change that is inhibited there will be a drastic
change in the demand curve. The factors that will contribute for the change name is
demand curve will include the change in demand as well as change in quantity demand.
Movement of demand curve: an organisation will work for the change in quantity as
well as the prices that are oriented where a definite set of product. This is because the
community or the commodity will demand these entities and these factors are said to be
those that are important in determining the choices of the organisation with regard to
customer base. There is also a criteria that is to be ensured which will include the
⊘ This is a preview!⊘
Do you want full access?
Subscribe today to unlock all pages.
Trusted by 1+ million students worldwide
customer choices. The only thing that is constant is the taste of the customer and it can
also change based on the variations that are being taken up by the organisations with
regard to prices and the supply of goods. In such a scenario the demand of the product
will be the same and there will not be any change in customer perception towards the
product but the variation comes in the pricing strategy (Conway and Eckersley, 2017).
With this change in pricing strategy the quantity with which the customer base will
purchase a product or get the services will decrease. This can be regarded as a
movement of the demand curve. The shape of this curve will depend upon the
variations that occur in the organisation with regard to quantity and the Expectations of
the consumers.
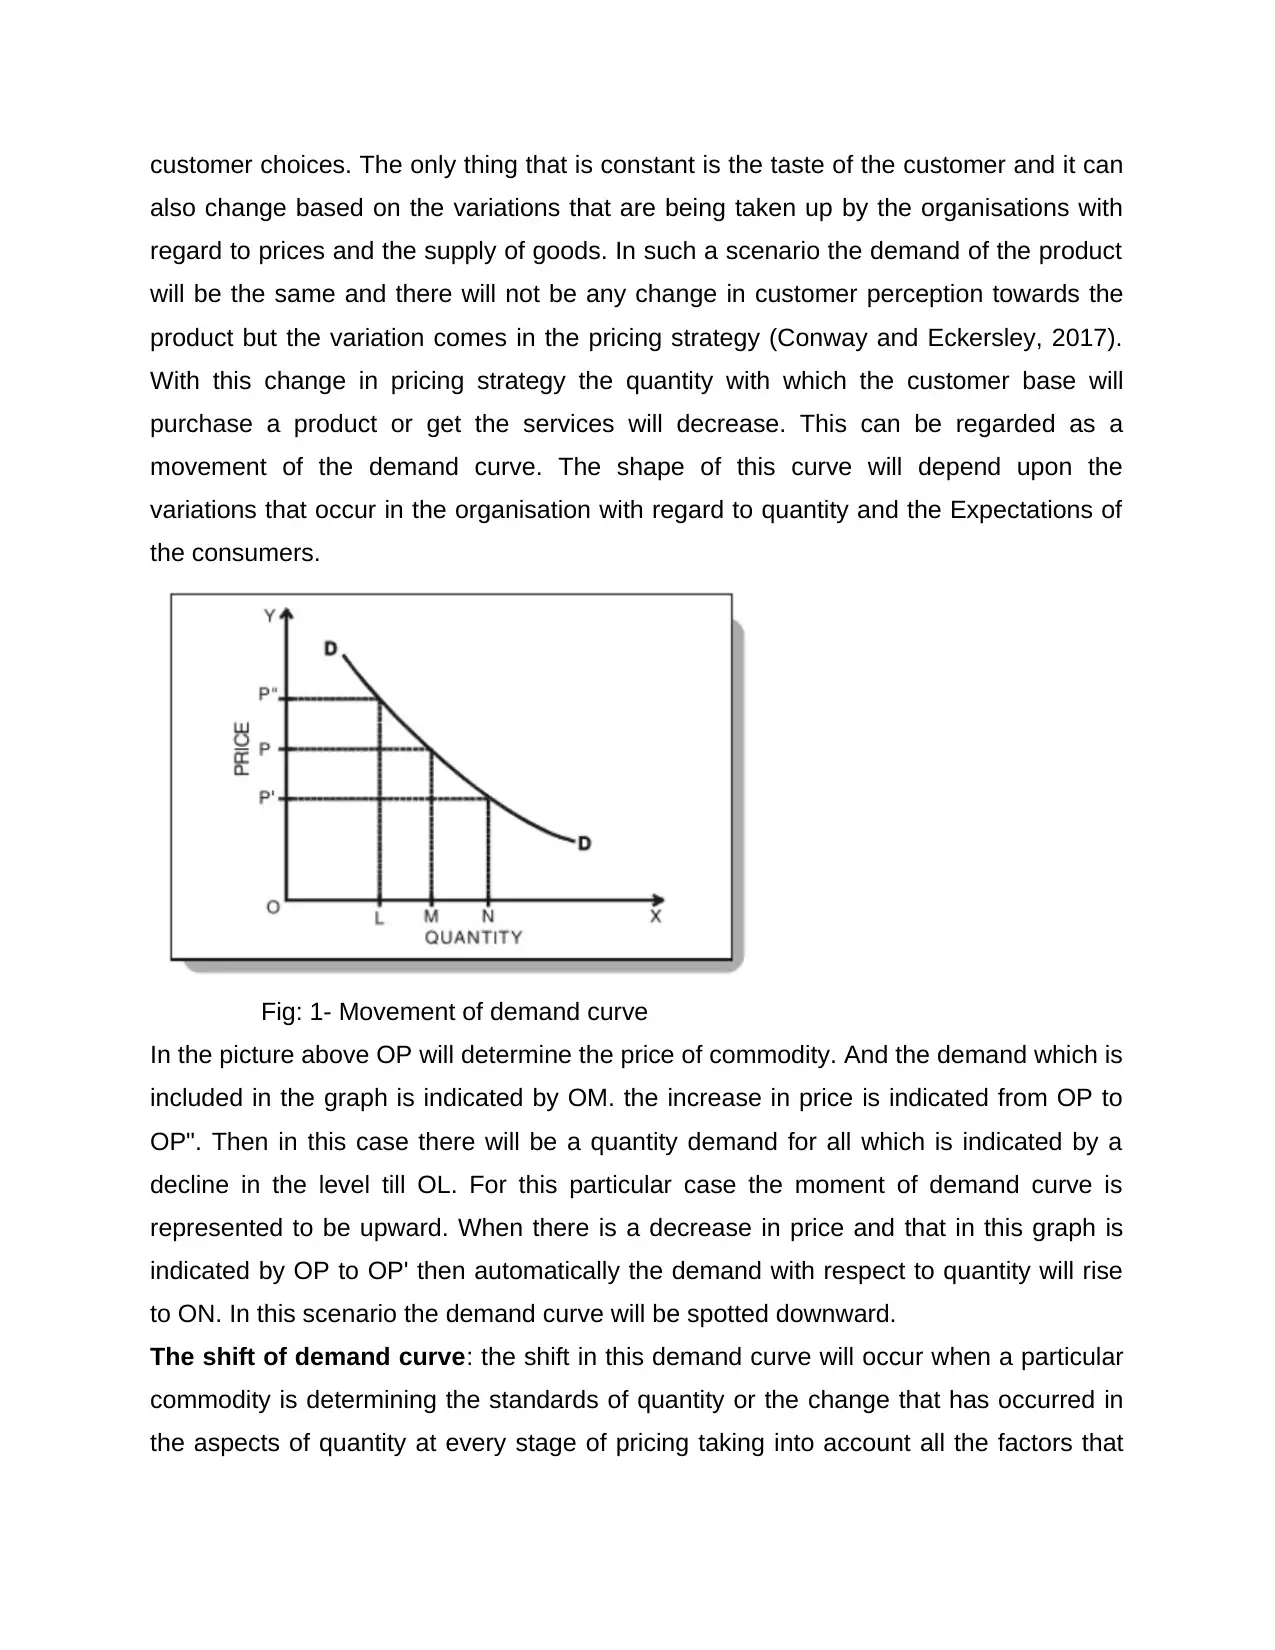
Fig: 1- Movement of demand curve
In the picture above OP will determine the price of commodity. And the demand which is
included in the graph is indicated by OM. the increase in price is indicated from OP to
OP". Then in this case there will be a quantity demand for all which is indicated by a
decline in the level till OL. For this particular case the moment of demand curve is
represented to be upward. When there is a decrease in price and that in this graph is
indicated by OP to OP' then automatically the demand with respect to quantity will rise
to ON. In this scenario the demand curve will be spotted downward.
The shift of demand curve: the shift in this demand curve will occur when a particular
commodity is determining the standards of quantity or the change that has occurred in
the aspects of quantity at every stage of pricing taking into account all the factors that
also change based on the variations that are being taken up by the organisations with
regard to prices and the supply of goods. In such a scenario the demand of the product
will be the same and there will not be any change in customer perception towards the
product but the variation comes in the pricing strategy (Conway and Eckersley, 2017).
With this change in pricing strategy the quantity with which the customer base will
purchase a product or get the services will decrease. This can be regarded as a
movement of the demand curve. The shape of this curve will depend upon the
variations that occur in the organisation with regard to quantity and the Expectations of
the consumers.
Fig: 1- Movement of demand curve
In the picture above OP will determine the price of commodity. And the demand which is
included in the graph is indicated by OM. the increase in price is indicated from OP to
OP". Then in this case there will be a quantity demand for all which is indicated by a
decline in the level till OL. For this particular case the moment of demand curve is
represented to be upward. When there is a decrease in price and that in this graph is
indicated by OP to OP' then automatically the demand with respect to quantity will rise
to ON. In this scenario the demand curve will be spotted downward.
The shift of demand curve: the shift in this demand curve will occur when a particular
commodity is determining the standards of quantity or the change that has occurred in
the aspects of quantity at every stage of pricing taking into account all the factors that
Paraphrase This Document
Need a fresh take? Get an instant paraphrase of this document with our AI Paraphraser
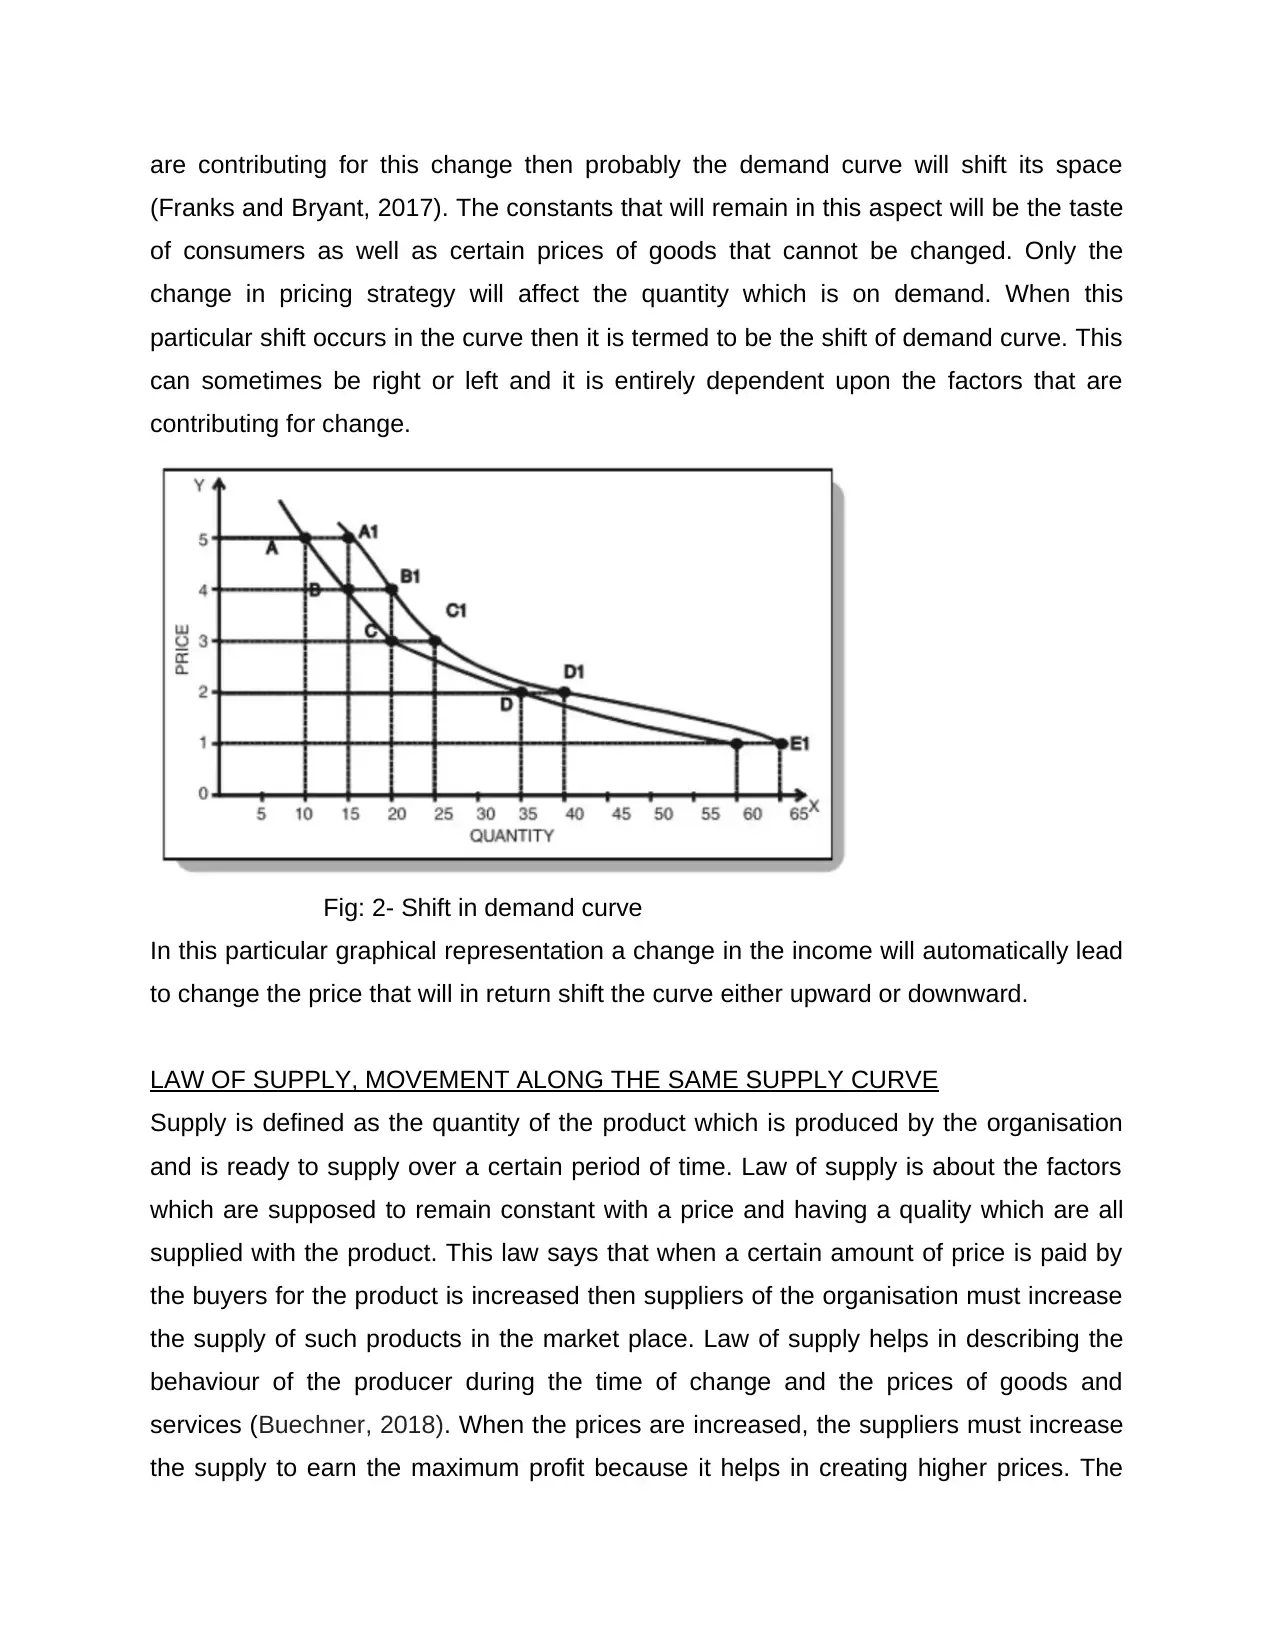
are contributing for this change then probably the demand curve will shift its space
(Franks and Bryant, 2017). The constants that will remain in this aspect will be the taste
of consumers as well as certain prices of goods that cannot be changed. Only the
change in pricing strategy will affect the quantity which is on demand. When this
particular shift occurs in the curve then it is termed to be the shift of demand curve. This
can sometimes be right or left and it is entirely dependent upon the factors that are
contributing for change.
Fig: 2- Shift in demand curve
In this particular graphical representation a change in the income will automatically lead
to change the price that will in return shift the curve either upward or downward.
LAW OF SUPPLY, MOVEMENT ALONG THE SAME SUPPLY CURVE
Supply is defined as the quantity of the product which is produced by the organisation
and is ready to supply over a certain period of time. Law of supply is about the factors
which are supposed to remain constant with a price and having a quality which are all
supplied with the product. This law says that when a certain amount of price is paid by
the buyers for the product is increased then suppliers of the organisation must increase
the supply of such products in the market place. Law of supply helps in describing the
behaviour of the producer during the time of change and the prices of goods and
services (Buechner, 2018). When the prices are increased, the suppliers must increase
the supply to earn the maximum profit because it helps in creating higher prices. The
law of supply says that the higher prices of the products will make the producer supply
more number of quantities in the market. Supply in the market can be represented as an
upward slope which depicts how the quantity of the supplied product will change with
regards to the different price range over a given period of time. Businesses are looking
to increase the revenue and when the prices are more, organisation will produce more
of that products and goods.
Supply curve is the locus of all the points which depicts different quantities of
commodities which an individual is ready to sell at a wide range of prices. This is done
in a given period of time while assuming that the other factors do not change. Supply
curve moves in the upward direction which indicated the direct relation between the
quantity of the products supplied and the price f this product when other factors are kept
constant. The shape produced in the curve shows the characteristics of the
organisation. Supply curve is a process best used for comparison purpose. Along with
this supply curves can be used as a graphical representation of the supply schedules.
Supply schedules are the tabular statements of different quantities of the goods which
the firm is selling at different price levels. If the price of the products changes
depending on the certain consequences then the curve also varies. It is called as the
movement along the slope and shift in the supply curve.
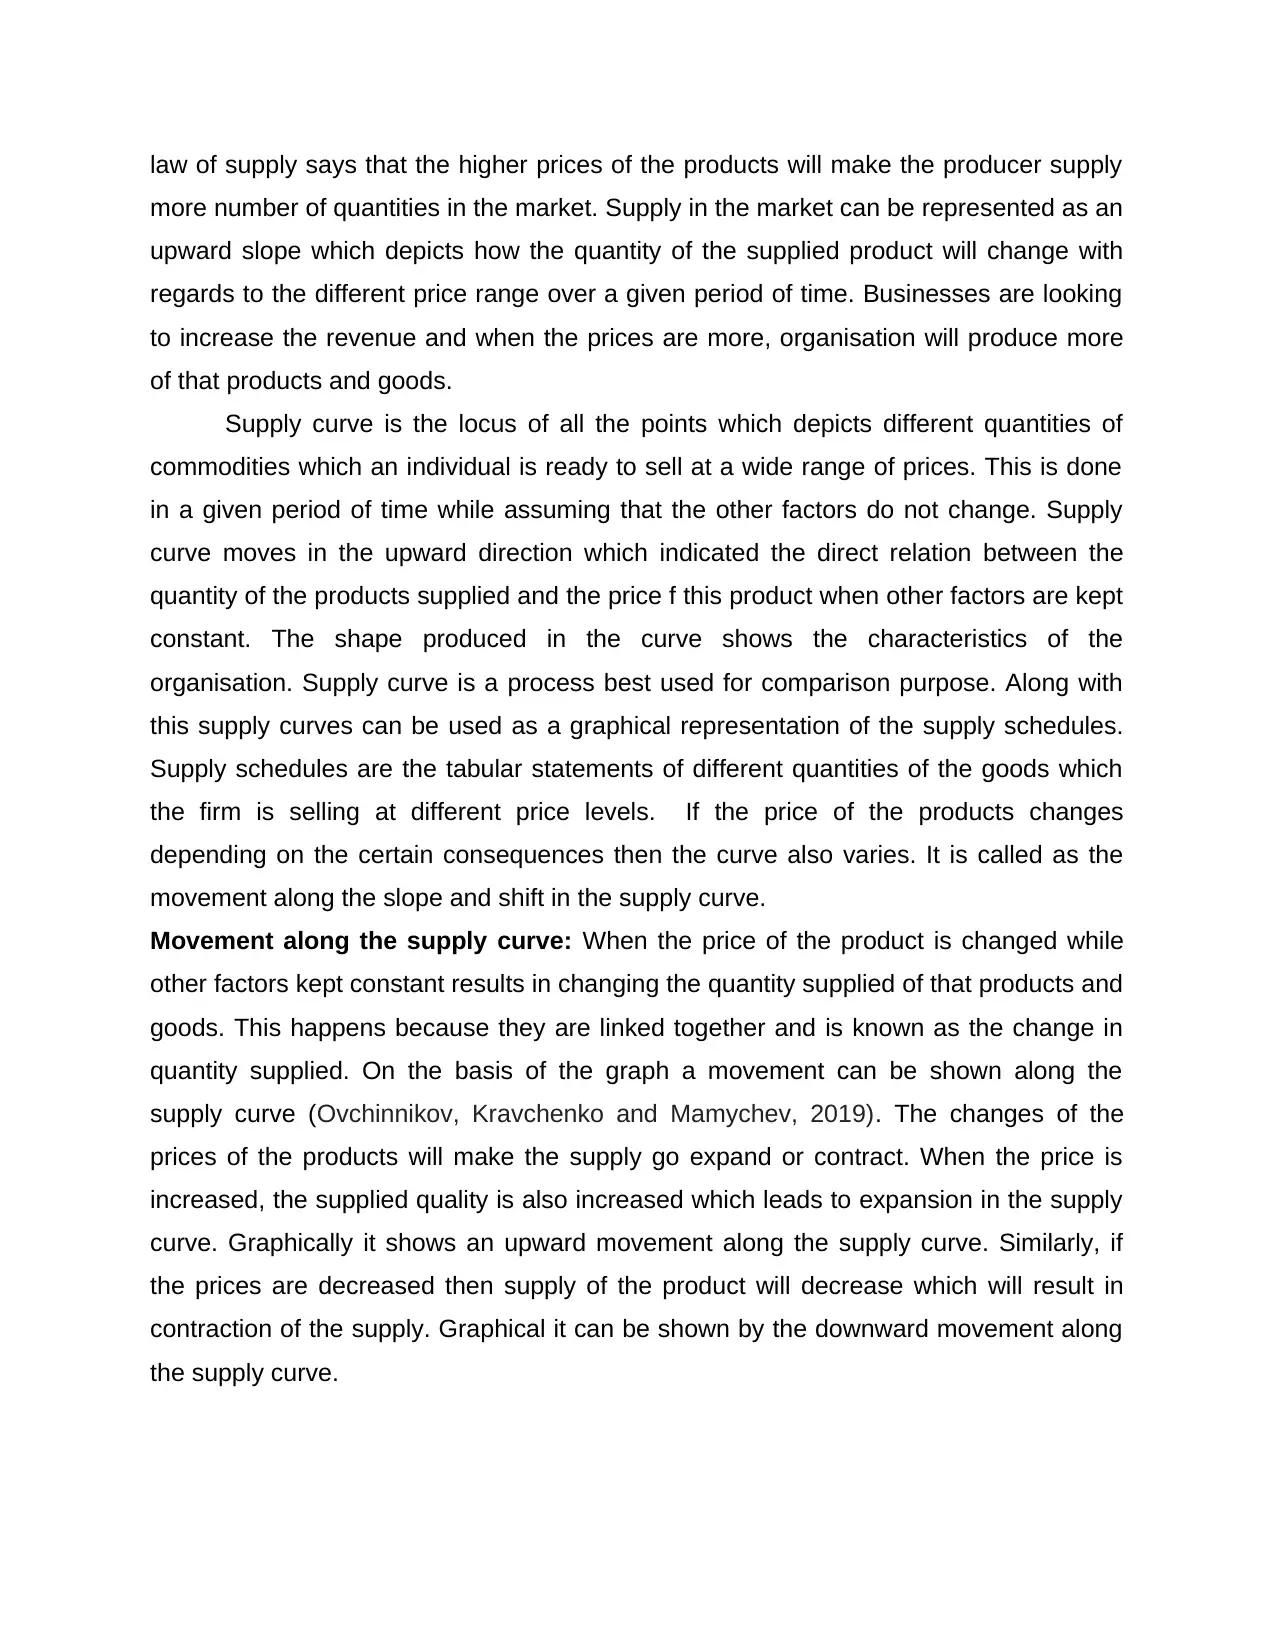
Movement along the supply curve: When the price of the product is changed while
other factors kept constant results in changing the quantity supplied of that products and
goods. This happens because they are linked together and is known as the change in
quantity supplied. On the basis of the graph a movement can be shown along the
supply curve (Ovchinnikov, Kravchenko and Mamychev, 2019). The changes of the
prices of the products will make the supply go expand or contract. When the price is
increased, the supplied quality is also increased which leads to expansion in the supply
curve. Graphically it shows an upward movement along the supply curve. Similarly, if
the prices are decreased then supply of the product will decrease which will result in
contraction of the supply. Graphical it can be shown by the downward movement along
the supply curve.
more number of quantities in the market. Supply in the market can be represented as an
upward slope which depicts how the quantity of the supplied product will change with
regards to the different price range over a given period of time. Businesses are looking
to increase the revenue and when the prices are more, organisation will produce more
of that products and goods.
Supply curve is the locus of all the points which depicts different quantities of
commodities which an individual is ready to sell at a wide range of prices. This is done
in a given period of time while assuming that the other factors do not change. Supply
curve moves in the upward direction which indicated the direct relation between the
quantity of the products supplied and the price f this product when other factors are kept
constant. The shape produced in the curve shows the characteristics of the
organisation. Supply curve is a process best used for comparison purpose. Along with
this supply curves can be used as a graphical representation of the supply schedules.
Supply schedules are the tabular statements of different quantities of the goods which
the firm is selling at different price levels. If the price of the products changes
depending on the certain consequences then the curve also varies. It is called as the
movement along the slope and shift in the supply curve.
Movement along the supply curve: When the price of the product is changed while
other factors kept constant results in changing the quantity supplied of that products and
goods. This happens because they are linked together and is known as the change in
quantity supplied. On the basis of the graph a movement can be shown along the
supply curve (Ovchinnikov, Kravchenko and Mamychev, 2019). The changes of the
prices of the products will make the supply go expand or contract. When the price is
increased, the supplied quality is also increased which leads to expansion in the supply
curve. Graphically it shows an upward movement along the supply curve. Similarly, if
the prices are decreased then supply of the product will decrease which will result in
contraction of the supply. Graphical it can be shown by the downward movement along
the supply curve.
⊘ This is a preview!⊘
Do you want full access?
Subscribe today to unlock all pages.
Trusted by 1+ million students worldwide
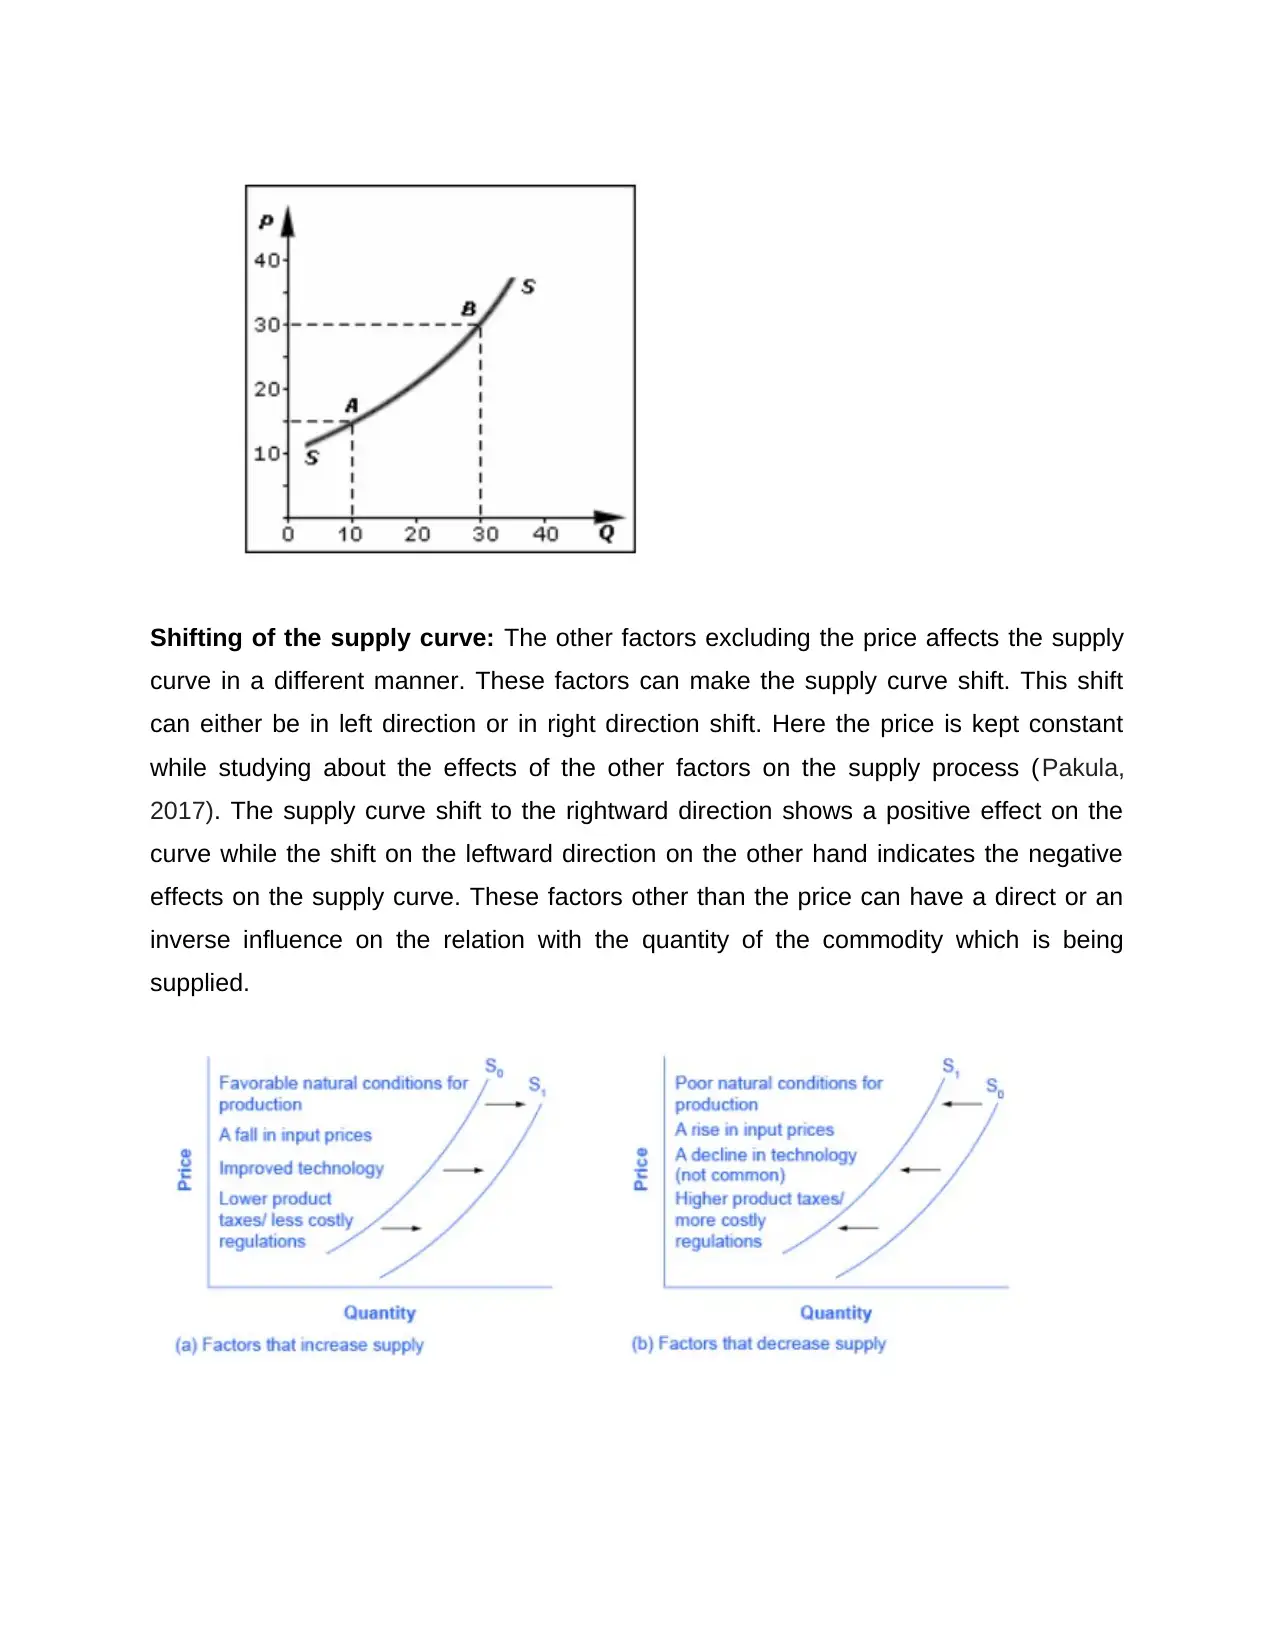
Shifting of the supply curve: The other factors excluding the price affects the supply
curve in a different manner. These factors can make the supply curve shift. This shift
can either be in left direction or in right direction shift. Here the price is kept constant
while studying about the effects of the other factors on the supply process (Pakula,
2017). The supply curve shift to the rightward direction shows a positive effect on the
curve while the shift on the leftward direction on the other hand indicates the negative
effects on the supply curve. These factors other than the price can have a direct or an
inverse influence on the relation with the quantity of the commodity which is being
supplied.
Paraphrase This Document
Need a fresh take? Get an instant paraphrase of this document with our AI Paraphraser
TASK 2
Companies offering have to develop and economic structure in which its proper
working is being done accordingly. This is an important step because of the fact that
since companies are having a large number of customer base and large employee
workforce due to which high amount of cash flow within the organisational can be see in
hands appropriate measures have to be taken in such a way that proper documentation
and management of the fund can be evaluated] (Jarmin, 2019). There are several
technological advancements which have been seen in the recent year in terms of
managing a company's financial performance in the Marketplace to analyse various
organisational situations and then on that basis have to take appropriate strategy
through which significance of the associated risk can be reduced. In the current time
since a drastic change within organisational working is being seen in cases like the use
of online E-Commerce activities and traditional in store sales. Due to which
improvisation within the economic fund management approach has to be taken such
that analysis of company's performance can be accomplished. This is often being
affected with several associated factors as will like the the marketing approach pay
scale companies working in terms of implementing innovation the industry in which it
operates and several other factors have to be taken into consideration. This is an
important step because the pricing is being set on the basis of services or products
which the company provides to its customers with its performance within the
Marketplace that is why various pricing strategies can be used by a company like
competitive pricing strategy premium pricing strategy, penetration market strategy,
hourly pricing strategy or many more as per the requirement of the business (Akcigit
and et.al, 2018). With this approach company's tendency like being and mass market
product or and luxury product is being classified and hence on that basis specific
targeted customer base is been chosen accordingly for performing business activities
by which companies guarantee that appropriate measures are being taken to enhance
its work productivity while reducing the initial expenditures so that high profit and return
of investment can be enhanced and hence a strong economic growth can be
accomplished. The pricing approach which is being used by the corporate where is with
time and has laid to several economic management strategies and models which are
the companies primarily used in the early stages like 21st century and the improvised
version of economic performance evaluation strategy in the 21st century.
Early stages, in the early stages company stands to operate in in Marketplace
which was having a low market competition and since lack of technological
advancement was also and key element which affected businesses and their
performance within the Marketplace. While also the company's performance was being
analysed on the basis of supply and demand model in which the prophet it was been
analysed while also evaluating the significance of the customer demands and
company's approach to meet the demand (Jordà, Singh and Taylor, 2020). This
approach of using supply and demand business is tends to evaluate there profit margin
and it was being used accordingly as per the requirement to forecast the increment and
decrement of sales for developing strategy so that products can be developed in an
appropriate quantity e so that risk associated with accurate amount of products can be
developed in such a way that product is not able to see the shortages within the market
while also is not been developed in excess quantity so that return of investment is being
affected. This is an important step for the business is because it has to guarantee that it
is having sustainable budget for maintaining its efficient performance which will
strengthen the sustainability within the market place. Well also by taking appropriate
measures significance of the associated elements can be reduced. In the early stages
company's economic growth was also being affected because it has to use
intermediates for distributing its products to the end customers this has lead two high
initial Investments for developing products and distributing it to and customer specific
area for achieving sales (Borrelli and et.al, 2017). This was being developed with the
use of push pull strategy in which a demand was created in the customers and then
appropriate measures have to be taken for achieving desired target Now since
intermediates were being associated within the distribution channel due to which the
return of investment was facing shortages and the final pricing being set on the product
also has to be increased to meet it the desired profit margin.
In the current time businesses are using technological advancements for
performing business activities and are selling their products through offline stores as
well as through company website and mobile applications (Krausmann and et.al, 2017).
⊘ This is a preview!⊘
Do you want full access?
Subscribe today to unlock all pages.
Trusted by 1+ million students worldwide
Because of which high returns of investment is being achieved therefore businesses
have to develop a proper working strategy in such a way that significance of the
associate financial risk can be minimised. In order to accomplish this overall companies
loopholes and which initial investments has to be done are being identified while
analysing the forecasted sales on that basis strategy and budget is being developed.
This is primarily being done in context with the customer touch points which the
corporate is having and on that basis suitable measures can be taken with which
desired high work productivity can be accomplished while also at the same time suitable
measures can also be taken to meet the expected sales and profit margin.
CONCLUSION
It can be concluded that the demand and supply processes builds the foundation
for any business. Every business must consider and understand with the concepts of
demand and supply. The analysis of these parameters will help in the growth and
success of the business of an organisation. It is shown that the law of demand shows
the relation of demands and price of the product. It can be seen that the demand curve
changes with the demand of the product. The law of supply describes the relation
between supply of the product, its quantity and prices. The movement of these curves
are changed along the curve and also shift when the other factors are changed not kept
constant. There are many theories used in the report to contemporary economics while
relating it to the modern business.
Paraphrase This Document
Need a fresh take? Get an instant paraphrase of this document with our AI Paraphraser
REFERENCES
Books and Journals
Akcigit, U. and et.al, 2018. Taxation and Innovation in the 20th Century (No. w24982).
National Bureau of Economic Research.
Borrelli, P. and et.al, 2017. An assessment of the global impact of 21st century land use
change on soil erosion. Nature communications. 8(1). pp.1-13.
Buechner, M.N., 2018. A comment on the law of supply and demand. Journal of
Philosophical Economics. 11(2). pp.67-80.
Conway and Eckersley, 2017. When does law enforcement's demand to read your data
become a demand to read your mind?. Communications of the ACM. 60(9). pp.38-
40.
Franks and Bryant, 2017. The Uncompensated Law of Demand: A ‘Revealed
Preference’approach. Economics Letters. 152. pp.105-111.
Jarmin, R.S., 2019. Evolving measurement for an evolving economy: thoughts on 21st
century US economic statistics. Journal of Economic Perspectives, 33(1), pp.165-
84.
Jordà, Ò., Singh, S.R. and Taylor, A.M., 2020. Longer-run economic consequences of
pandemics (No. w26934). National Bureau of economic research.
Krausmann, F. and et.al, 2017. Global socioeconomic material stocks rise 23-fold over
the 20th century and require half of annual resource use. Proceedings of the
National Academy of Sciences. 114(8). pp.1880-1885.
Mazurek and et.al, 2019. The law of demand and the loss of confidence effect: An
experimental study. Heliyon. 5(11). p.e02685.
Ovchinnikov, A.I., Kravchenko, A.G. and Mamychev, A.Y., 2019. Risks in the Processes
of Digitalization of Law and Supply Chain Strategy in Economic Relations. Int. J
Sup. Chain. Mgt Vol. 8(6). p.513.
Pakula, J.R., 2017. Integrating Purchasing and Contract Law in Supply Chain
Management Education.
Rand, 2018. Social justice as a professional duty: Effectively meeting law student
demand for social justice by teaching social justice as a professional competency.
U. Cin. L. Rev.. 87. p.77.

⊘ This is a preview!⊘
Do you want full access?
Subscribe today to unlock all pages.
Trusted by 1+ million students worldwide
1 out of 12
Related Documents


Your All-in-One AI-Powered Toolkit for Academic Success.
+13062052269
info@desklib.com
Available 24*7 on WhatsApp / Email
![[object Object]](/_next/static/media/star-bottom.7253800d.svg)
Unlock your academic potential
Copyright © 2020–2026 A2Z Services. All Rights Reserved. Developed and managed by ZUCOL.