Business Economics: Analyzing Demand, Supply, and Economic Theories
VerifiedAdded on 2023/06/14
|13
|3099
|373
Report
AI Summary
This report provides a comprehensive analysis of business economics, focusing on the laws of demand and supply, factors influencing movements along and shifts in demand and supply curves, and a comparison of emerging economic theories in the 21st century with those of the 20th century. It explains the inverse relationship between price and quantity demanded, highlighting factors like income, taste, and prices of related goods that cause shifts in the demand curve. The report also details the direct relationship between price and quantity supplied, discussing how technology, input costs, the number of firms, and taxes affect the supply curve. Furthermore, it compares and contrasts the nudge theory, a prominent 21st-century concept, with traditional macroeconomic models, emphasizing its role in behavioral economics and decision-making. Desklib offers this report as a resource for students, providing access to past papers and solved assignments to aid in their studies.
BM533 Contemporary
Business Economics
Business Economics
Paraphrase This Document
Need a fresh take? Get an instant paraphrase of this document with our AI Paraphraser

Contents
INTRODUCTION................................................................................................................................4
MAIN BODY........................................................................................................................................4
1.1 Explaining the law of supply, factors causing movement along the same demand curve and the
shift in the demand curve......................................................................................................................4
1.2 Explaining the law of supply, factors causing the movements in the supply curve and shift in
the supply curve................................................................................................................................7
TASK 2..................................................................................................................................................10
Comparing and contrasting the emerging theories and models in the 21st century economics with
the 20th century...............................................................................................................................10
CONCLUSION.......................................................................................................................................12
REFERENCES..................................................................................................................................13
INTRODUCTION
Business economics refers to the area of the applied economics which used
to study the financial, market-related, environmental and organizational issues faced
by the organizations. It includes the process such as concept of scarcity, distribution,
consumption, etc. Contemporary issues in the economics are related to the
management of the human resources, production, marketing and operations of the
business. This report will outline the meaning of aw of demand and the factors which
causes the movement along the demand curve with the help of diagram. Further it
will outline the factors which used to shift the demand curve to the new position with
⊘ This is a preview!⊘
Do you want full access?
Subscribe today to unlock all pages.
Trusted by 1+ million students worldwide
the help of diagram. This report will also evaluate the meaning of law of supply and
the factors which are causing movement along the supply curve with the help of
diagram. At last it will outline the factors which shift the supply curve to the new
position.
MAIN BODY
1.1 Explaining the law of supply, factors causing movement along the
same demand curve and the shift in the demand curve
Law of demand
Law of demand is referred as the fundamental principle of the economics. It
basically works with the law of supply which makes the know about the market
conditions. This also explains the market conditions in order to allocate the resources
and used to determine the prices of the given goods and services in our day-to-day life.
This states that the quantity of the products is inversely related to the price of the
products (Inoua and Smith, 2020). It means products which are having higher prices
having the lower demand in the market and the products having the low prices having
the high demand in the market. This happens because of the diminishing marginal
utility, that means the consumer will satisfy his urgent needs first and then he will add
the extra product in his consumption. As demand is the important factor in the market
level and at the personal level also. It makes the people to know that the other factors
are remain constant and there will be inverse change in the prices and quantity of the
product and services. It also refers that when the value for the one product increases
than the quantity and demand for that product will fall (Allen, 2019). The law of
demand is important to identify the opportunities to buy those goods which are under-
priced. The demand curve of the law of demand is sloping downwards as prices and
quantity are inversely related.
Factors causes movement along the demand curve
Movement along the demand curve shows the change in the price and
quantity demanded in the market, from one point to another point. Other things
remain constant when there is change in the quantity with the change in the price of
the goods (Dinga, 2018). The movement in the demand curve is only due to the
Paraphrase This Document
Need a fresh take? Get an instant paraphrase of this document with our AI Paraphraser
change in the prices of the product and services. It the prices of the goods and
services increases than the demand of the products is contracted. For example, if
there is increase in the prices of the Tesco’s product than it will decrease the
quantity demanded in the market. As price is the main and important factor that
affects the demands of the consumer in the market.
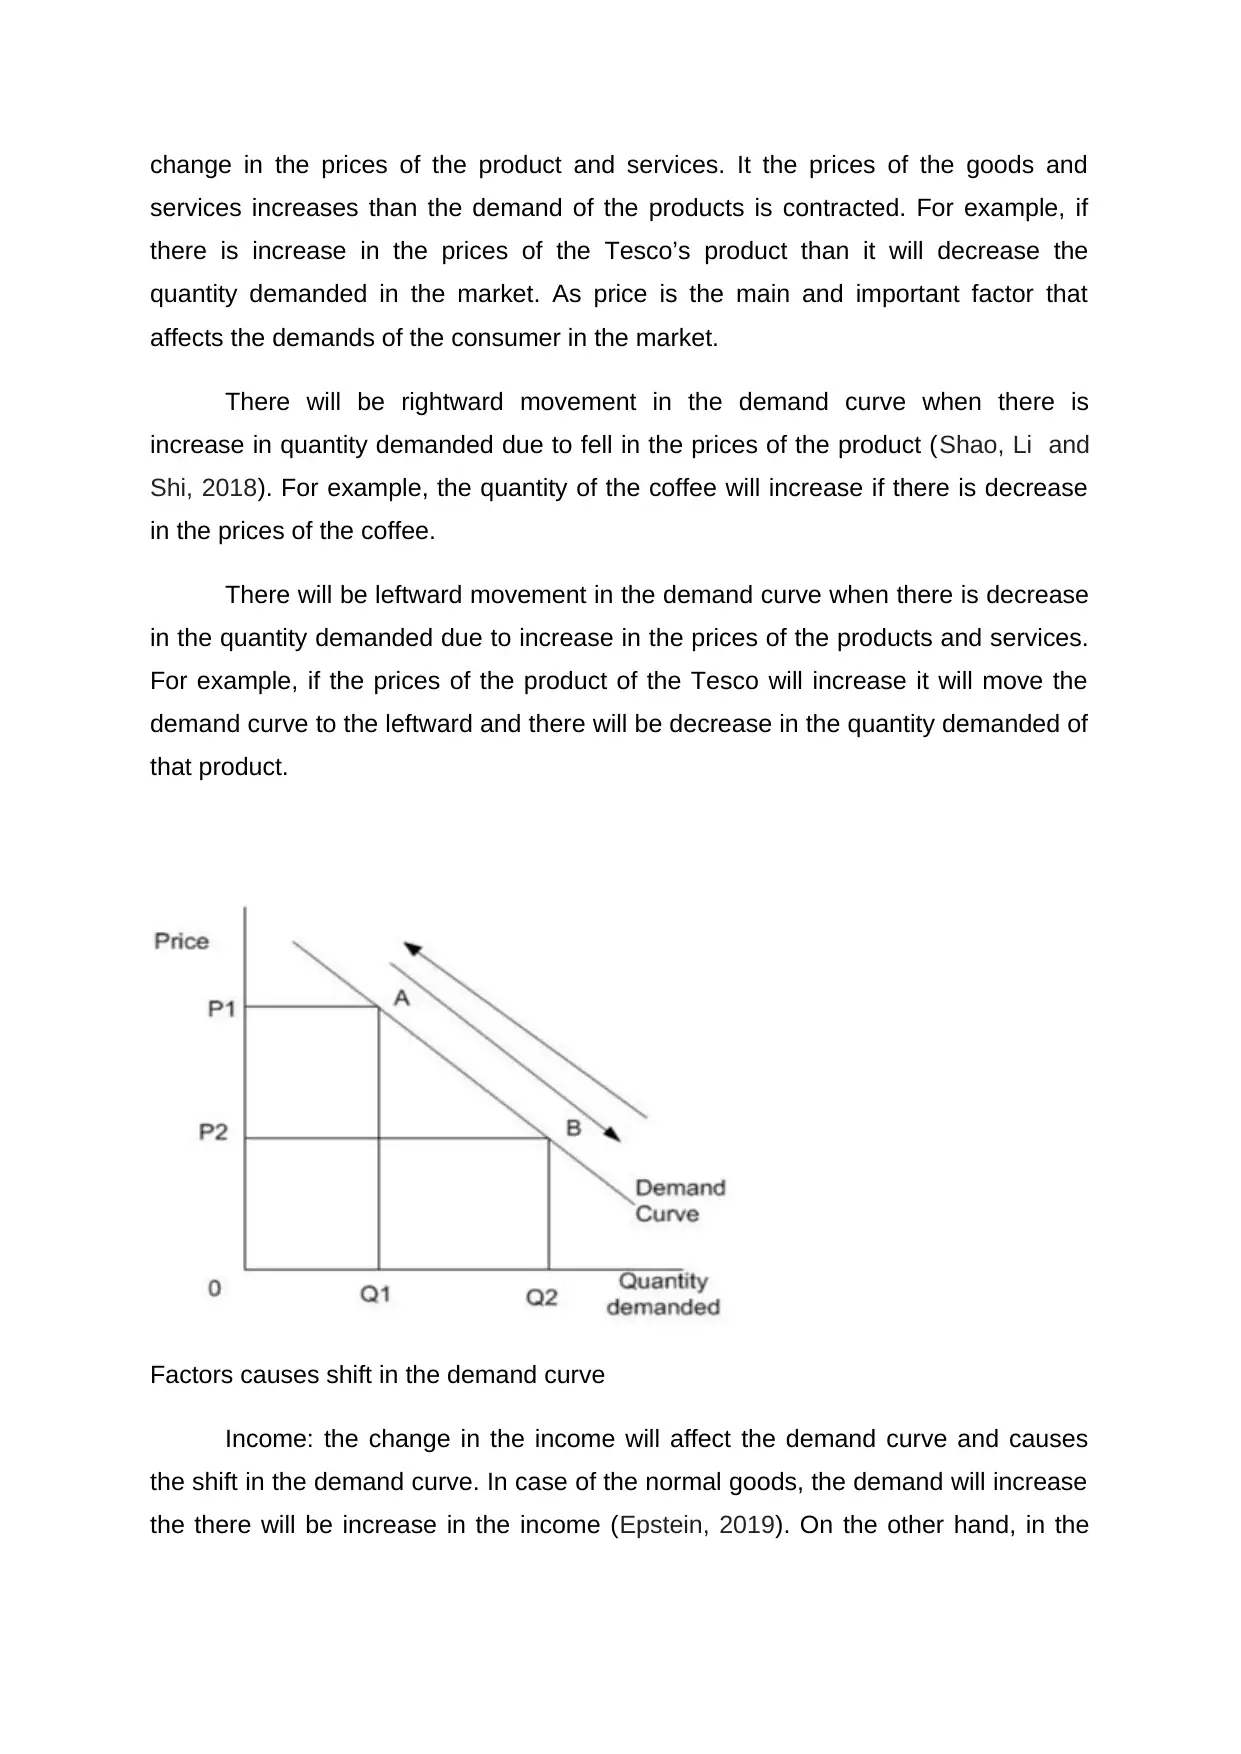
There will be rightward movement in the demand curve when there is
increase in quantity demanded due to fell in the prices of the product (Shao, Li and
Shi, 2018). For example, the quantity of the coffee will increase if there is decrease
in the prices of the coffee.
There will be leftward movement in the demand curve when there is decrease
in the quantity demanded due to increase in the prices of the products and services.
For example, if the prices of the product of the Tesco will increase it will move the
demand curve to the leftward and there will be decrease in the quantity demanded of
that product.
Factors causes shift in the demand curve
Income: the change in the income will affect the demand curve and causes
the shift in the demand curve. In case of the normal goods, the demand will increase
the there will be increase in the income (Epstein, 2019). On the other hand, in the
services increases than the demand of the products is contracted. For example, if
there is increase in the prices of the Tesco’s product than it will decrease the
quantity demanded in the market. As price is the main and important factor that
affects the demands of the consumer in the market.
There will be rightward movement in the demand curve when there is
increase in quantity demanded due to fell in the prices of the product (Shao, Li and
Shi, 2018). For example, the quantity of the coffee will increase if there is decrease
in the prices of the coffee.
There will be leftward movement in the demand curve when there is decrease
in the quantity demanded due to increase in the prices of the products and services.
For example, if the prices of the product of the Tesco will increase it will move the
demand curve to the leftward and there will be decrease in the quantity demanded of
that product.
Factors causes shift in the demand curve
Income: the change in the income will affect the demand curve and causes
the shift in the demand curve. In case of the normal goods, the demand will increase
the there will be increase in the income (Epstein, 2019). On the other hand, in the
case of the inferior goods, the demand of the goods will decrease as the income will
increase of the person.
Taste and preferences: When the goods and services are in the fashion, its
demand curve will have the shifts to the rightward (Newman and Ferrario, 2020). On
the other hand, when the taste and preferences are out of trend the demand curve
will shifts to the leftward.
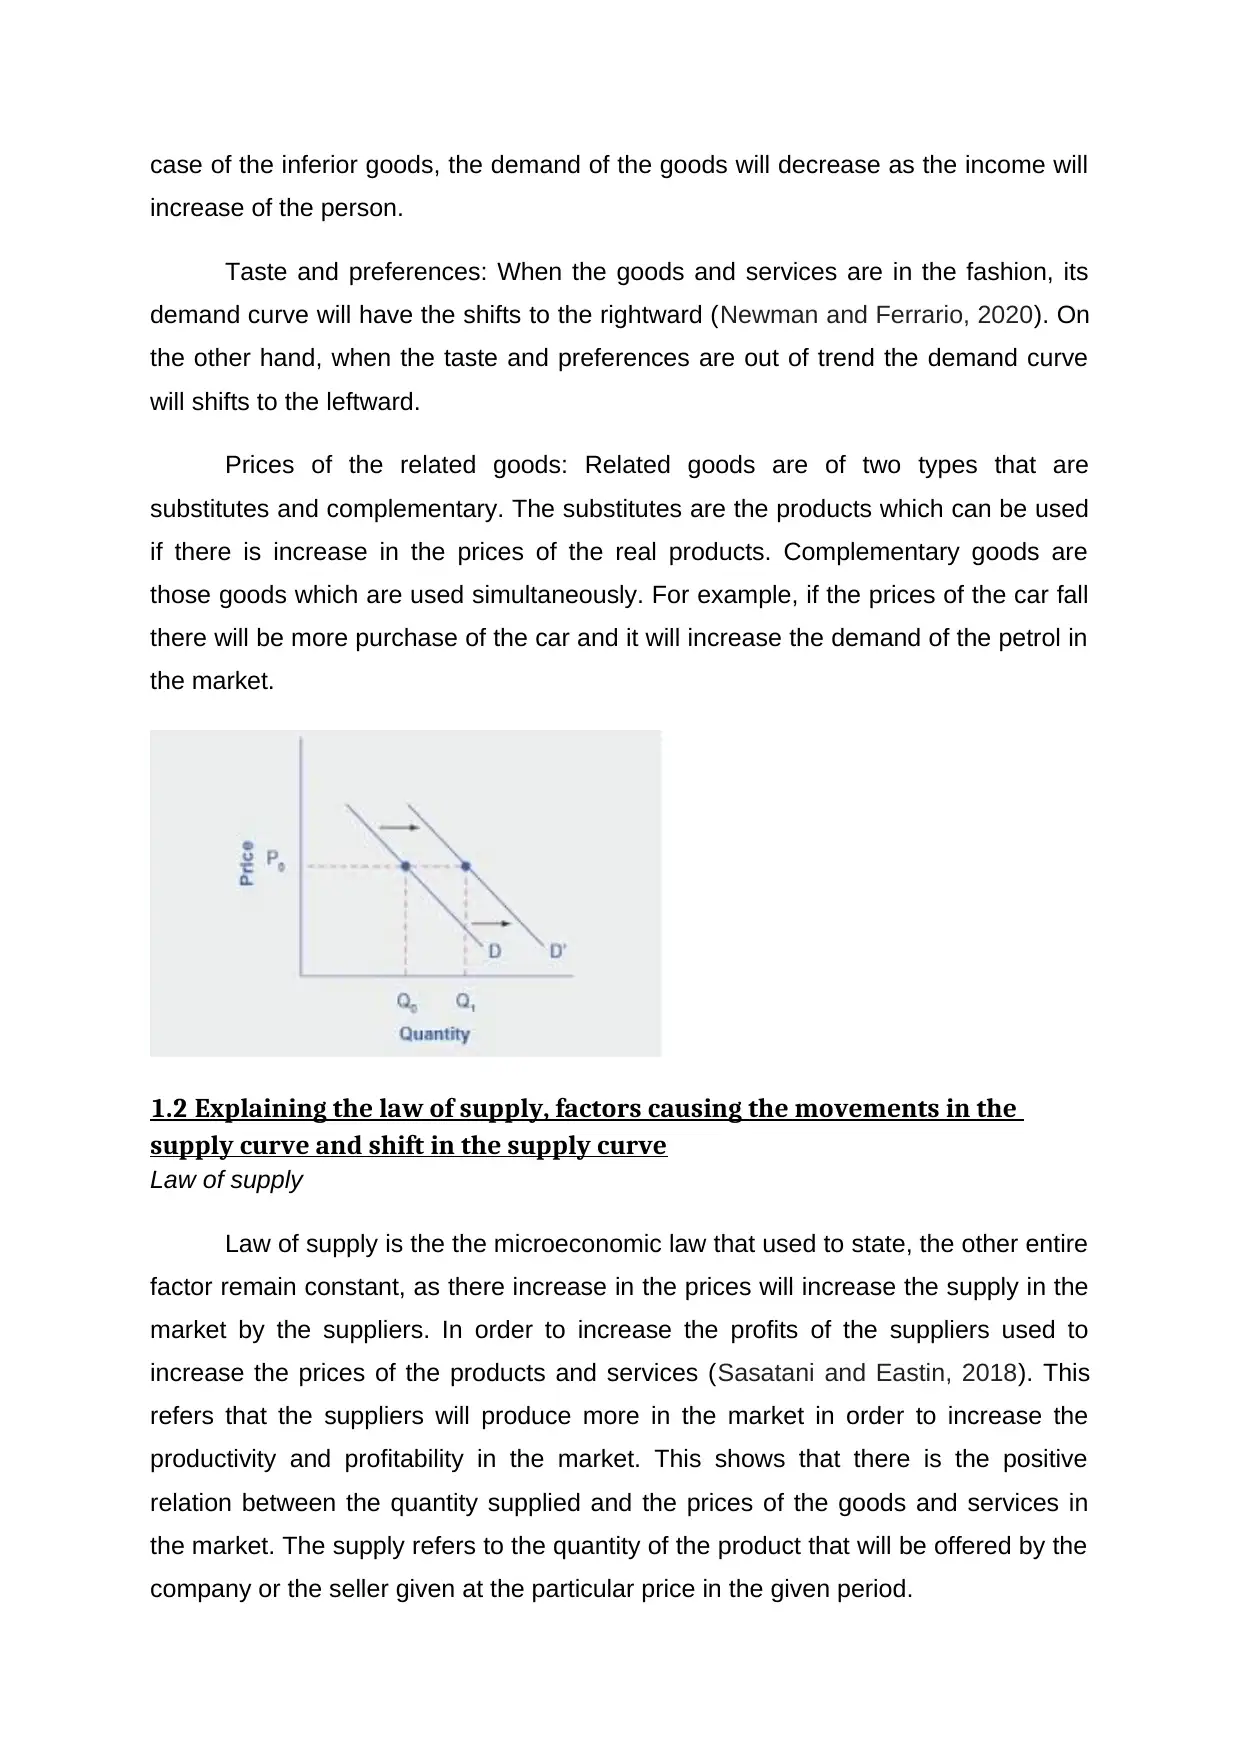
Prices of the related goods: Related goods are of two types that are
substitutes and complementary. The substitutes are the products which can be used
if there is increase in the prices of the real products. Complementary goods are
those goods which are used simultaneously. For example, if the prices of the car fall
there will be more purchase of the car and it will increase the demand of the petrol in
the market.
1.2 Explaining the law of supply, factors causing the movements in the
supply curve and shift in the supply curve
Law of supply
Law of supply is the the microeconomic law that used to state, the other entire
factor remain constant, as there increase in the prices will increase the supply in the
market by the suppliers. In order to increase the profits of the suppliers used to
increase the prices of the products and services (Sasatani and Eastin, 2018). This
refers that the suppliers will produce more in the market in order to increase the
productivity and profitability in the market. This shows that there is the positive
relation between the quantity supplied and the prices of the goods and services in
the market. The supply refers to the quantity of the product that will be offered by the
company or the seller given at the particular price in the given period.
increase of the person.
Taste and preferences: When the goods and services are in the fashion, its
demand curve will have the shifts to the rightward (Newman and Ferrario, 2020). On
the other hand, when the taste and preferences are out of trend the demand curve
will shifts to the leftward.
Prices of the related goods: Related goods are of two types that are
substitutes and complementary. The substitutes are the products which can be used
if there is increase in the prices of the real products. Complementary goods are
those goods which are used simultaneously. For example, if the prices of the car fall
there will be more purchase of the car and it will increase the demand of the petrol in
the market.
1.2 Explaining the law of supply, factors causing the movements in the
supply curve and shift in the supply curve
Law of supply
Law of supply is the the microeconomic law that used to state, the other entire
factor remain constant, as there increase in the prices will increase the supply in the
market by the suppliers. In order to increase the profits of the suppliers used to
increase the prices of the products and services (Sasatani and Eastin, 2018). This
refers that the suppliers will produce more in the market in order to increase the
productivity and profitability in the market. This shows that there is the positive
relation between the quantity supplied and the prices of the goods and services in
the market. The supply refers to the quantity of the product that will be offered by the
company or the seller given at the particular price in the given period.
⊘ This is a preview!⊘
Do you want full access?
Subscribe today to unlock all pages.
Trusted by 1+ million students worldwide
There is direct and positive relation between the prices and the quantity
supplied in the market. The quantity supplied refers to the system in which the
sellers are willing and able to sell the goods in the market. If the seller notices that
there are more goods sell in the market, the seller will increase its productivity in the
market.
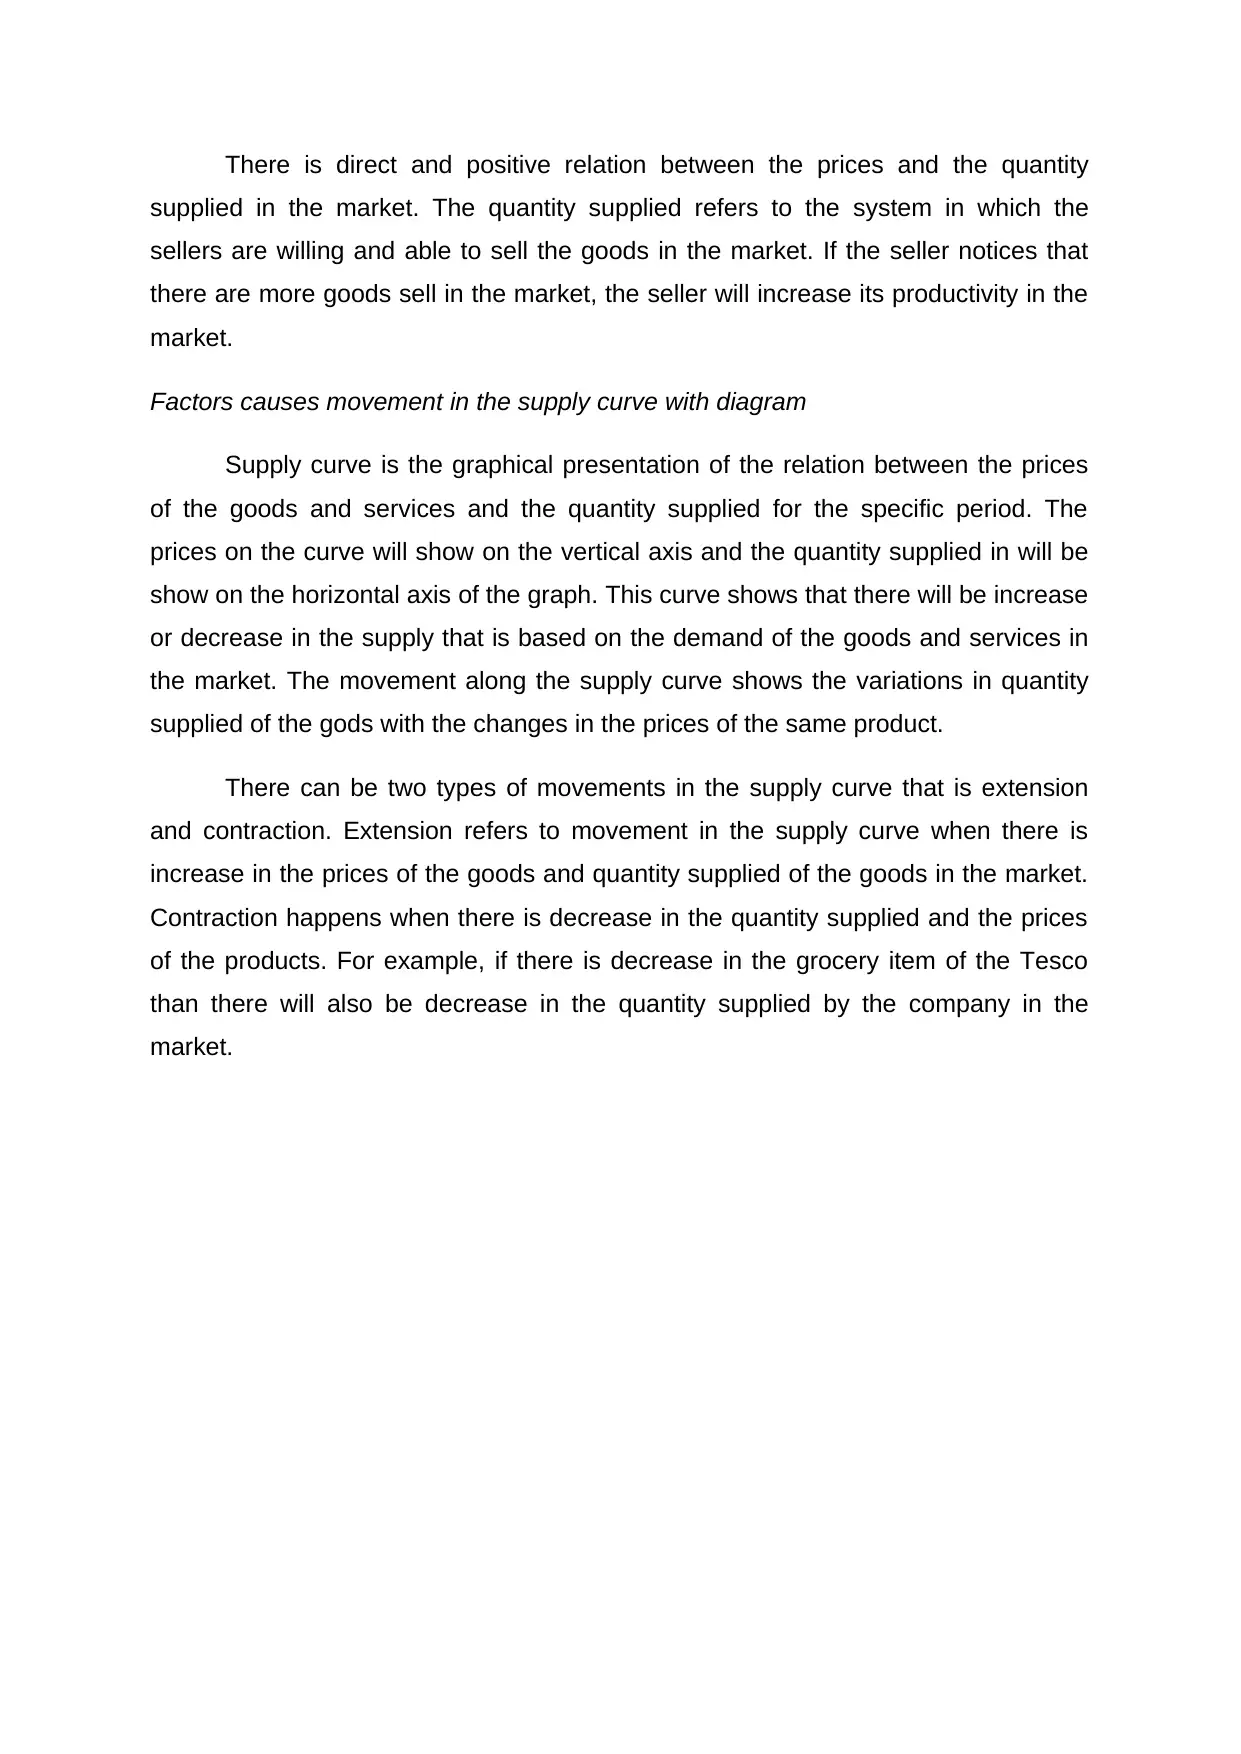
Factors causes movement in the supply curve with diagram
Supply curve is the graphical presentation of the relation between the prices
of the goods and services and the quantity supplied for the specific period. The
prices on the curve will show on the vertical axis and the quantity supplied in will be
show on the horizontal axis of the graph. This curve shows that there will be increase
or decrease in the supply that is based on the demand of the goods and services in
the market. The movement along the supply curve shows the variations in quantity
supplied of the gods with the changes in the prices of the same product.
There can be two types of movements in the supply curve that is extension
and contraction. Extension refers to movement in the supply curve when there is
increase in the prices of the goods and quantity supplied of the goods in the market.
Contraction happens when there is decrease in the quantity supplied and the prices
of the products. For example, if there is decrease in the grocery item of the Tesco
than there will also be decrease in the quantity supplied by the company in the
market.
supplied in the market. The quantity supplied refers to the system in which the
sellers are willing and able to sell the goods in the market. If the seller notices that
there are more goods sell in the market, the seller will increase its productivity in the
market.
Factors causes movement in the supply curve with diagram
Supply curve is the graphical presentation of the relation between the prices
of the goods and services and the quantity supplied for the specific period. The
prices on the curve will show on the vertical axis and the quantity supplied in will be
show on the horizontal axis of the graph. This curve shows that there will be increase
or decrease in the supply that is based on the demand of the goods and services in
the market. The movement along the supply curve shows the variations in quantity
supplied of the gods with the changes in the prices of the same product.
There can be two types of movements in the supply curve that is extension
and contraction. Extension refers to movement in the supply curve when there is
increase in the prices of the goods and quantity supplied of the goods in the market.
Contraction happens when there is decrease in the quantity supplied and the prices
of the products. For example, if there is decrease in the grocery item of the Tesco
than there will also be decrease in the quantity supplied by the company in the
market.
Paraphrase This Document
Need a fresh take? Get an instant paraphrase of this document with our AI Paraphraser
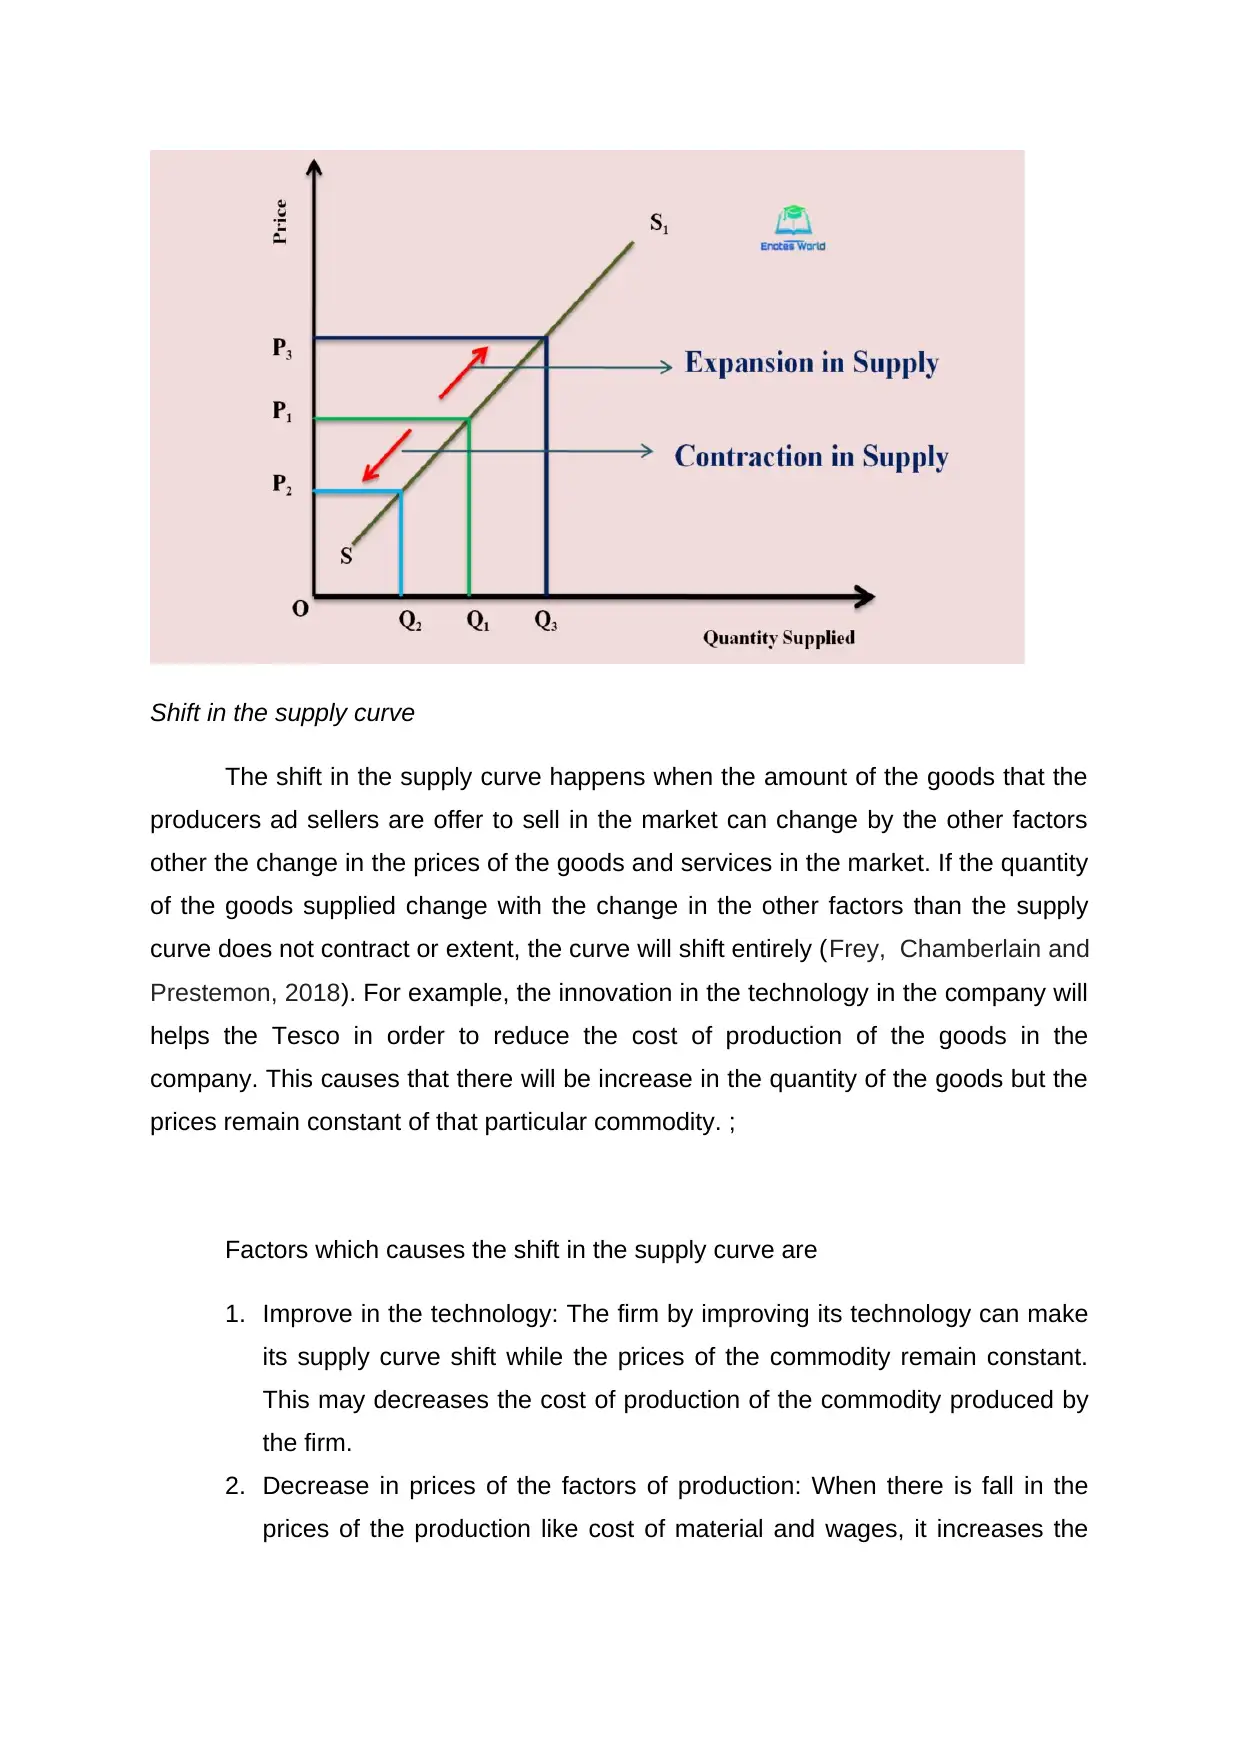
Shift in the supply curve
The shift in the supply curve happens when the amount of the goods that the
producers ad sellers are offer to sell in the market can change by the other factors
other the change in the prices of the goods and services in the market. If the quantity
of the goods supplied change with the change in the other factors than the supply
curve does not contract or extent, the curve will shift entirely (Frey, Chamberlain and
Prestemon, 2018). For example, the innovation in the technology in the company will
helps the Tesco in order to reduce the cost of production of the goods in the
company. This causes that there will be increase in the quantity of the goods but the
prices remain constant of that particular commodity. ;
Factors which causes the shift in the supply curve are
1. Improve in the technology: The firm by improving its technology can make
its supply curve shift while the prices of the commodity remain constant.
This may decreases the cost of production of the commodity produced by
the firm.
2. Decrease in prices of the factors of production: When there is fall in the
prices of the production like cost of material and wages, it increases the
revenue of the producer that reduces him to increase in the supply in the
market.
3. Increase in the number of firm in the market: when there is enter of the
firm in the new market than there will increase in the total supply. Then
there will be rightward shift in the supply curve.
4. Increase in the substitute’s goods prices: when there is decrease or fall in
the supply curve than the supply curve for the product will shifts to the
leftward.
5. Increase in tax: When the government increases, the tax than the cost of
production increases that causes the leftward shift in the supply curve.
6. Outdated technology: If the firm is using the outdated technology, this will
increase the cost of production of the products. The increase in the cost of
production will shifts the supply curve to leftward.
TASK 2
Comparing and contrasting the emerging theories and models in the 21st
century economics with the 20th century
Macroeconomics is the branch of the economics that used to study the overall
economy which includes market and other systems that used to operate the
⊘ This is a preview!⊘
Do you want full access?
Subscribe today to unlock all pages.
Trusted by 1+ million students worldwide
business on the large scale. The increase in the prices or inflation is the major
macroeconomics issue face by the country.
Nudge Theory- This theory is the concept which is used in the 21st century,
which explains the behavioural economics, political theory and the behavioural
sciences that give the positive reinforcement and suggestions in order to influence
the behaviour and decision-making. This concept was popularized in the 2008 book
Nudge, by the behavioural economist Richard Thaler and Cass Sunstein. In the UK it
was set up in order to improve the choices which includes in making the cost
effective public services and makes easier for the citizens. It improves the outcomes
of the by introducing the realistic models for the human behaviour policy and
wherever required by the people and makes the people t have the better choices for
themselves.
The nudge theory is basically the policy that used to encourage the people in
order to make the decisions and increases the self-interest in them. There is the
huge profit in order to apply the nudge theory in the marketing and sales. There are
many benefits of using the nudge theory which are it reduces the meeting time of the
people and makes the fast decision-making (Cai, 2020). As the meetings takes the
lots of time in order to makes the decisions for the economics this theory reduces the
meeting time. The nudge theory can change the behaviour of the employees as the
organizations can have the workouts system in their way of doing the work.
Organization should have the well-being of the employees in order to have the
effective work. For example, the company can have the staircase rather than using
the lifts nod elevator in order to go up and down.
In order to minimise the waste habits the organizations have used and
resduced the waste in the e very floor which makes them to have the good decision-
making in the company. Therefore this theory helps the employees and the
macroeconomics in order to encourage and have the best solution for their work in
the market.
Keynesian Theory
On the other hand these theories was used in the late 20th century which is
the based on the macroeconomics which defines the total spending in the economy
Paraphrase This Document
Need a fresh take? Get an instant paraphrase of this document with our AI Paraphraser
and have its effect on the employment, output, employment and the inflation. This
theory of economics was developed by the British economist that is John Maynard
Keynes in the 1930’s (Rahim and Bahari, 2018). This theory is based on the
demand-side which used to focus on the changes in the macro economy in the
short-run.
Keynes’s theory was first used in order to have the study of the economic
behaviour and the study of the national economic aggregate variables. The
developer advocated increasing the government expenditures and decreases the
taxes to maintain the demands and also, maintain the global economy and keeping
the economy out of the depression. Fiscal and monetary policy are the basic and
primary tool that is recommended by the developer of the theory in order to manage
the economy and reduces the unemployment. This theory was basically works on
the three assumptions that are the rigid prices, effective demand and saving the
investment factors.
There was the biggest criticism of this theory that is used to borrow the money
at the high interest rates and have the financial crowding out which leads to increase
in the budget deficit at the time of recession. If the government will borrow at the
higher rate than the service will have the fewer resources to finance themselves as
rates are very high. As the developer of the economy did not advocate the higher
inflation rather than he argued that the inflation will cause the damage and the
inflationary environment. This theory is based on the aggregate demand which
includes the consumption of the goods and services, investments done by the
industry in the capital goods and ne exports.
As comatose to both the theories the nudge theory is better than the
Keynesian theory as it focuses on the behaviours of the overall economy but the
Keynesian theory only focuses on the aggregate demand in the market.
CONCLUSION
From the above concluded meaning of Law of demand and the factors which
causes the movement along the demand curve with the help of diagram. Further it
has evaluated the factors which used to shift the demand curve to the new position
with the help of diagram. This report has also evaluated the meaning of law of supply
and the factors which are causing movement along the supply curve with the help of
diagram. At last it will outline the factors which shift the supply curve to the new
position and comparison between the 21st and 20th century economics by having the
comparison between the nudge theory and the Keynesian theory.
⊘ This is a preview!⊘
Do you want full access?
Subscribe today to unlock all pages.
Trusted by 1+ million students worldwide
1 out of 13
Related Documents


Your All-in-One AI-Powered Toolkit for Academic Success.
+13062052269
info@desklib.com
Available 24*7 on WhatsApp / Email
![[object Object]](/_next/static/media/star-bottom.7253800d.svg)
Unlock your academic potential
Copyright © 2020–2026 A2Z Services. All Rights Reserved. Developed and managed by ZUCOL.