Performance Analysis and Strategic Planning for BME Luxury Care Home
VerifiedAdded on 2023/01/11
|19
|5155
|77
Report
AI Summary
This report analyzes the performance management of BME Luxury Care Home, focusing on strategic planning models and financial analysis. It begins with an introduction to performance management and its significance. Task 1 delves into strategic planning models, specifically the VRIO framework and Porter's Five Forces model, evaluating their advantages and disadvantages. Task 2 presents a Du point analysis and ratio interpretation to assess the company's financial stability and efficiency. Finally, Task 3 provides a critical evaluation of performance management practices. The report concludes with an overall assessment and recommendations for improvement. The report covers strategic planning, financial analysis, and performance management concepts to provide a complete overview of the topic.
PERFORMANCE IMPROVEMENT
AND MANAGEMENT IN HEALTH
AND SOCIAL CARE
TABLE OF CONTENTS
AND MANAGEMENT IN HEALTH
AND SOCIAL CARE
TABLE OF CONTENTS
Paraphrase This Document
Need a fresh take? Get an instant paraphrase of this document with our AI Paraphraser
INTRODUCTION...........................................................................................................................3
Task 1...............................................................................................................................................3
Strategic planning models............................................................................................................3
Task 2...............................................................................................................................................8
a. Du point analysis..................................................................................................................8
B. Ratio interpretation...............................................................................................................10
TASK 3..........................................................................................................................................12
Critical evaluation of performance management.......................................................................12
CONCLUSION..............................................................................................................................16
REFERENCES..............................................................................................................................17
INTRODUCTION
Performance management is a term that defines analysing the company’s performance in
market. This report is based on the case study of BME Luxury Care Hone ion respect to its
performance measurement. Henceforth, report will emphasis on advantages and disadvantages
associated with some strategic direction of company. This report will also discuss some financial
terms. Performance management will also discuss in this report.
Task 1
Strategic planning models
Strategic planning is referred to the process of identifying the goals and objectives of the
business while resources are used to gain defined objectives over the time. while model is a the
systematic process that directs business how to use appropriate resource along with right action
which leads success on time and reduces risk on time. the strategic planning frameworks plays
essential role such as it develops a strong alignment between resources and mission of the
company (Bergmann and Strecker, 2018). In addition, it is essential to determine aspects of the
business-like resource (employees) are working well and understand needs of further adjustment
which is required to meet desired objectives. There are two strategic planning models that helps
director of care home to promote business growth effectively. Models are described as follows:
VRIO Framework
It is a strategic analytical tool that is designed to support business to determine it’s
capabilities, resources and risks which gives them long-term competitive advantage. The
framework is a strategic tool that helps to understand elements of the business which gives
sustainable competitive advantage from the competitors. It creates foundation to mapping out
that which resource can lead more success and provide competitive advantage or which one can
be applied as an instructor in decision-making process and sets priorities of resource according to
requirement in the company (Gregor, Weidner and Raw, 2016). This model stands for valuable,
rarity, imitability and organized which helps to determine effective resources that leads long-
term competitive advantage in company. The model concept is basically dependent on elements
firm resource and sustainable competitive advantage.
⊘ This is a preview!⊘
Do you want full access?
Subscribe today to unlock all pages.
Trusted by 1+ million students worldwide
Valuable resources
A resource is considered valuable resource if it adds perceived value to the organization
weather it can help company to take advantage of the given opportunity or can create threats.
While in Swot analysis model valuable resource is considered into strength, opportunities and
threats. As per the concept if resource is valuable then it offers the business with some sort of
benefits. Moreover, a resource that is more valuable for the company but does not fit any of the
other dimension of the model as result does not lead any competitive advantage. A company can
take competitive advantage, only in one state when resource is valuable and it is not rate and not
hard to imitate by others.
Rare
A resource that is judged based on the rarity. It is often easiest and least subjective part of
the VRIO model. It is gathered by competitors easily and easy to replace completely. In other
word. A resource that is not possessed by most of the company due to rarity. When a resource
keeps both type traits valuable and rare then it gives competitive advantage. A company can easy
to gain competitive advantage and growth of the business when it has rare but valuable resource.
This resource can easily imitate by competitors when they realize quickly So it is not big deal to
imitate rare resource. That’s why it is considered temporary competitive advantage.
Inimitable
It is valuable and rare resources that supports corporations to engage in strategies while
other companies cannot pursue further till companies has shortage of relevant resources. It does
not have guarantee for long-term competitive advantage (Immordino and et.al., 2016). The
reason behind is that other companies can intimate these resources to win the competition and
leads high profitability in the company. This resource is highly focused on company and helps to
gain competitive advantage but competitors always try to imitate or copy of the resource when
they feel. As per the concept of RBV organization must chose such kind resources which must
be hard and expensive to imitate or substitute for others. The resources can be imperfectly
imitable due to few reasons according RBV concept such as unique historical condition, social
complexity and casual ambiguity. Social complexity denotes that if company has mots important
resource such as strong organization culture and it’s brand image among suppliers and customers
Paraphrase This Document
Need a fresh take? Get an instant paraphrase of this document with our AI Paraphraser
then it quite hard for the competitors to establish identical social network which is dependent on
numerous factors.
Organization
If a company has numerous resources that does not mean it develops any advantage on by
own. Only a well-organized company can take advantage of the resource by aligning them
effectively across the business. So, it is mandatory for the organization it must well-organize
itself so that easy to capture values for them. The organization component encompasses a
company’s formal reporting structure, strategic planning, management control, budgeting system
and compensation policies. These component helps company to align resource effective and
make them well-organized as result leads sustainable competitive advantage. As per the RBV
concept when an organization possess valuable, rare and imperfect imitable resource that cannot
enable to take competitive advantage for long period of time.
Advantage
The major advantage of the model is this it helps company to determine it’s resources
such as valuable, rare, inimitable and organization and aligns them effectively with the vision of
the company so that easy to leads high profitability in the company. VRIO model is the part of
resource-based view (RBV) which determine links between a businesses’ characteristics and it’s
financial performance. Thus, VRIO model helps company to take competitive advantage from
the competitors prolong time.
Disadvantage of the VRIO analysis framework
It is quite difficult framework to apply for the small-scale business and new start up
business because these kind business does not have sufficient resources and capabilities to
influence brand image and create sustainable competitive advantage in the competition market.
another drawback of the model is this most of the time companies loses it’s business when it’s
operation is broken out (Romero and et.al., 2016).
Porter’s five force model
It is also an essential framework to analyse organization’s competitive environment. It
also supports company to determine its brand position in the business market. it dives five forces
that identify the competitive intensity and successfulness of firm in term of profitability and sales
revenue. It is powerful tool to understand the competitiveness of the business environment and
determine it’s strategy’s potential profitability. Numerous corporations follow this model to
evaluate it’s competitive environment and it’s competency level in the industry (Silvestrov and
et.al., 2019). The model helps to determine strengths or weaknesses that can exploit to strengthen
that position. It is important for creating fruitful business’s strategy which helps gain sustainable
competitive advantage in the company. There are five forces that are encompassed in the model
which supports to determine business’s strategy as well as leads high profitability in the
company.
Threats of new entrants
It is primary force of the model that brings new opportunity and desires to capture high
market share by the company on it’s products. The threat of new entrant is dependent on certain
barriers of the company (Sims, Powell and Vidgen, 2016). A Exiting player can face threat when
it does not have potential to over industrial barriers such as high customer loyalty for the existing
brand, financial scale, large investment requirement in R&D department, governance policies
and limited distribution channels to access customers. In that state existing player can get threat
of new entrant in it’s business sector.
Bargaining power of the suppliers
This force highlights that bargaining power of the suppliers can become high when
market has high shortage of skilful suppliers as result, they require high cost and sells product on
expensive cost the organization. Supplier bargaining power reduces when high turnover of
suppliers or people is available in the business market and has willingness to work in lower
wages due to high unemployment rate. Based on the two conditions can be analysed profitability
of the company in the business market.
Bargaining power of buyers
⊘ This is a preview!⊘
Do you want full access?
Subscribe today to unlock all pages.
Trusted by 1+ million students worldwide
This force develops two type conditions such as when buyers have the power to demand
high quality products at lower cost from the corporation then it can interpret that buyer’s
bargaining force is too strong in the business market. the reason behind is that when customers
get high availability of the similar products on more stores then demand of the buyer influences
at lower cost. The lower price declines revenue of the product while standard quality goods
raises production cost as result leads loss in the organization’s profitability.
Rivalry among existing competitors
It is another important force that helps to determine competitors forces in term of market
share, sales revenue and product portfolio that creates tough competition for other firm as well as
reduces profit of the company. The rivalry condition can occurs in some consequences i.e. when
company has low customer loyalty and has equal market size and other that leads competition
among exiting rivalry.
Threats of substitutes
The force is generally threatened when customers gets substitute products along with
attractive cost or standard quality then it become easy for the customer to switch it’s preferences
from one product or service to another products with attractive cost (Wang and et.al., 2018).
Advantage of model
It is helpful for the company because it helps to determine competency level of business
with it’s existing rivalry so that easy to apply effective strategy to lead profit from the
competitors. Bargaining power of the buyers and suppliers supports company to analyse external
environment of the company which can impact company positively and negatively. thus, model
helps company to plan strategically so it can gain sustainable competitive advantage from the
business market.
Disadvantage of the model
The major drawback of the model is this it focuses only five forces while other factors are
ignored by the model which causes company unable to take change successfully in the business.
this model is not applicable for all type industries effectively.
Paraphrase This Document
Need a fresh take? Get an instant paraphrase of this document with our AI Paraphraser
Porter’ five force model is effective strategic model for the care sector perspective that is located
in England because there has large number of competitors i.e. NHS and other health and personal
care sectors which are highly competent and can give negative impact on the business. so, by the
model company can analyse business environment of company in England, UK. It helps to
formulate business’s strategy as per the situation as result leads high business growth in the
market and maintains sustainable business performance in the care sector (Willis, Cave and
Kunc, 2018). BME company must follows this model for leading business growth in the England
market.
Task 2
a. Du point analysis
Du point analysis is a model channelizes to understand the financial stability of the
company. This analysis gives emphasis to Return of Equity of a company. The concept of Return
of Equity is about to measure the financial performance of the company. It is calculated by
comparing net income with shareholder equity. Shareholder equity is further indicated to
company’s assets reduced with its debts (Frösén and et.al., 2016). Return of equity can be more
specifically demonstrate as return on net asset of company. In simple term return on equity
projects about how efficiently company is utilising its assets to entertain profits for company.
The concept of Du point analysis is a useful technique that projects about different drivers
associated with return of equity projected in financial performance. This concept involves three
major drivers associated with return of equity which projected as operating efficiency, net profit
margin and asset turnover ratio. This is an important concept which clearly projects the
company’s performance. Shareholder associated with the company also monitors the company’s
presence over Du Point Analysis as this model give detail about the financial performance of
company. Company’s shareholder deeply observes the financial position of company with the
support of this model. As it clearly project the financial performance and stability of company
with the use of formulas which also ensure the efficiency of this model. Following components
are a part of the Du Point Analysis.
Profit margin
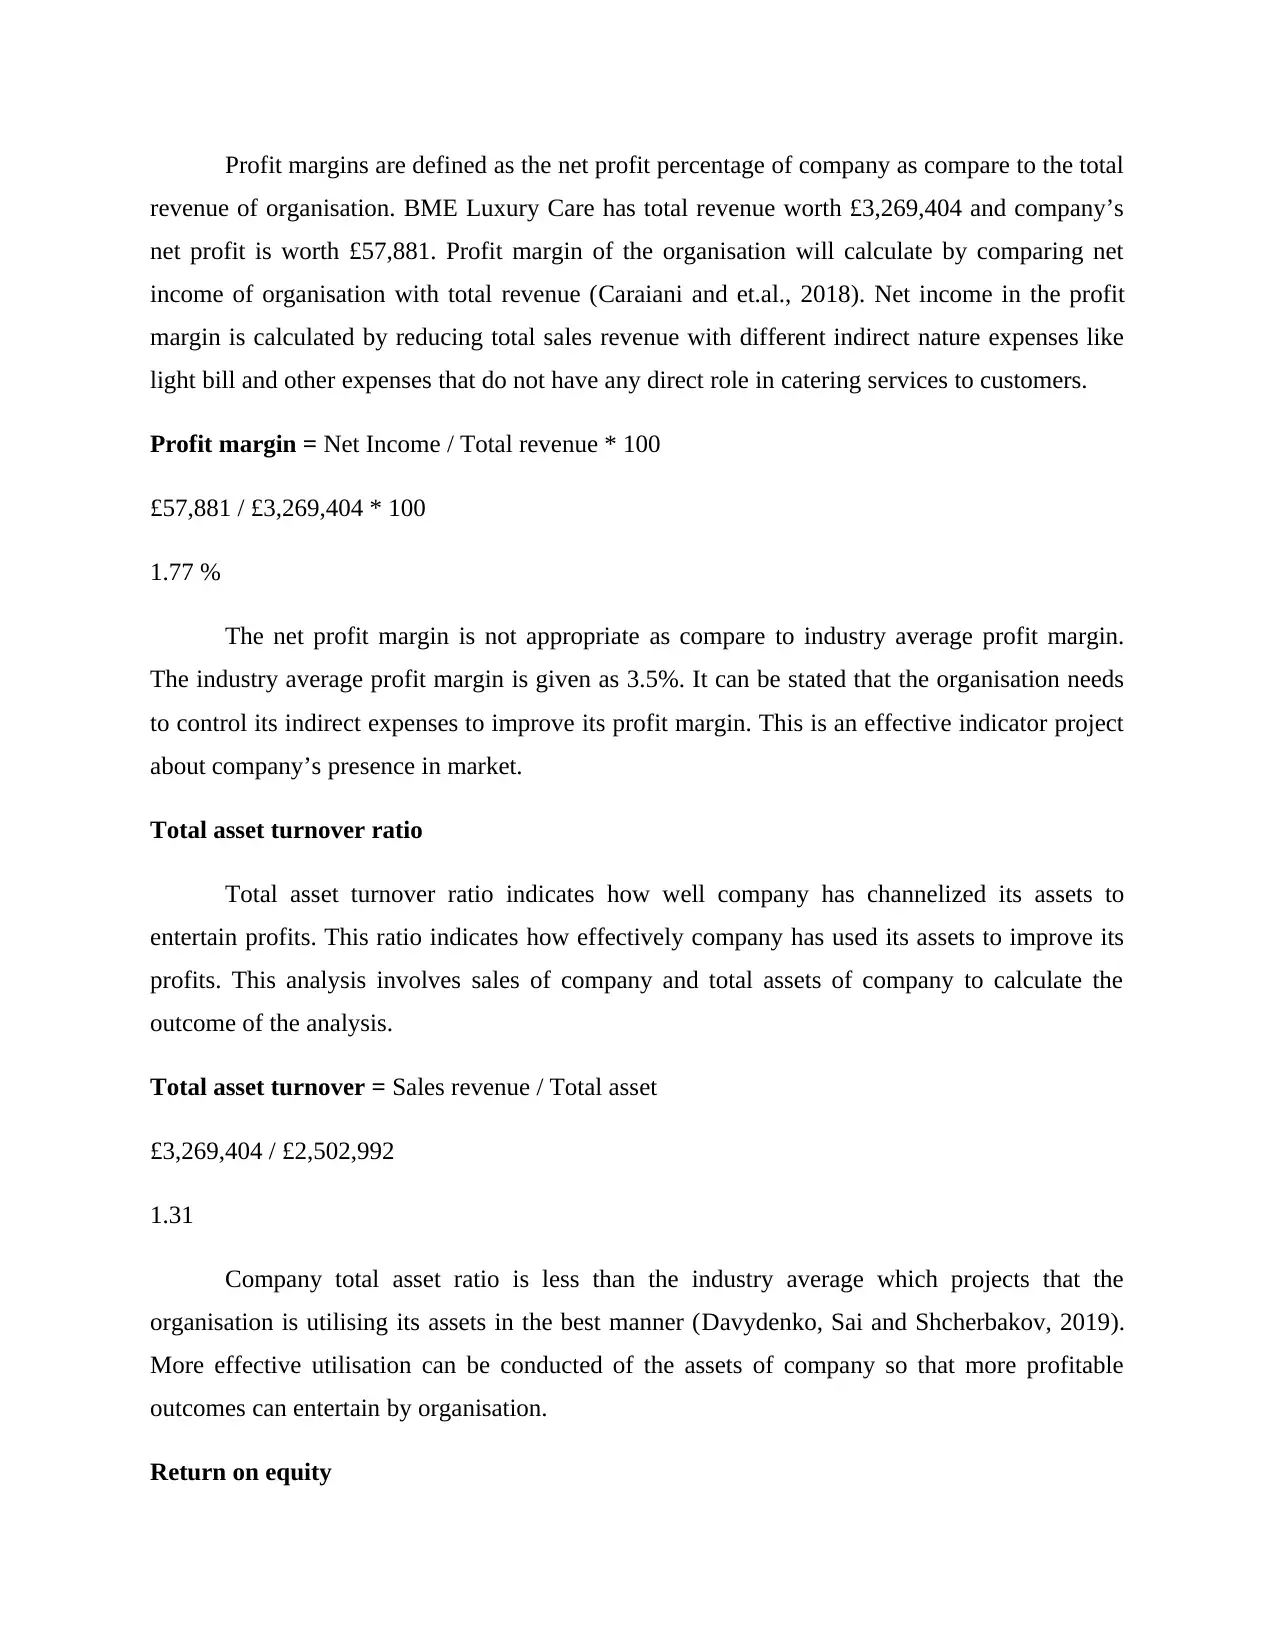
Profit margins are defined as the net profit percentage of company as compare to the total
revenue of organisation. BME Luxury Care has total revenue worth £3,269,404 and company’s
net profit is worth £57,881. Profit margin of the organisation will calculate by comparing net
income of organisation with total revenue (Caraiani and et.al., 2018). Net income in the profit
margin is calculated by reducing total sales revenue with different indirect nature expenses like
light bill and other expenses that do not have any direct role in catering services to customers.
Profit margin = Net Income / Total revenue * 100
£57,881 / £3,269,404 * 100
1.77 %
The net profit margin is not appropriate as compare to industry average profit margin.
The industry average profit margin is given as 3.5%. It can be stated that the organisation needs
to control its indirect expenses to improve its profit margin. This is an effective indicator project
about company’s presence in market.
Total asset turnover ratio
Total asset turnover ratio indicates how well company has channelized its assets to
entertain profits. This ratio indicates how effectively company has used its assets to improve its
profits. This analysis involves sales of company and total assets of company to calculate the
outcome of the analysis.
Total asset turnover = Sales revenue / Total asset
£3,269,404 / £2,502,992
1.31
Company total asset ratio is less than the industry average which projects that the
organisation is utilising its assets in the best manner (Davydenko, Sai and Shcherbakov, 2019).
More effective utilisation can be conducted of the assets of company so that more profitable
outcomes can entertain by organisation.
Return on equity
⊘ This is a preview!⊘
Do you want full access?
Subscribe today to unlock all pages.
Trusted by 1+ million students worldwide
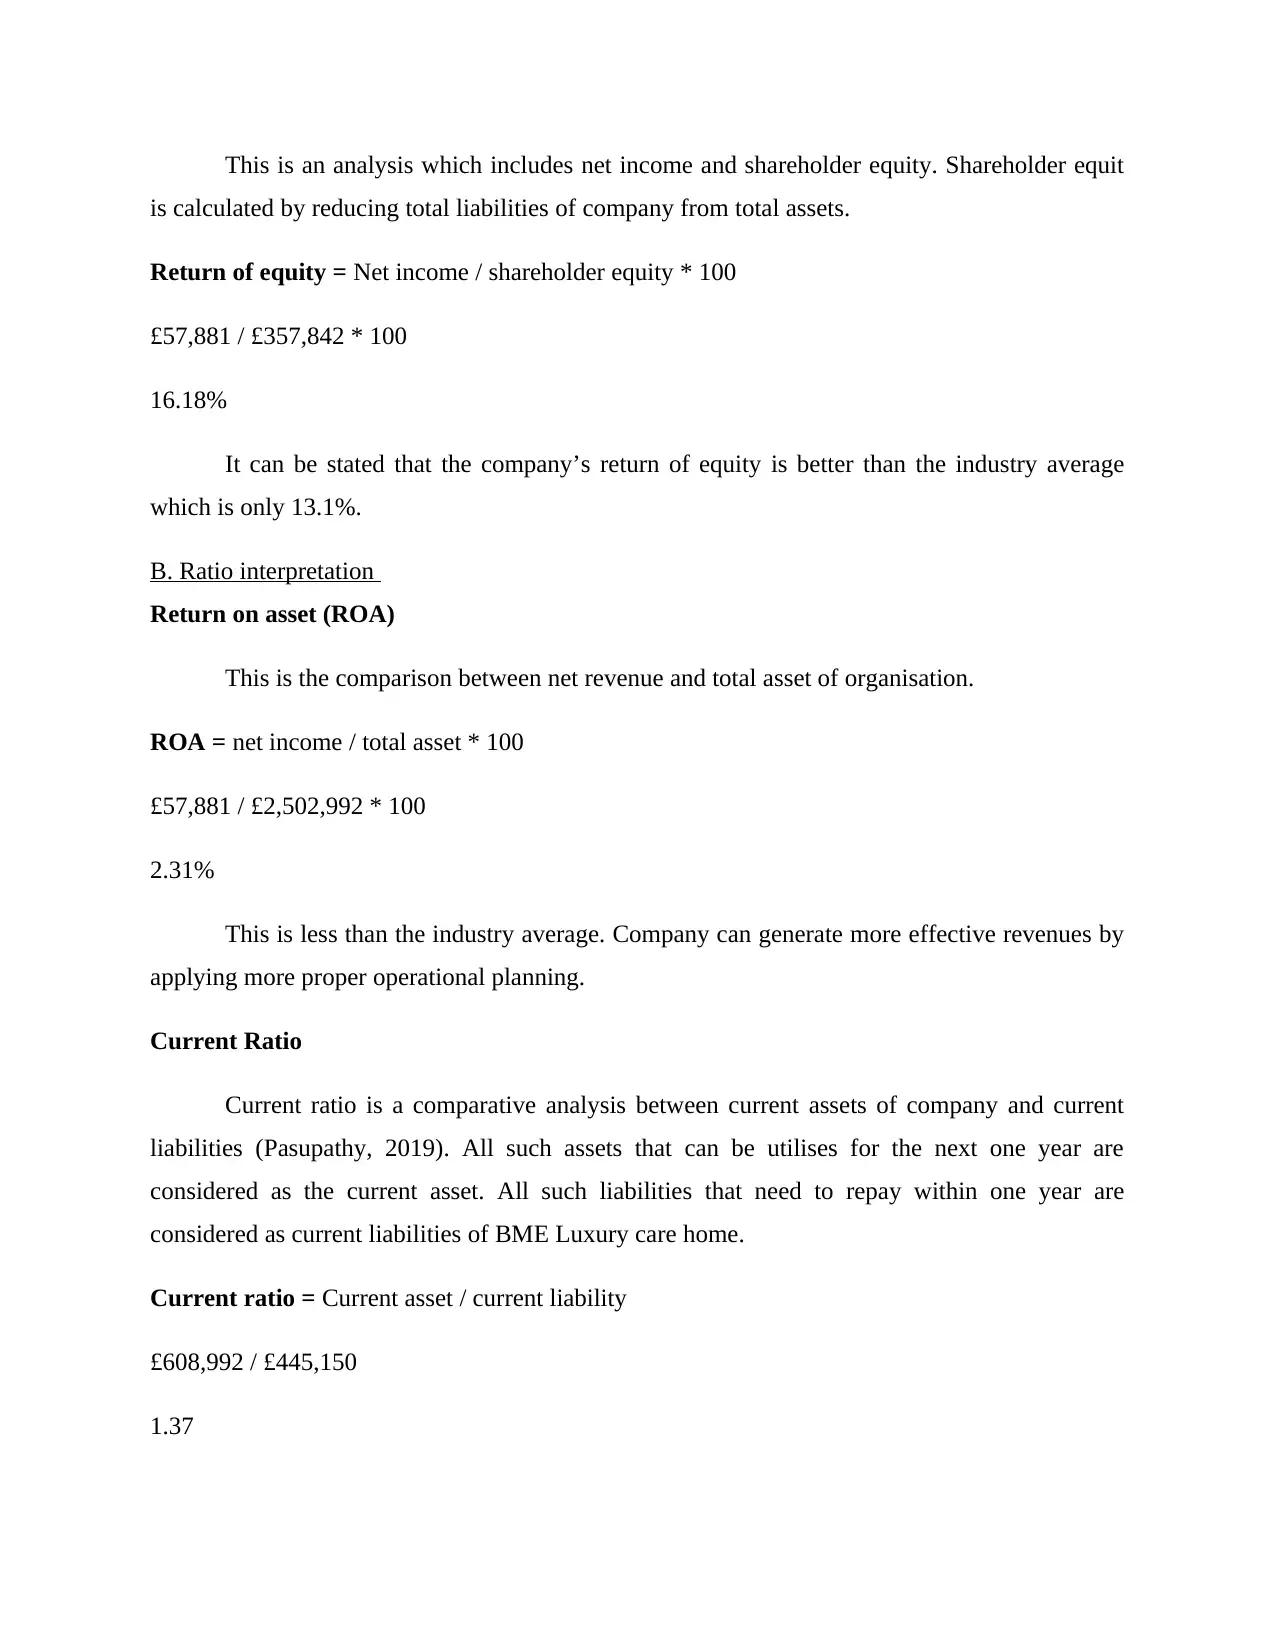
This is an analysis which includes net income and shareholder equity. Shareholder equit
is calculated by reducing total liabilities of company from total assets.
Return of equity = Net income / shareholder equity * 100
£57,881 / £357,842 * 100
16.18%
It can be stated that the company’s return of equity is better than the industry average
which is only 13.1%.
B. Ratio interpretation
Return on asset (ROA)
This is the comparison between net revenue and total asset of organisation.
ROA = net income / total asset * 100
£57,881 / £2,502,992 * 100
2.31%
This is less than the industry average. Company can generate more effective revenues by
applying more proper operational planning.
Current Ratio
Current ratio is a comparative analysis between current assets of company and current
liabilities (Pasupathy, 2019). All such assets that can be utilises for the next one year are
considered as the current asset. All such liabilities that need to repay within one year are
considered as current liabilities of BME Luxury care home.
Current ratio = Current asset / current liability
£608,992 / £445,150
1.37
Paraphrase This Document
Need a fresh take? Get an instant paraphrase of this document with our AI Paraphraser
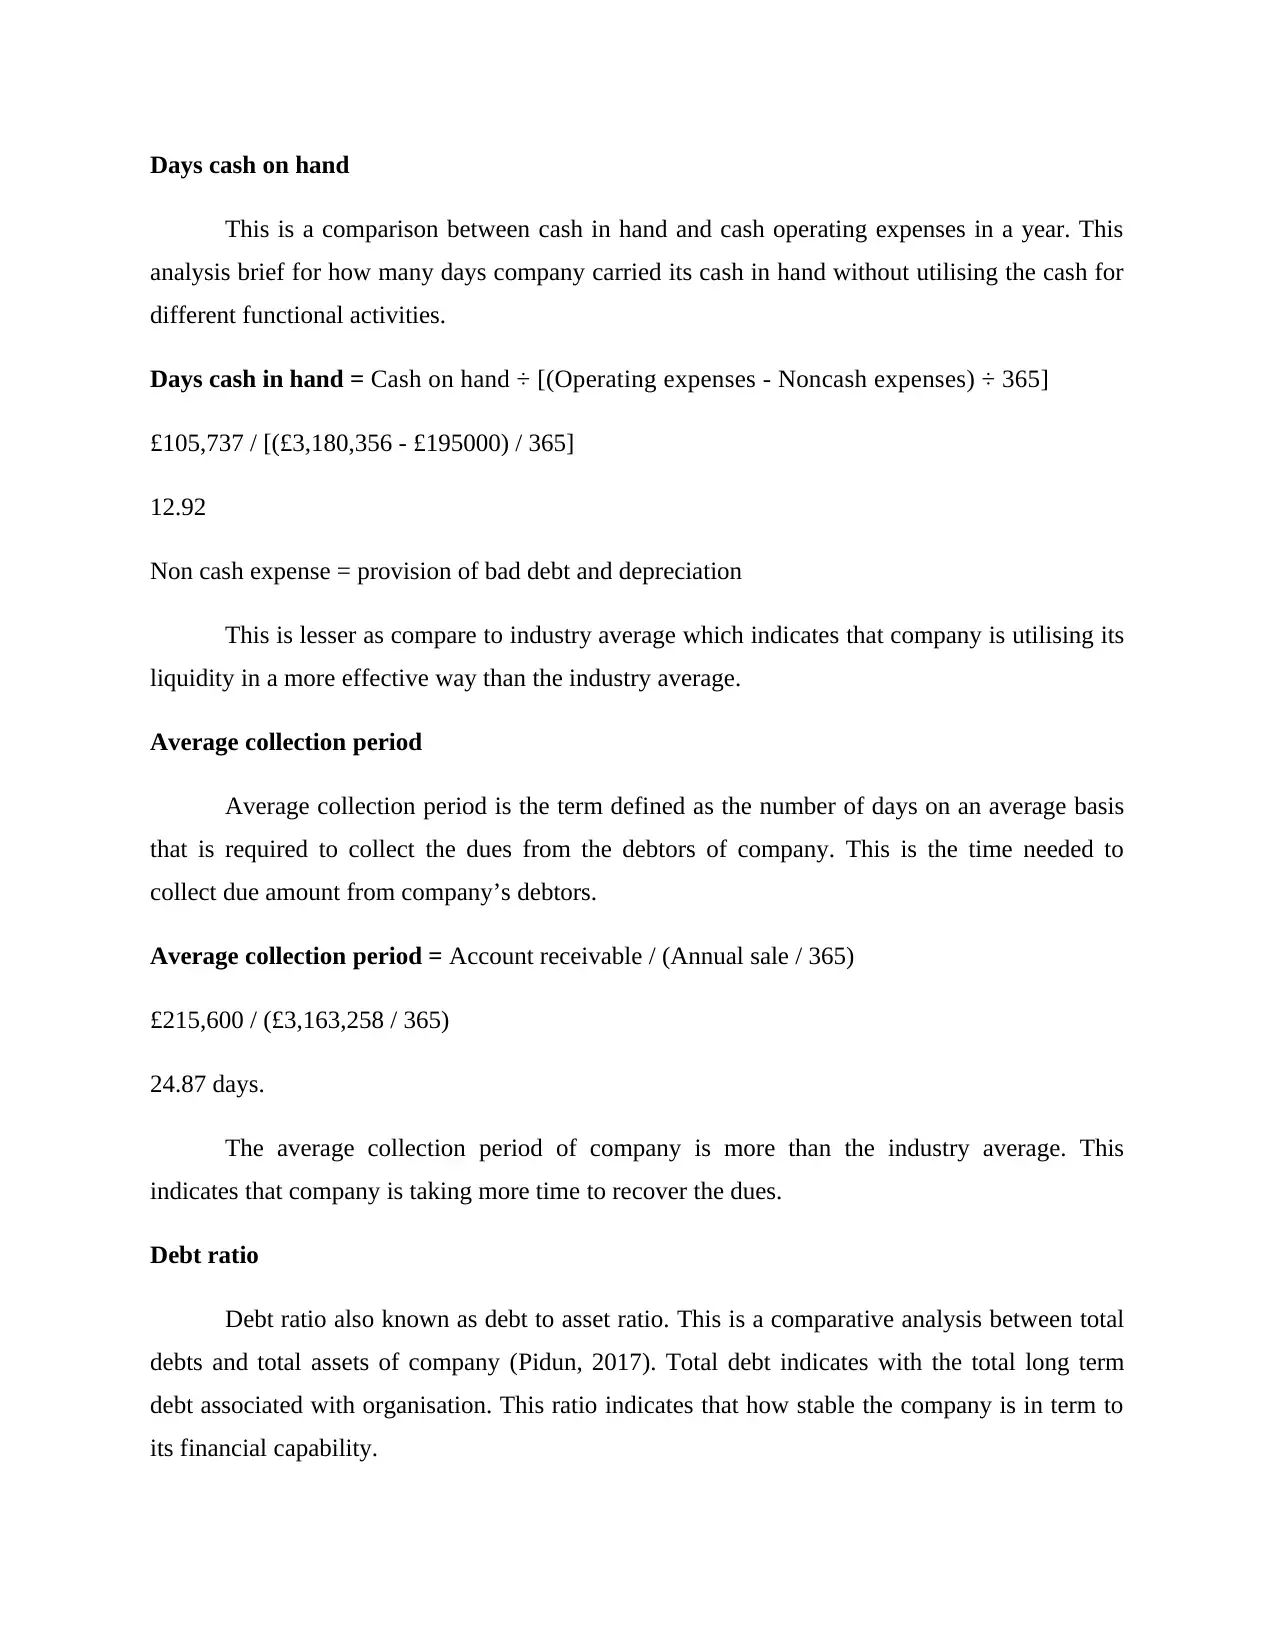
Days cash on hand
This is a comparison between cash in hand and cash operating expenses in a year. This
analysis brief for how many days company carried its cash in hand without utilising the cash for
different functional activities.
Days cash in hand = Cash on hand ÷ [(Operating expenses - Noncash expenses) ÷ 365]
£105,737 / [(£3,180,356 - £195000) / 365]
12.92
Non cash expense = provision of bad debt and depreciation
This is lesser as compare to industry average which indicates that company is utilising its
liquidity in a more effective way than the industry average.
Average collection period
Average collection period is the term defined as the number of days on an average basis
that is required to collect the dues from the debtors of company. This is the time needed to
collect due amount from company’s debtors.
Average collection period = Account receivable / (Annual sale / 365)
£215,600 / (£3,163,258 / 365)
24.87 days.
The average collection period of company is more than the industry average. This
indicates that company is taking more time to recover the dues.
Debt ratio
Debt ratio also known as debt to asset ratio. This is a comparative analysis between total
debts and total assets of company (Pidun, 2017). Total debt indicates with the total long term
debt associated with organisation. This ratio indicates that how stable the company is in term to
its financial capability.
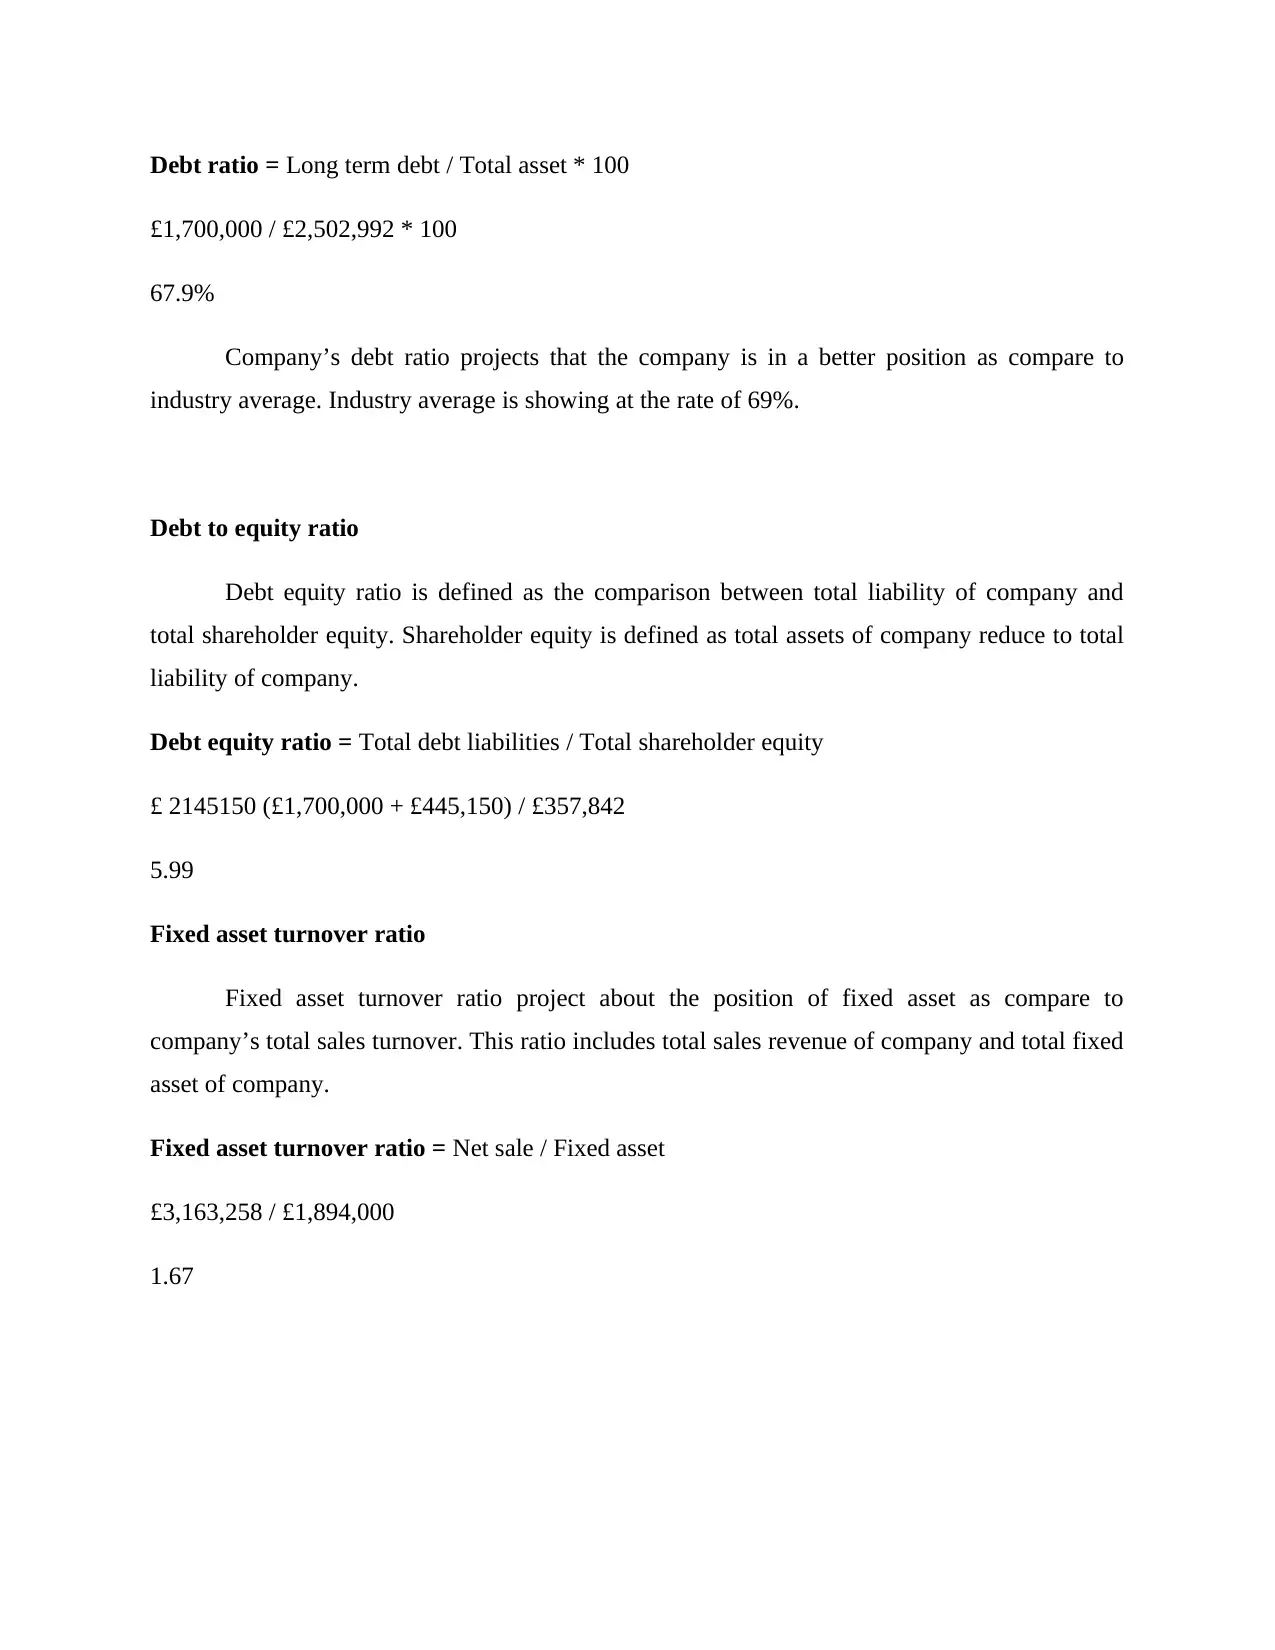
Debt ratio = Long term debt / Total asset * 100
£1,700,000 / £2,502,992 * 100
67.9%
Company’s debt ratio projects that the company is in a better position as compare to
industry average. Industry average is showing at the rate of 69%.
Debt to equity ratio
Debt equity ratio is defined as the comparison between total liability of company and
total shareholder equity. Shareholder equity is defined as total assets of company reduce to total
liability of company.
Debt equity ratio = Total debt liabilities / Total shareholder equity
£ 2145150 (£1,700,000 + £445,150) / £357,842
5.99
Fixed asset turnover ratio
Fixed asset turnover ratio project about the position of fixed asset as compare to
company’s total sales turnover. This ratio includes total sales revenue of company and total fixed
asset of company.
Fixed asset turnover ratio = Net sale / Fixed asset
£3,163,258 / £1,894,000
1.67
⊘ This is a preview!⊘
Do you want full access?
Subscribe today to unlock all pages.
Trusted by 1+ million students worldwide
1 out of 19
Related Documents


Your All-in-One AI-Powered Toolkit for Academic Success.
+13062052269
info@desklib.com
Available 24*7 on WhatsApp / Email
![[object Object]](/_next/static/media/star-bottom.7253800d.svg)
Unlock your academic potential
Copyright © 2020–2026 A2Z Services. All Rights Reserved. Developed and managed by ZUCOL.