BMS512 - Financial Performance Analysis of R plc Using Ratios
VerifiedAdded on 2023/06/15
|7
|1362
|280
Report
AI Summary
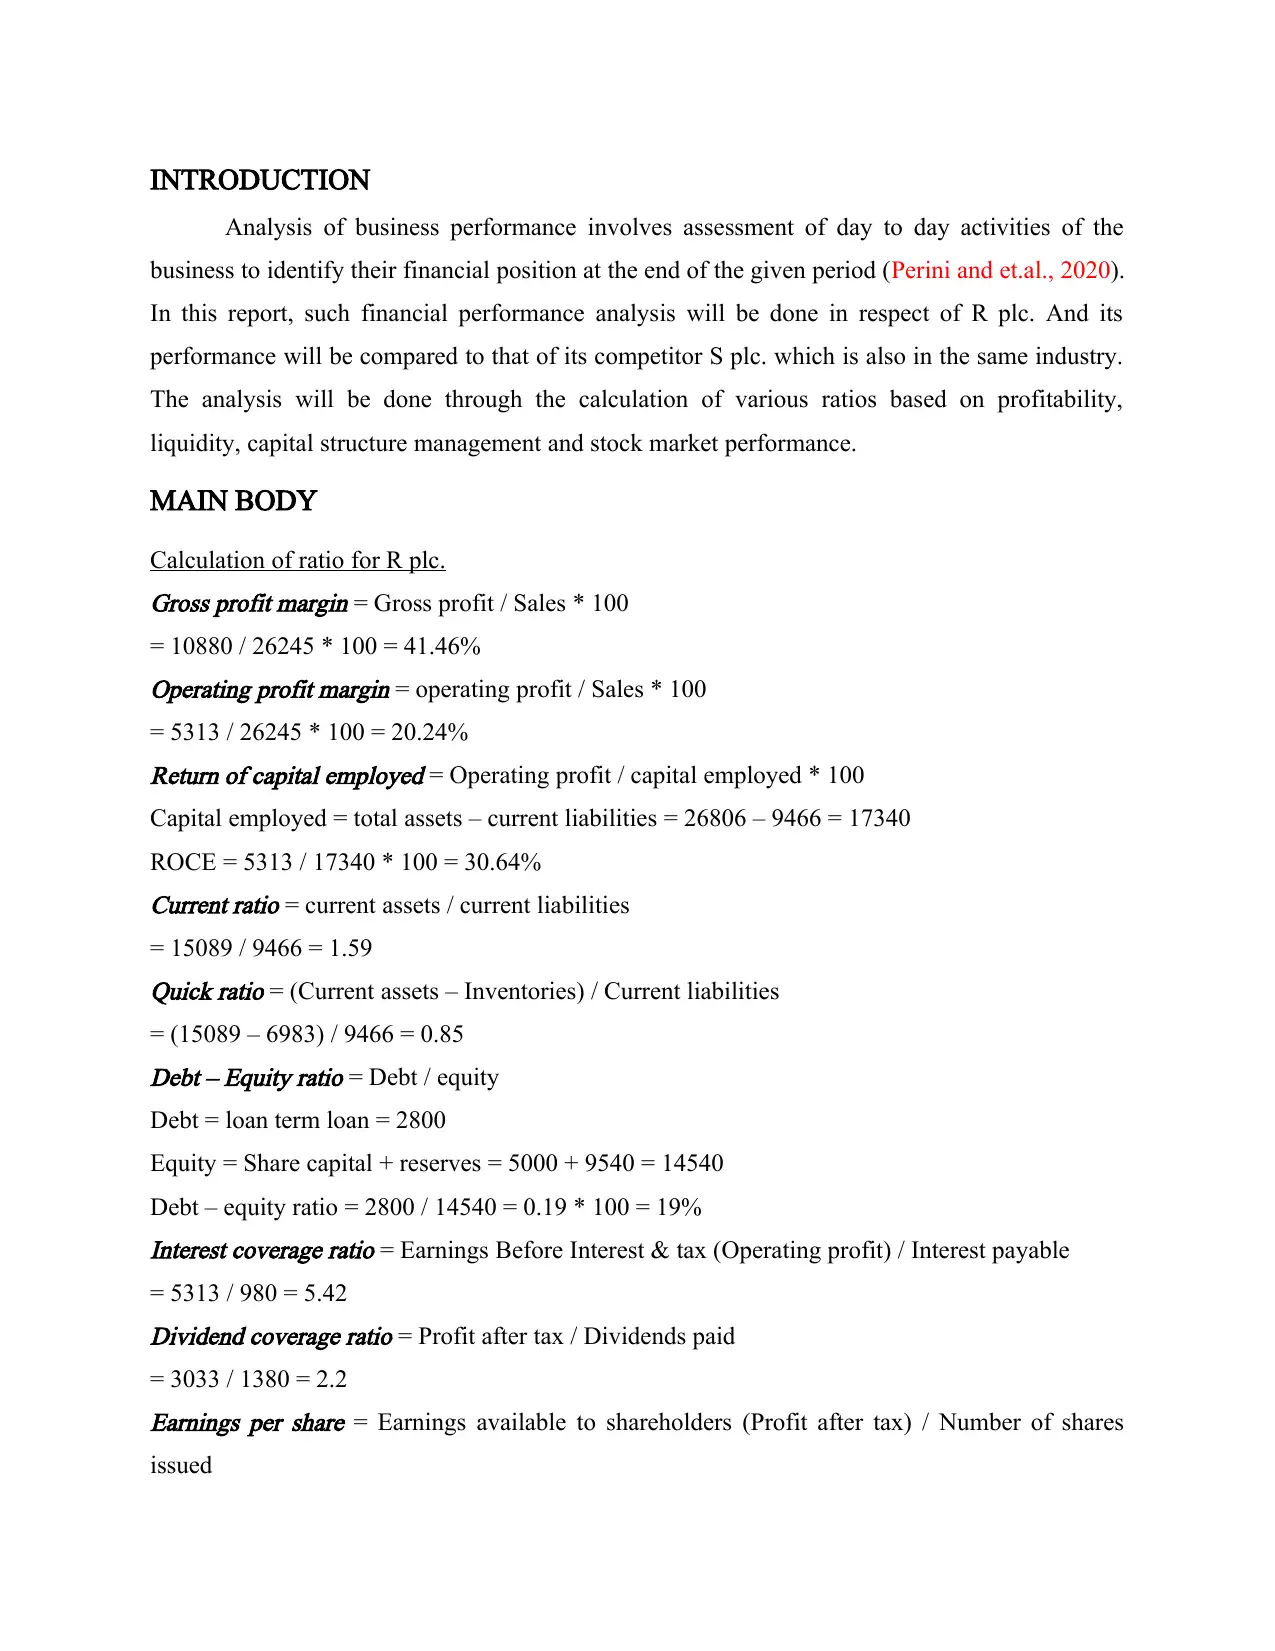
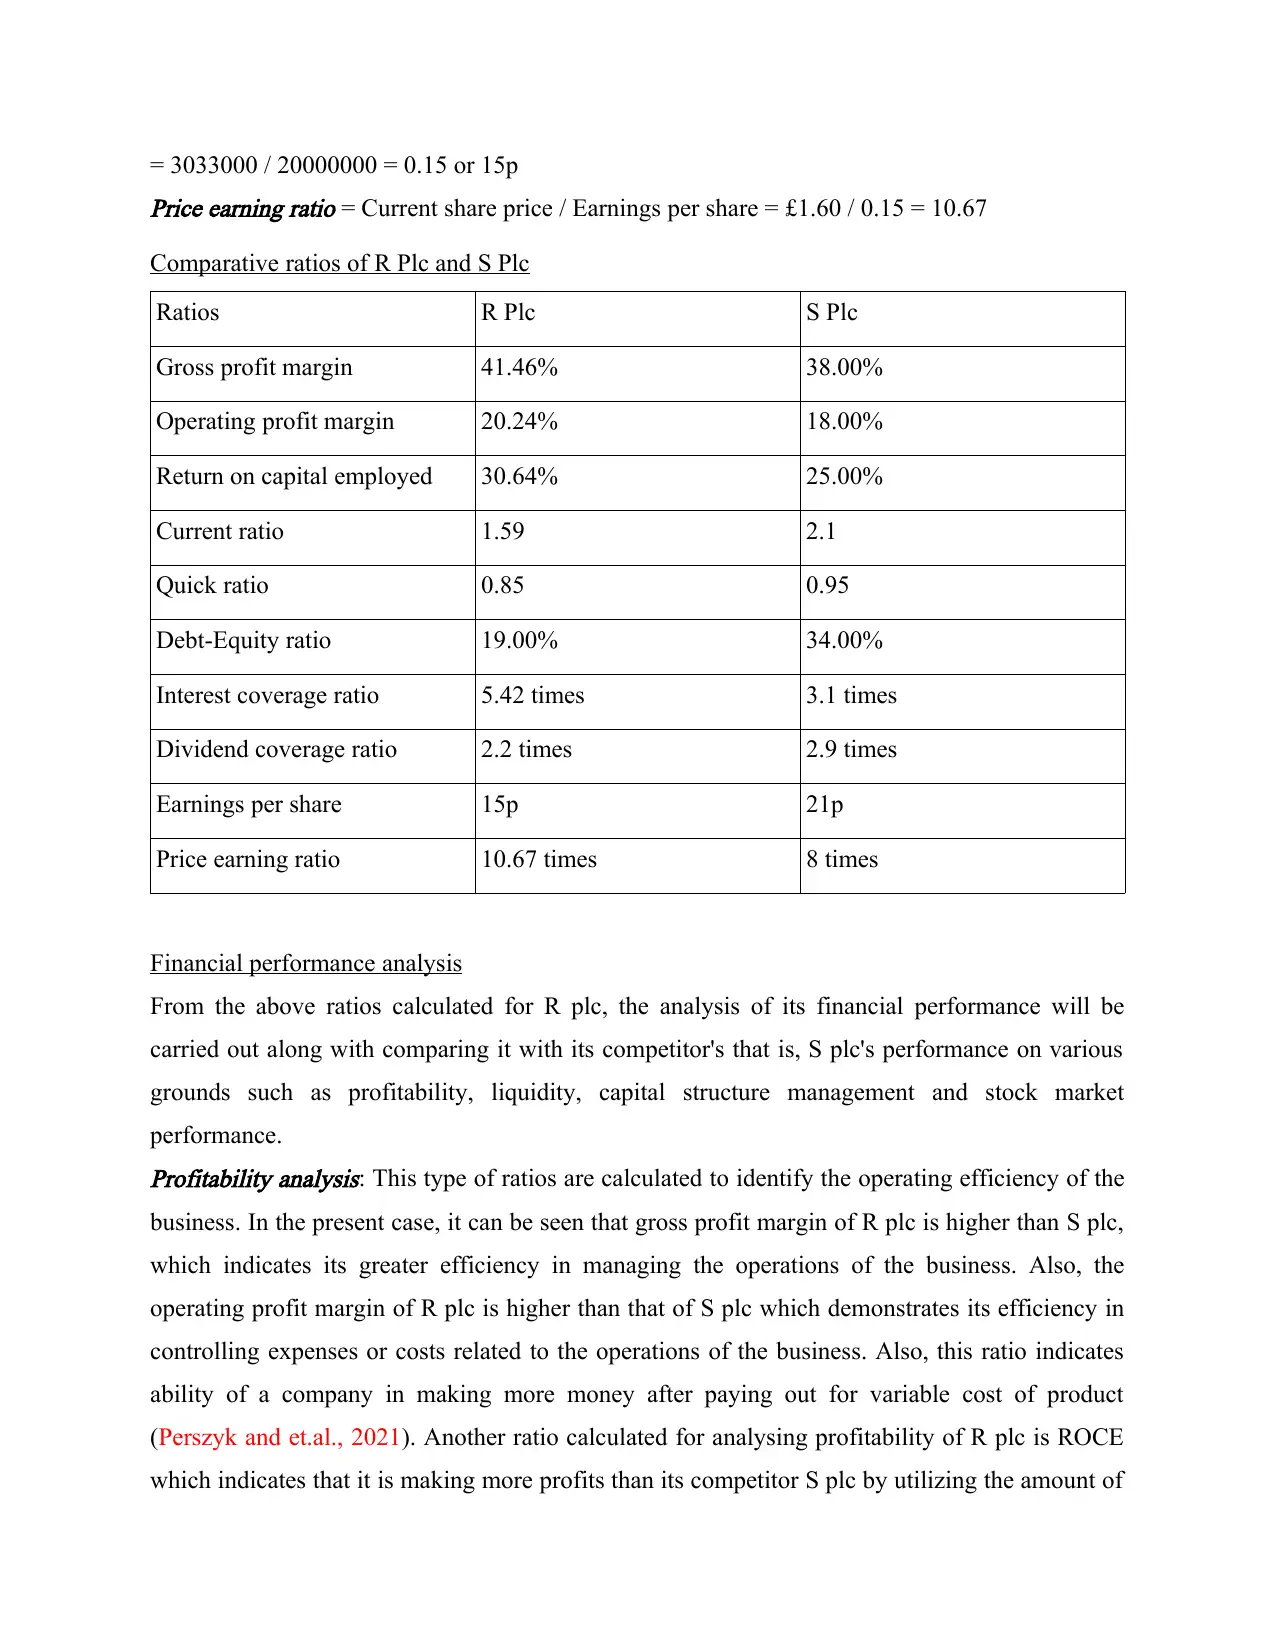
This report provides a comprehensive financial performance analysis of R plc, utilizing various financial ratios related to profitability, liquidity, capital structure management, and stock market performance. The analysis includes a comparison with R plc's competitor, S plc, highlighting key differences in gross profit margin, operating profit margin, return on capital employed (ROCE), current ratio, quick ratio, debt-equity ratio, interest coverage ratio, dividend coverage ratio, earnings per share (EPS), and price-earnings (P/E) ratio. The findings indicate that R plc outperforms S plc in profitability and capital structure management but lags in liquidity, suggesting areas for improvement. The report concludes that while R plc demonstrates strong financial health overall, attention should be given to enhancing its liquidity position to meet short-term obligations more effectively. Desklib offers a range of study tools and resources for students seeking similar financial analysis reports and solved assignments.

BUSINESS PERFORMANCE
Paraphrase This Document
Need a fresh take? Get an instant paraphrase of this document with our AI Paraphraser

TABLE OF CONTENTS
TABLE OF CONTENTS.................................................................................................................2
INTRODUCTION...........................................................................................................................3
MAIN BODY...................................................................................................................................3
Calculation of ratio for R plc......................................................................................................3
Comparative ratios of R Plc and S Plc........................................................................................4
Financial performance analysis...................................................................................................4
CONCLUSION................................................................................................................................5
REFERENCES................................................................................................................................7

INTRODUCTION
Analysis of business performance involves assessment of day to day activities of the
business to identify their financial position at the end of the given period (Perini and et.al., 2020).
In this report, such financial performance analysis will be done in respect of R plc. And its
performance will be compared to that of its competitor S plc. which is also in the same industry.
The analysis will be done through the calculation of various ratios based on profitability,
liquidity, capital structure management and stock market performance.
MAIN BODY
Calculation of ratio for R plc.Gross profit margin = Gross profit / Sales * 100
= 10880 / 26245 * 100 = 41.46%Operating profit margin = operating profit / Sales * 100
= 5313 / 26245 * 100 = 20.24%Return of capital employed = Operating profit / capital employed * 100
Capital employed = total assets – current liabilities = 26806 – 9466 = 17340
ROCE = 5313 / 17340 * 100 = 30.64%Current ratio = current assets / current liabilities
= 15089 / 9466 = 1.59Quick ratio = (Current assets – Inventories) / Current liabilities
= (15089 – 6983) / 9466 = 0.85Debt – Equity ratio = Debt / equity
Debt = loan term loan = 2800
Equity = Share capital + reserves = 5000 + 9540 = 14540
Debt – equity ratio = 2800 / 14540 = 0.19 * 100 = 19%Interest coverage ratio = Earnings Before Interest & tax (Operating profit) / Interest payable
= 5313 / 980 = 5.42Dividend coverage ratio = Profit after tax / Dividends paid
= 3033 / 1380 = 2.2Earnings per share = Earnings available to shareholders (Profit after tax) / Number of shares
issued
⊘ This is a preview!⊘
Do you want full access?
Subscribe today to unlock all pages.

Trusted by 1+ million students worldwide

= 3033000 / 20000000 = 0.15 or 15pPrice earning ratio = Current share price / Earnings per share = £1.60 / 0.15 = 10.67
Comparative ratios of R Plc and S Plc
Ratios R Plc S Plc
Gross profit margin 41.46% 38.00%
Operating profit margin 20.24% 18.00%
Return on capital employed 30.64% 25.00%
Current ratio 1.59 2.1
Quick ratio 0.85 0.95
Debt-Equity ratio 19.00% 34.00%
Interest coverage ratio 5.42 times 3.1 times
Dividend coverage ratio 2.2 times 2.9 times
Earnings per share 15p 21p
Price earning ratio 10.67 times 8 times
Financial performance analysis
From the above ratios calculated for R plc, the analysis of its financial performance will be
carried out along with comparing it with its competitor's that is, S plc's performance on various
grounds such as profitability, liquidity, capital structure management and stock market
performance.Profitability analysis: This type of ratios are calculated to identify the operating efficiency of the
business. In the present case, it can be seen that gross profit margin of R plc is higher than S plc,
which indicates its greater efficiency in managing the operations of the business. Also, the
operating profit margin of R plc is higher than that of S plc which demonstrates its efficiency in
controlling expenses or costs related to the operations of the business. Also, this ratio indicates
ability of a company in making more money after paying out for variable cost of product
(Perszyk and et.al., 2021). Another ratio calculated for analysing profitability of R plc is ROCE
which indicates that it is making more profits than its competitor S plc by utilizing the amount of
Paraphrase This Document
Need a fresh take? Get an instant paraphrase of this document with our AI Paraphraser

capital invested. The ratio indicates return to the shareholders and efficiency in using available
capital. Therefore, R plc is excelling due to its profitability over its competitor S plc.Liquidity analysis: Current ratio indicates business's ability in meeting its short term obligations
out of the current assets available with it. An ideal requirement towards maintaining current ratio
is 2:1. In the case of R plc it is having quite lower liquidity than S plc and the later is also
meeting the ideal requirement. However, R plc is having higher ratio than minimum requirement
which is 1:1. Therefore, both R plc and S plc has enough liquidity to meet its short term
obligations (Rey and et.al., 2021). Also, quick ratio, which is an indicator of company's liquidity
position is higher for S plc than R plc. This ratio indicates company's ability in immediately
meeting its current liabilities through highly liquid assets and ideal the ratio should be 1:1.
However, both R plc and S plc is having lower ratio and thus may face difficulties in meeting
their short term obligations immediately.Capital structure management: This types of ratio indicates financial risk for the business by
analysing the proportion of debt and equity in the business. Here, S plc is prone to higher
financial risk than R plc due to having higher D/E ratio (Lovell, Chua and McGrath, 2020). Also,
interest coverage ratio of R plc is higher which means strong financial health and capability of R
plc in meeting its interest payment than S plc. However, Dividend coverage ratio of S plc is
higher than R plc which indicates that the company is generating more returns for its
shareholders and thus is favourable.Stock market performance: Earnings per share and price earnings ratio are the indicator of
company's stock market performance. Here, S plc is generating more returns for its shareholders
as its EPS is higher than R plc. This is favourable because the company's value can be increased
with higher EPS as investors get ready pay for company's share and thus its share price gets
increased (Le and et.al., 2020). Also, P/E ratio indicates how many more times company's
shareholders are willing to pay for its share as against earnings per share and this ratio is higher
for R plc than S plc. It indicates under and over valuation of share, but a lower ratio is preferable
for both the business and investors.
CONCLUSION
From the above report, it has been concluded that R plc's financial performance is better
than that of its competitor S plc on certain grounds such as profitability, capital structure

management and stock market performance except on liquidity ground. R plc is required to work
upon its liquidity as its current and quick ratio are below the ideal requirement.
⊘ This is a preview!⊘
Do you want full access?
Subscribe today to unlock all pages.

Trusted by 1+ million students worldwide

REFERENCES
Le, N. H. and et.al., 2020. Multivariate ratio analysis and DNA markers reveal a new Australian
species and three synonymies in eucalypt-gall-associated Megastigmus (Hymenoptera:
Megastigmidae).
Bulletin of Entomological Research. 110(6). pp.709-724.
Lovell, D. R., Chua, X. Y. and McGrath, A., 2020. Counts: an outstanding challenge for log-ratio
analysis of compositional data in the molecular biosciences.
NAR genomics and
bioinformatics. 2(2). p.lqaa040.
Perini, M. and et.al., 2020. Stable isotope ratio analysis combined with inductively coupled
plasma‐mass spectrometry for geographical discrimination between Italian and foreign
saffron.
Journal of Mass Spectrometry. 55(11). p.e4595.
Perszyk, R.E. and et.al., 2021. Three-dimensional missense tolerance ratio analysis.
Genome
Research. 31(8). pp.1447-1461.
Rey, F. and et.al., 2021. Fatty acid ratio analysis identifies changes in competent meroplanktonic
larvae sampled over different supply events.
Marine Environmental Research, p.105517.
1 out of 7
Related Documents

Your All-in-One AI-Powered Toolkit for Academic Success.
+13062052269
info@desklib.com
Available 24*7 on WhatsApp / Email
Unlock your academic potential
Copyright © 2020–2025 A2Z Services. All Rights Reserved. Developed and managed by ZUCOL.