BN208 - Wireshark Analysis of Networked Applications Performance
VerifiedAdded on 2023/06/11
|15
|1284
|248
Report
AI Summary
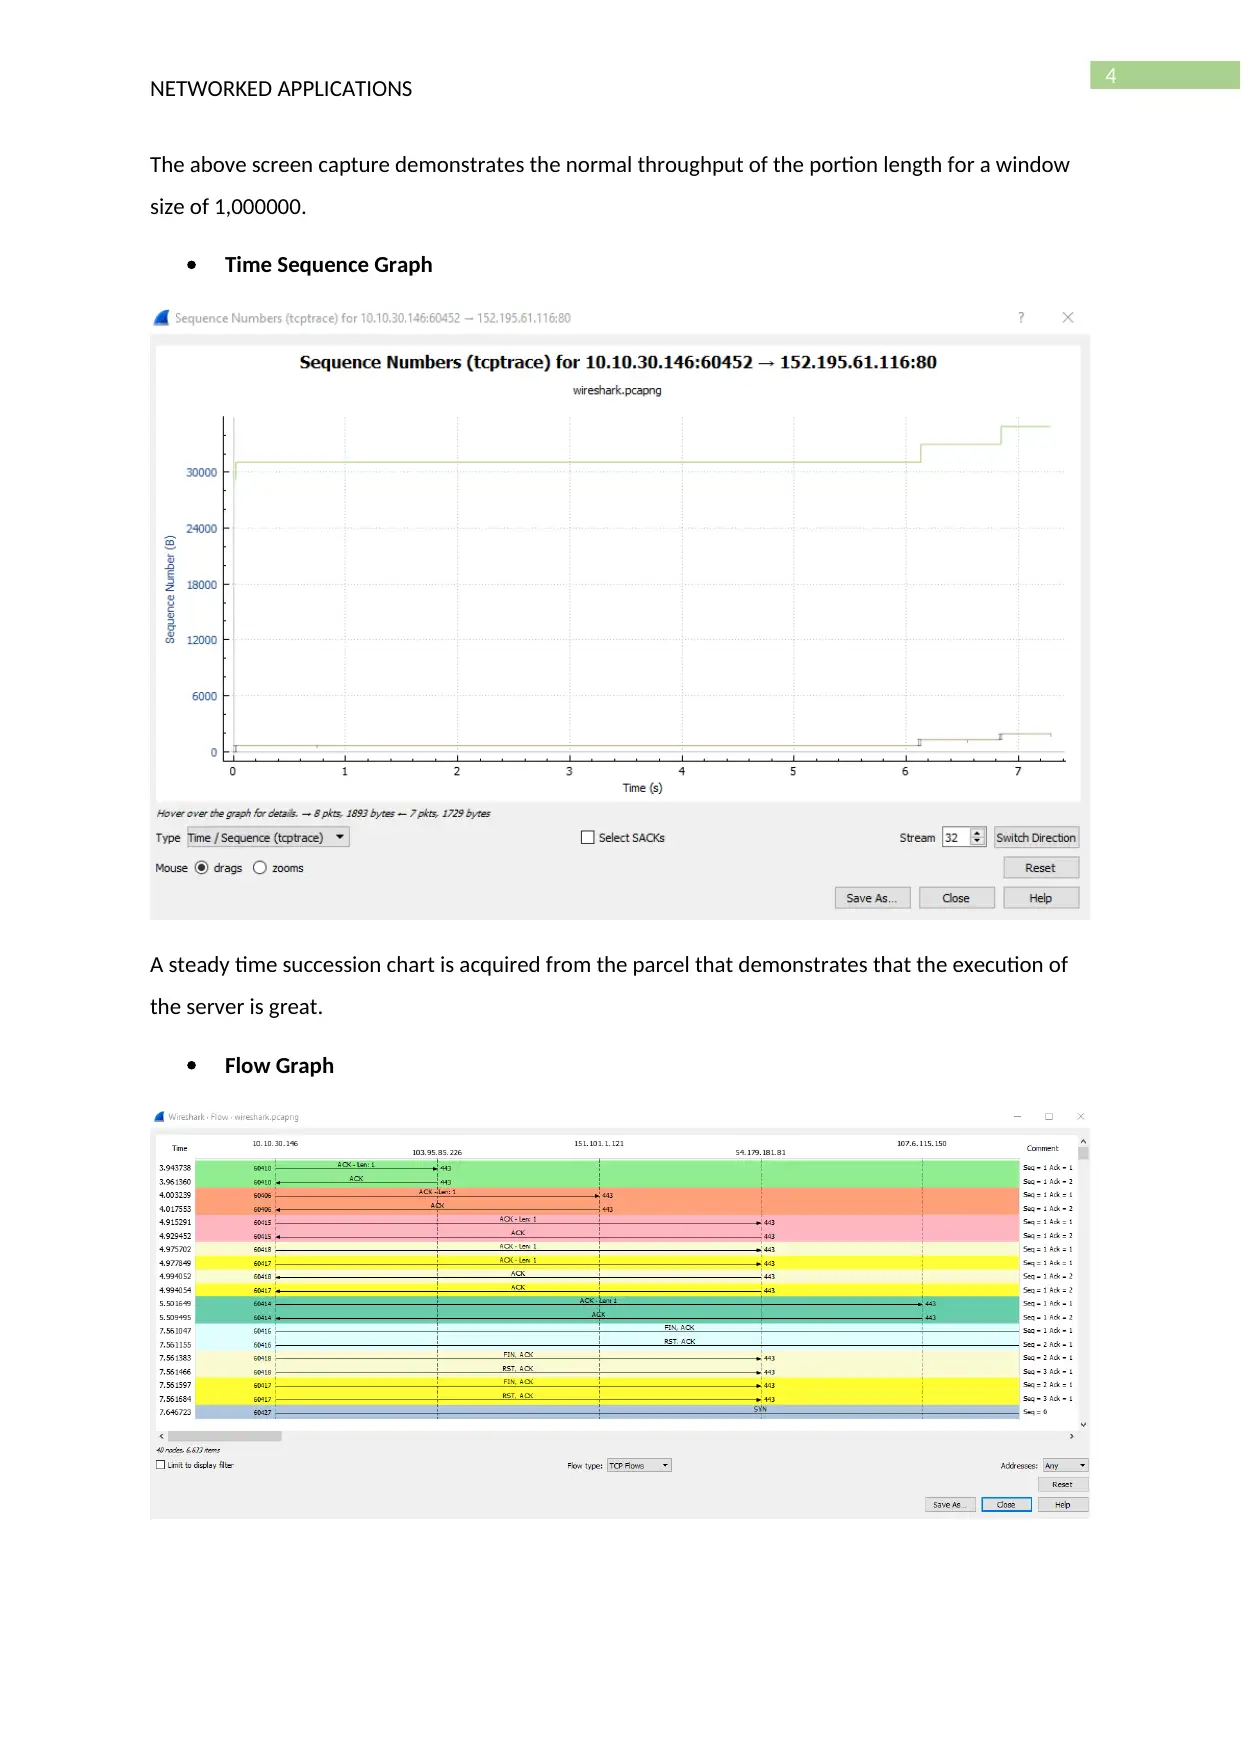
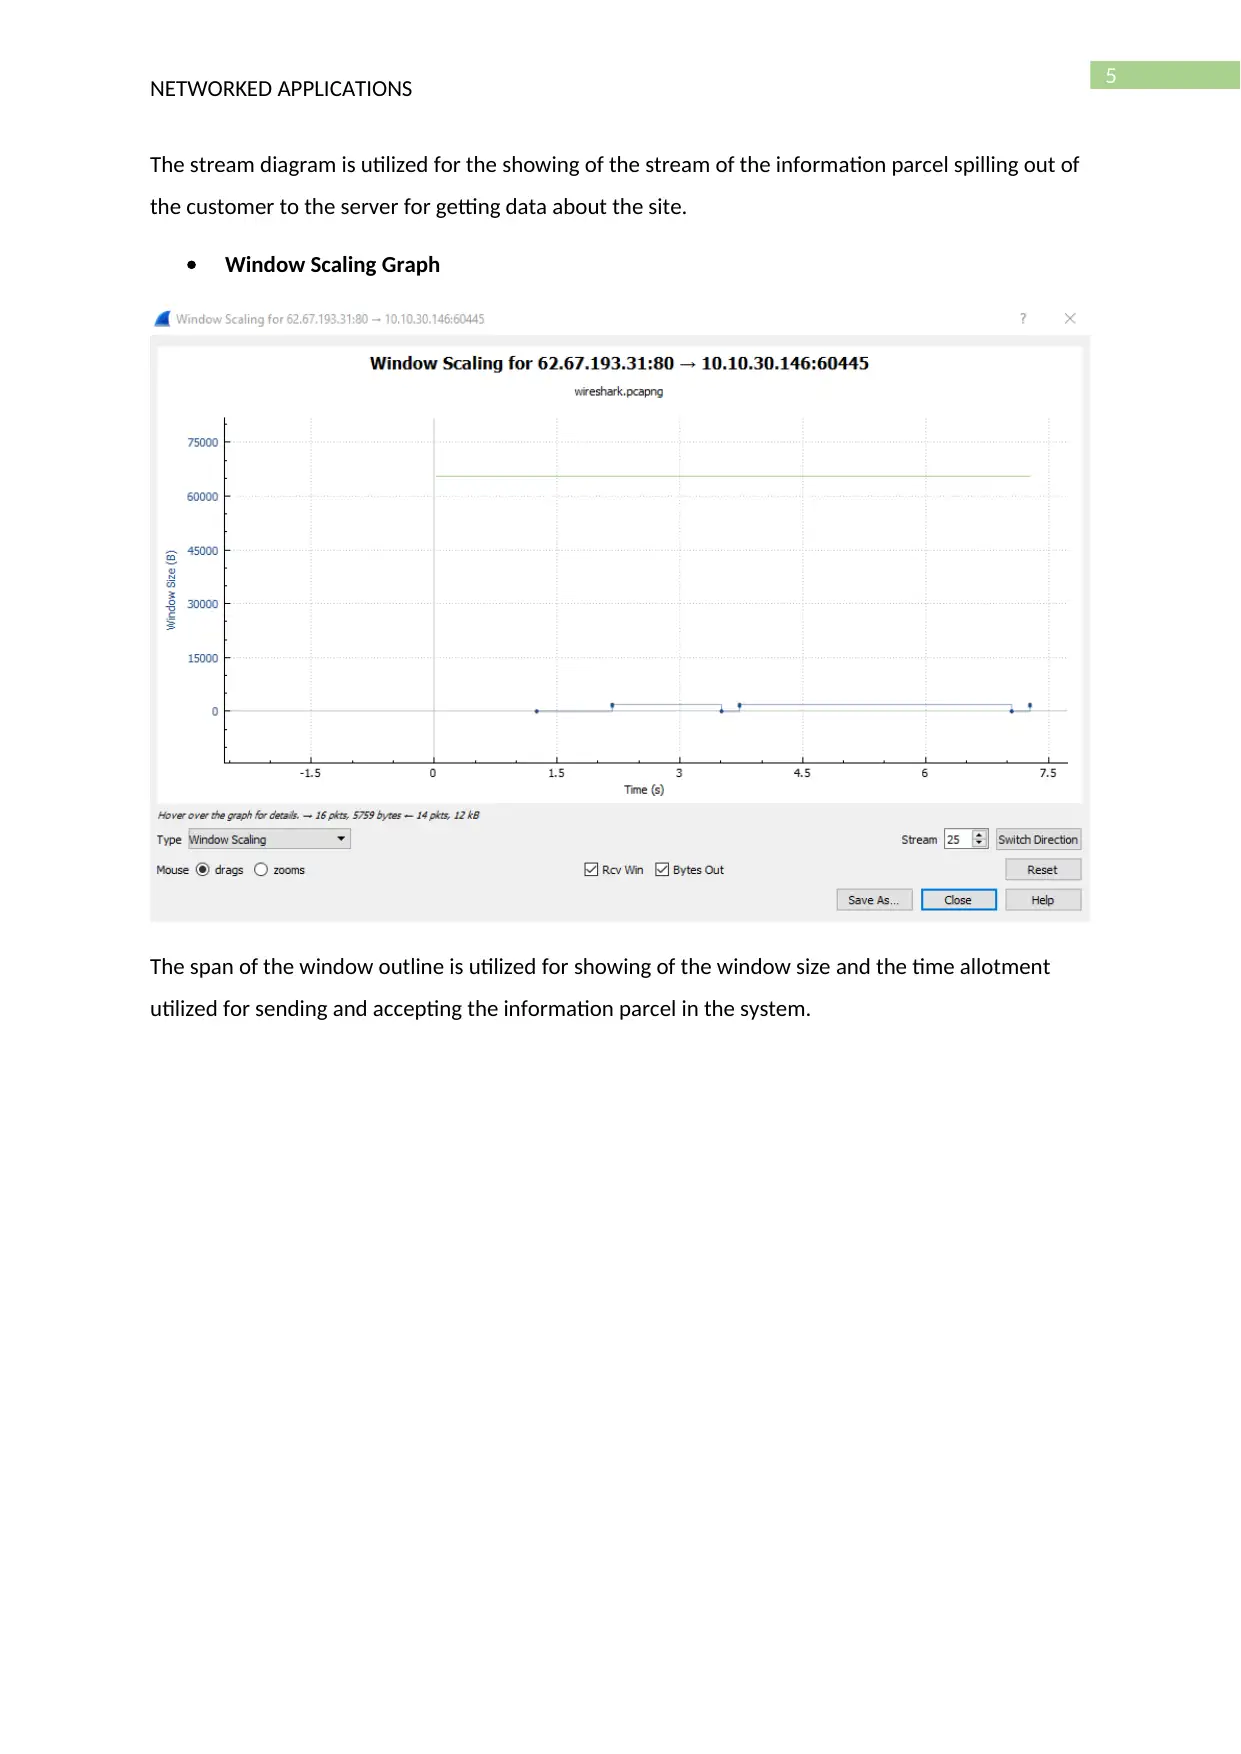
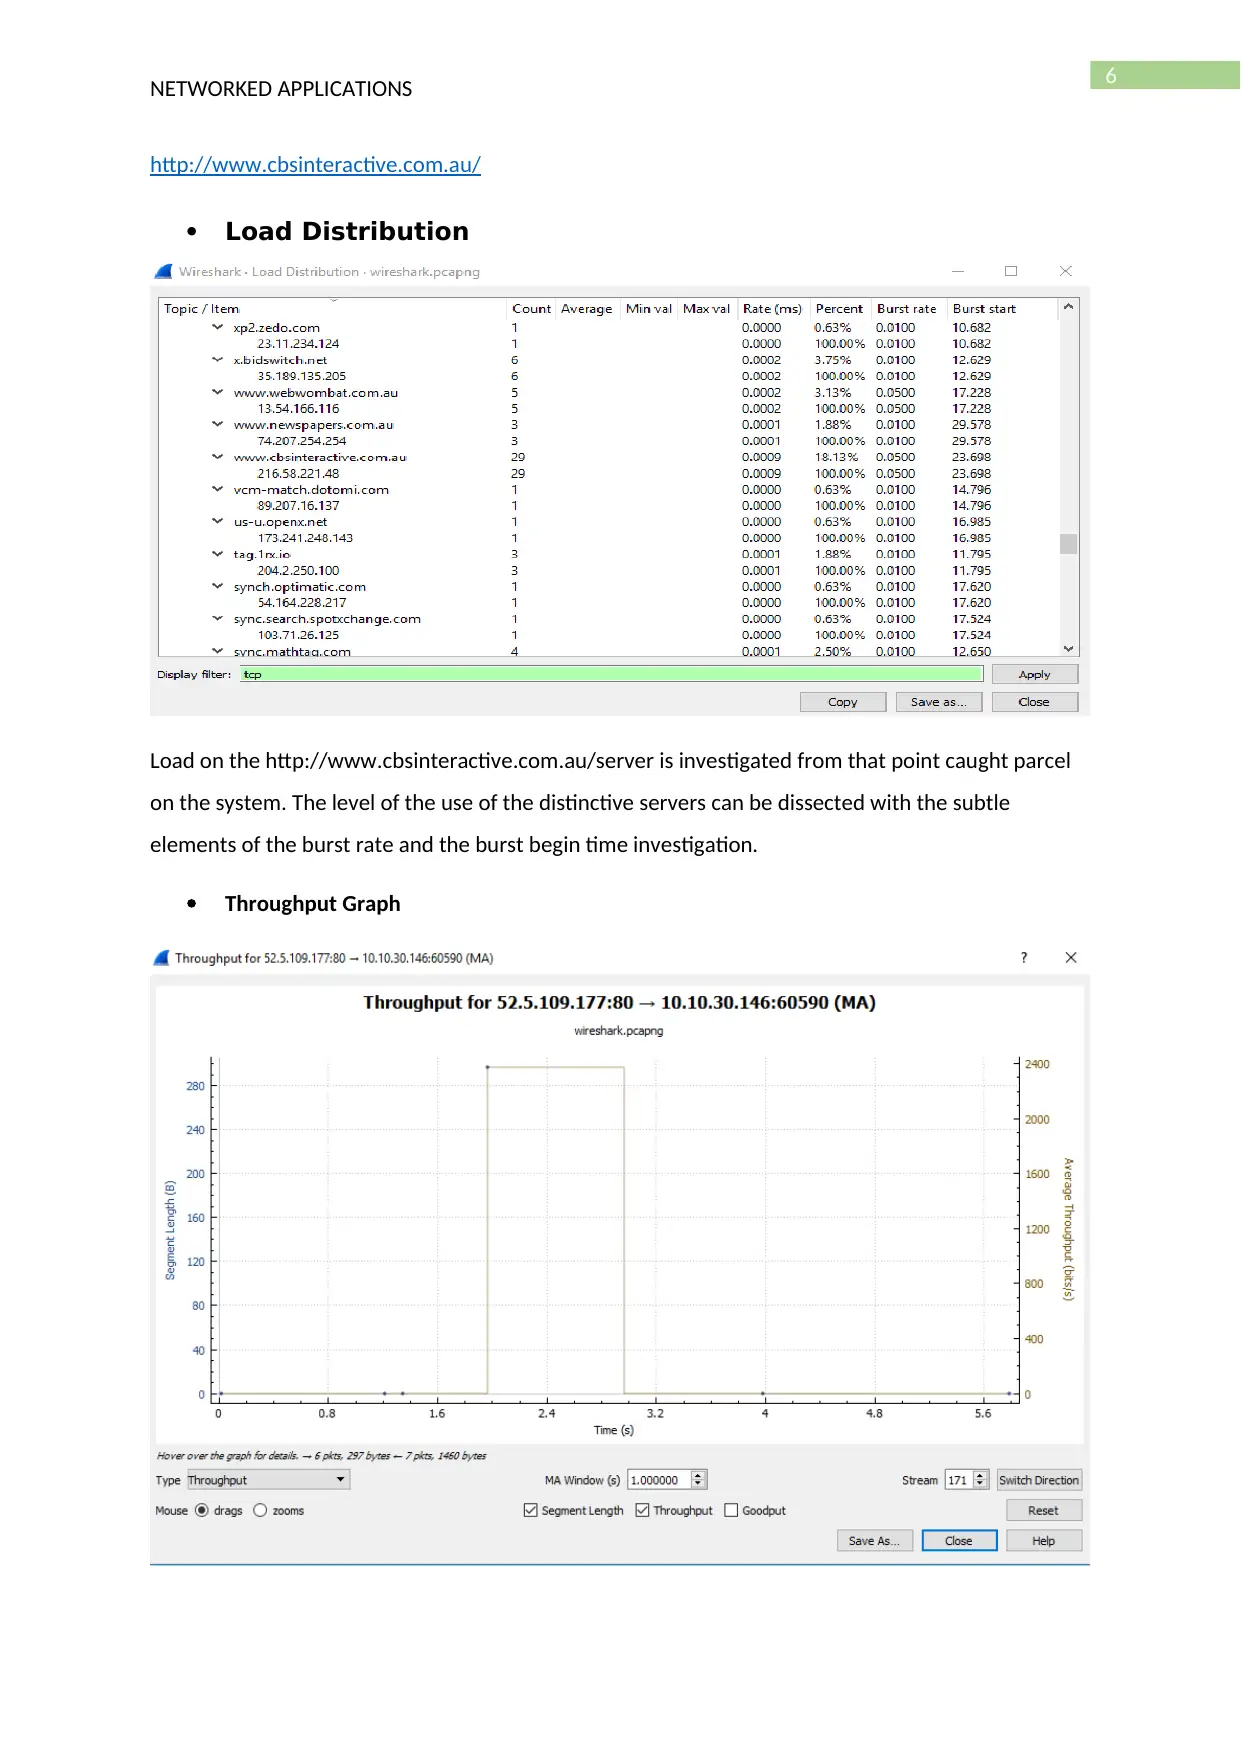
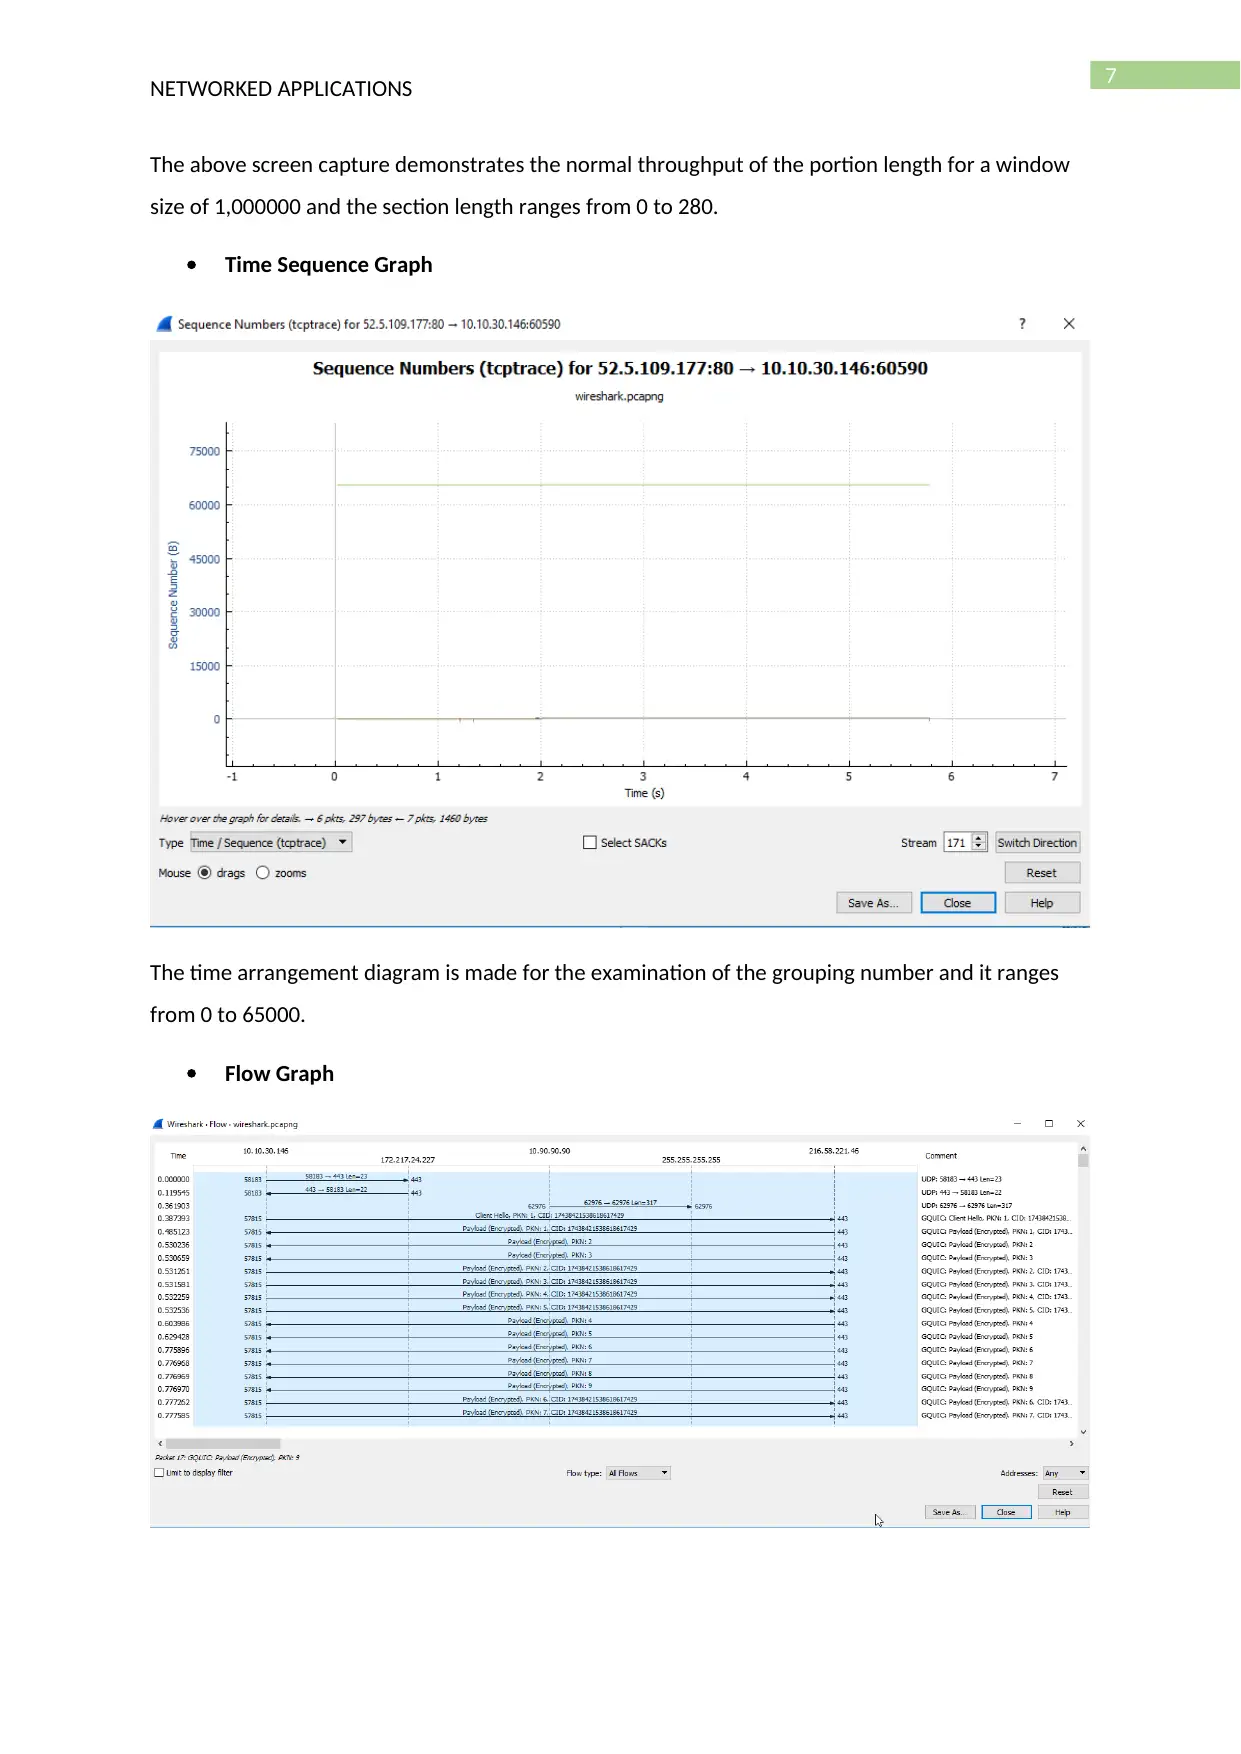
This report investigates the performance of four websites using Wireshark, capturing live data packets to analyze network behavior. It assesses website performance based on load distribution, throughput, time sequence graphs, flow graphs, and window scaling graphs. The analysis identifies server IP addresses, window sizes, and maximum segment sizes, providing insights into the response time and overall execution of the websites. The study concludes that the tested sites exhibit stability and good performance in handling multiple concurrent users. Desklib offers a wide range of solved assignments and resources for students.

Running head: NETWORKED APPLICATIONS
Analyse Network Performance
Name of the Student
Name of the University
Author’s Note
Analyse Network Performance
Name of the Student
Name of the University
Author’s Note
Paraphrase This Document
Need a fresh take? Get an instant paraphrase of this document with our AI Paraphraser

1
NETWORKED APPLICATIONS
Table of Contents
Introduction...........................................................................................................................................2
Task 1.....................................................................................................................................................2
Load Distribution.......................................................................................................................3
Load Distribution.......................................................................................................................6
Load Distribution.......................................................................................................................9
Throughput Graph.....................................................................................................................9
Task 2...................................................................................................................................................12
Throughput Graph...................................................................................................................12
Time Sequence Graph..............................................................................................................12
Conclusion...........................................................................................................................................13
Bibliography.........................................................................................................................................14

2
NETWORKED APPLICATIONS
Introduction
The report is set up for the investigation of the four site utilizing the diagnostic expertise and
wireshark. Live data packets are captured from the interface of a local machine connected in a
network after visiting the three sites for analysis of the performance of the network and the
websites. The three sites are assessed as far as the execution and the conveyance of the heap is
broke down with the assistance of production of a throughput graph, flow graph, time sequence
graph and windows scaling graph. The live information parcels are caught from the system that aides
in distinguishing proof of the reaction time and produce the grouping chart. Diverse display filters
are used for narrowing the scan for the investigation of the site and generating the different graphs
from the system. Observing of the information activity is finished by investigating the information
parcels caught between the client and the server.
Task 1
The TCP and the HTTP packets are captured form the network and the given three websites are
visited for getting information about the client machine and the servers used by the website to host
their sites. The distribution of the loads on the servers can be analysed with the generation of the
load distribution report and analysing the performance of the website. It also helps in identification
of the ad servers and other traffic that are generated and the links that are redirected for reaching
the servers.
Analysis of http://www.onlinenewspapers.com/australi.htm
You're viewing a preview
Unlock full access by subscribing today!

3
NETWORKED APPLICATIONS
Load Distribution
The above load distribution graph is utilized for the investigation of the system stack on the server
and display filter is utilized for opening the website.
Throughput Graph
NETWORKED APPLICATIONS
Load Distribution
The above load distribution graph is utilized for the investigation of the system stack on the server
and display filter is utilized for opening the website.
Throughput Graph
Paraphrase This Document
Need a fresh take? Get an instant paraphrase of this document with our AI Paraphraser

4
NETWORKED APPLICATIONS
The above screen capture demonstrates the normal throughput of the portion length for a window
size of 1,000000.
Time Sequence Graph
A steady time succession chart is acquired from the parcel that demonstrates that the execution of
the server is great.
Flow Graph
NETWORKED APPLICATIONS
The above screen capture demonstrates the normal throughput of the portion length for a window
size of 1,000000.
Time Sequence Graph
A steady time succession chart is acquired from the parcel that demonstrates that the execution of
the server is great.
Flow Graph

5
NETWORKED APPLICATIONS
The stream diagram is utilized for the showing of the stream of the information parcel spilling out of
the customer to the server for getting data about the site.
Window Scaling Graph
The span of the window outline is utilized for showing of the window size and the time allotment
utilized for sending and accepting the information parcel in the system.
You're viewing a preview
Unlock full access by subscribing today!

6
NETWORKED APPLICATIONS
http://www.cbsinteractive.com.au/
Load Distribution
Load on the http://www.cbsinteractive.com.au/server is investigated from that point caught parcel
on the system. The level of the use of the distinctive servers can be dissected with the subtle
elements of the burst rate and the burst begin time investigation.
Throughput Graph
Paraphrase This Document
Need a fresh take? Get an instant paraphrase of this document with our AI Paraphraser

7
NETWORKED APPLICATIONS
The above screen capture demonstrates the normal throughput of the portion length for a window
size of 1,000000 and the section length ranges from 0 to 280.
Time Sequence Graph
The time arrangement diagram is made for the examination of the grouping number and it ranges
from 0 to 65000.
Flow Graph

8
NETWORKED APPLICATIONS
The stream of the information activity and the data is broke down for the advancement of the
system examination report for the site http://www.cbsinteractive.com.au/.
Window Scaling Graph
The span of the window outline is utilized for show of the window measure and the time allotment
utilized for sending and accepting the information parcel in the system.
http://www.newspapers.com.au/
You're viewing a preview
Unlock full access by subscribing today!

9
NETWORKED APPLICATIONS
Load Distribution
Distribution of load for http://www.newspapers.com.au/server is examined frame the parcel caught
shape the system interface.
Throughput Graph
NETWORKED APPLICATIONS
Load Distribution
Distribution of load for http://www.newspapers.com.au/server is examined frame the parcel caught
shape the system interface.
Throughput Graph
Paraphrase This Document
Need a fresh take? Get an instant paraphrase of this document with our AI Paraphraser

10
NETWORKED APPLICATIONS
The through put chart is made for the examination of the through put of the
http://www.newspapers.com.au/server. The length of the portion ranges from 0 to 5000 and it is
utilized as the normal throughput.
Time Sequence Graph
The time sequence chart is made from the wireshark and from the examination it is discovered that
the association is steady and direct diagram is acquired from the investigation.
Flow Graph

11
NETWORKED APPLICATIONS
The flow diagram is made for the examination of the stream of the information activity in the system
for associating with the http://www.newspapers.com.au/server.
Window Scaling Graph
The windows scaling chart is made for the investigation of the window estimate for the
http://www.newspapers.com.au/and it ranges from 0 to 30000.
You're viewing a preview
Unlock full access by subscribing today!

12
NETWORKED APPLICATIONS
Task 2
Throughput Graph
Time Sequence Graph
NETWORKED APPLICATIONS
Task 2
Throughput Graph
Time Sequence Graph
Paraphrase This Document
Need a fresh take? Get an instant paraphrase of this document with our AI Paraphraser

13
NETWORKED APPLICATIONS
Conclusion
The investigation of the three website using wireshark is a compelling instrument that can help in
recognizing the stream of the data packets in the system and dissect the execution of the sites. The
execution of the site are estimated as far as the capacity of dissemination of the heaps, throughput,
rime grouping, stream diagram and window scaling chart. The site is opened and the live parcels are
caught utilizing the wireshark and it is dissected for the arrangement of the report. BY examining the
execution of the four sites it has been discovered that the destinations are steady and have a decent
execution for taking care of more number of clients at any given moment. The investigation helps in
finding the IP address of the server facilitated by the site and diverse data are accumulated, for
example, the window estimate, most extreme size of the section, windows scaling alternative and
qualities. The reaction time of the framework can be examined for the recognizable proof of the
execution of the site.

14
NETWORKED APPLICATIONS
Bibliography
[1]. Chappell, L. Wireshark 101: Essential Skills for Network Analysis-Wireshark Solution Series.
Laura Chappell University., 2017.
[2]. Sanders, C. Practical packet analysis: Using Wireshark to solve real-world network problems.
No Starch Press., 2017.
[3]. Ndatinya, V., Xiao, Z., Manepalli, V.R., Meng, K. and Xiao, Y. Network forensics analysis using
Wireshark. International Journal of Security and Networks, 10(2), pp.91-106., 2015.
[4]. Walnycky, D., Baggili, I., Marrington, A., Moore, J. and Breitinger, F. Network and device
forensic analysis of android social-messaging applications. Digital Investigation, 14, pp.S77-
S84., 2015.
[5]. Messier, R. Packet Capture and Analysis. Network Forensics, pp.81-112., 2017.
[6]. Cappers, B.C. and van Wijk, J.J. Semantic Network Traffic Analysis using Deep Packet
Inspection and Visual Analytics., 2017.
[7]. Quadrio, G., Bujari, A., Palazzi, C.E., Ronzani, D., Maggiorini, D. and Ripamonti, L.A. Network
analysis of the steam in-home streaming game system: poster. In Proceedings of the 22nd
Annual International Conference on Mobile Computing and Networking (pp. 475-476). ACM.,
2016, October.
You're viewing a preview
Unlock full access by subscribing today!
1 out of 15
Related Documents

Your All-in-One AI-Powered Toolkit for Academic Success.
+13062052269
info@desklib.com
Available 24*7 on WhatsApp / Email
Unlock your academic potential
© 2024 | Zucol Services PVT LTD | All rights reserved.