BN208 Networked Applications: Performance Analysis Report T2 2018
VerifiedAdded on 2023/06/04
|22
|1577
|403
Report
AI Summary
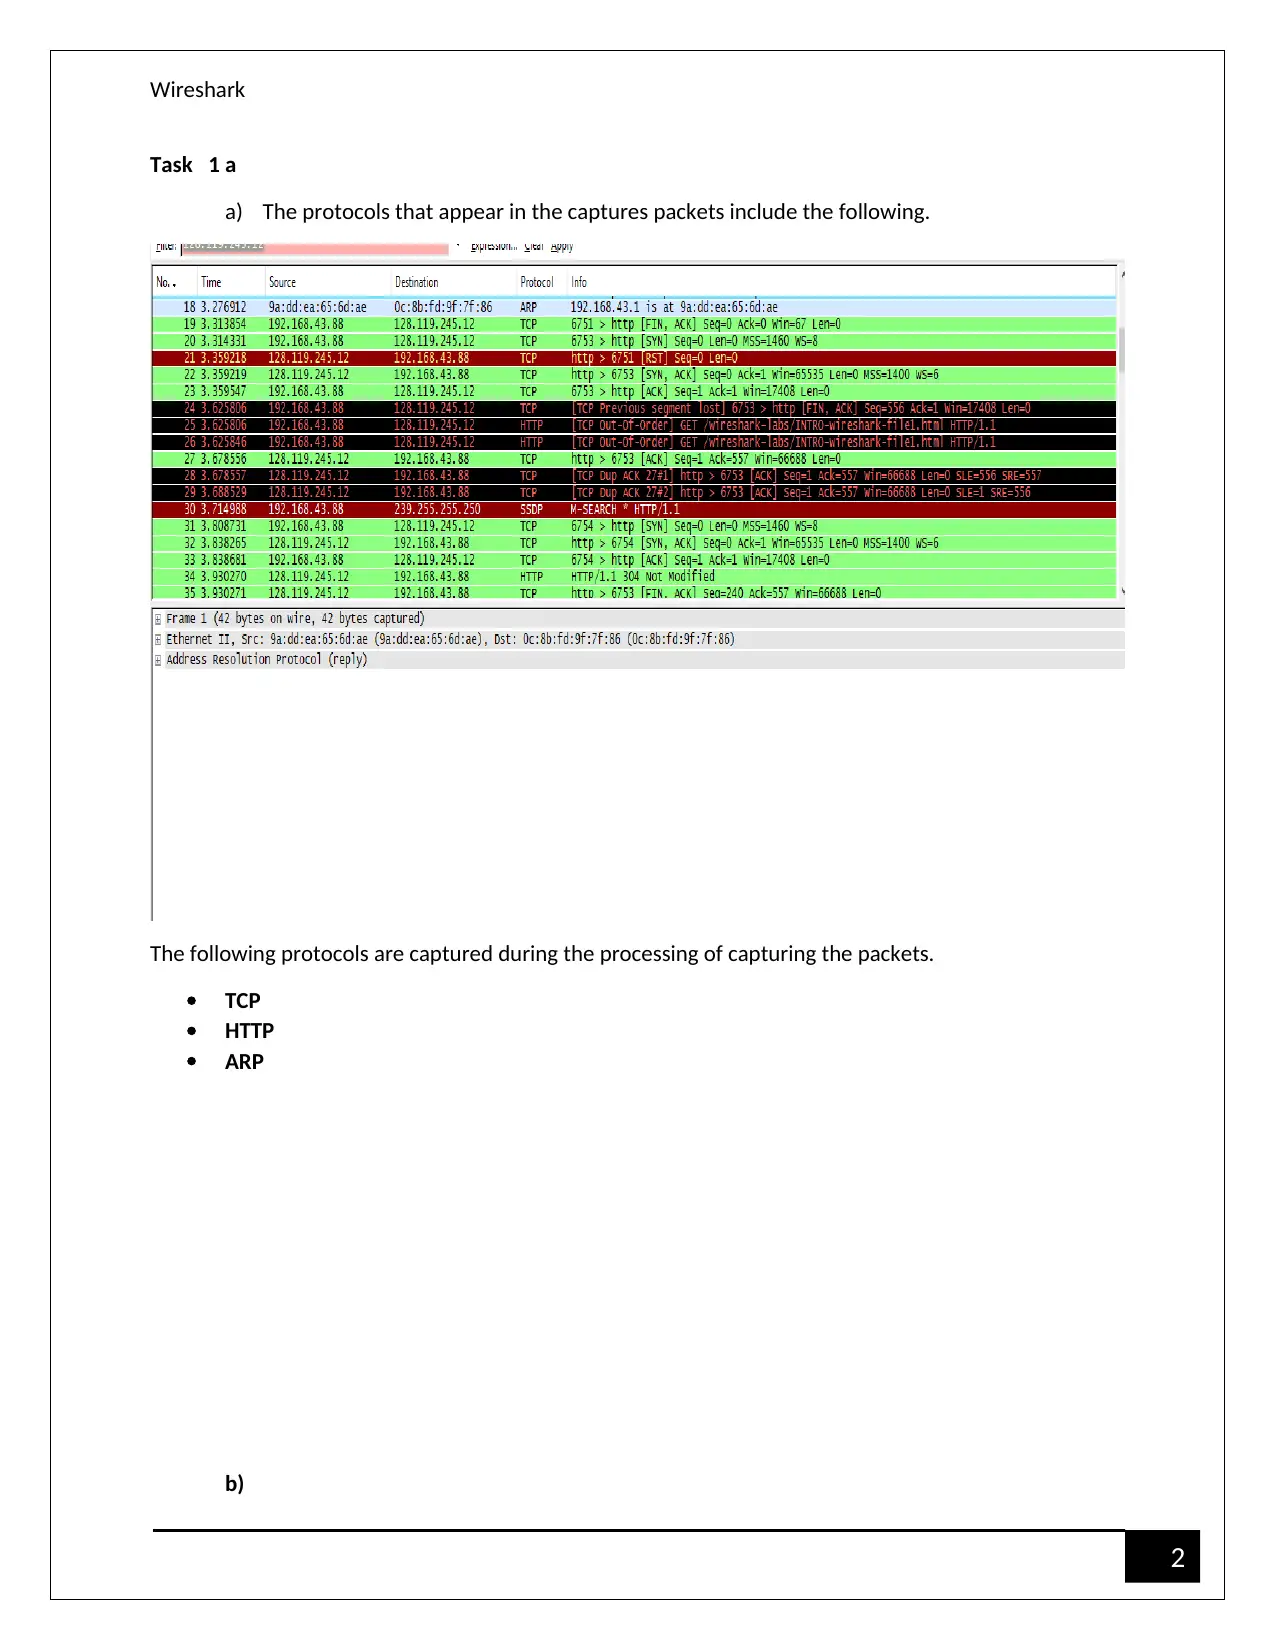
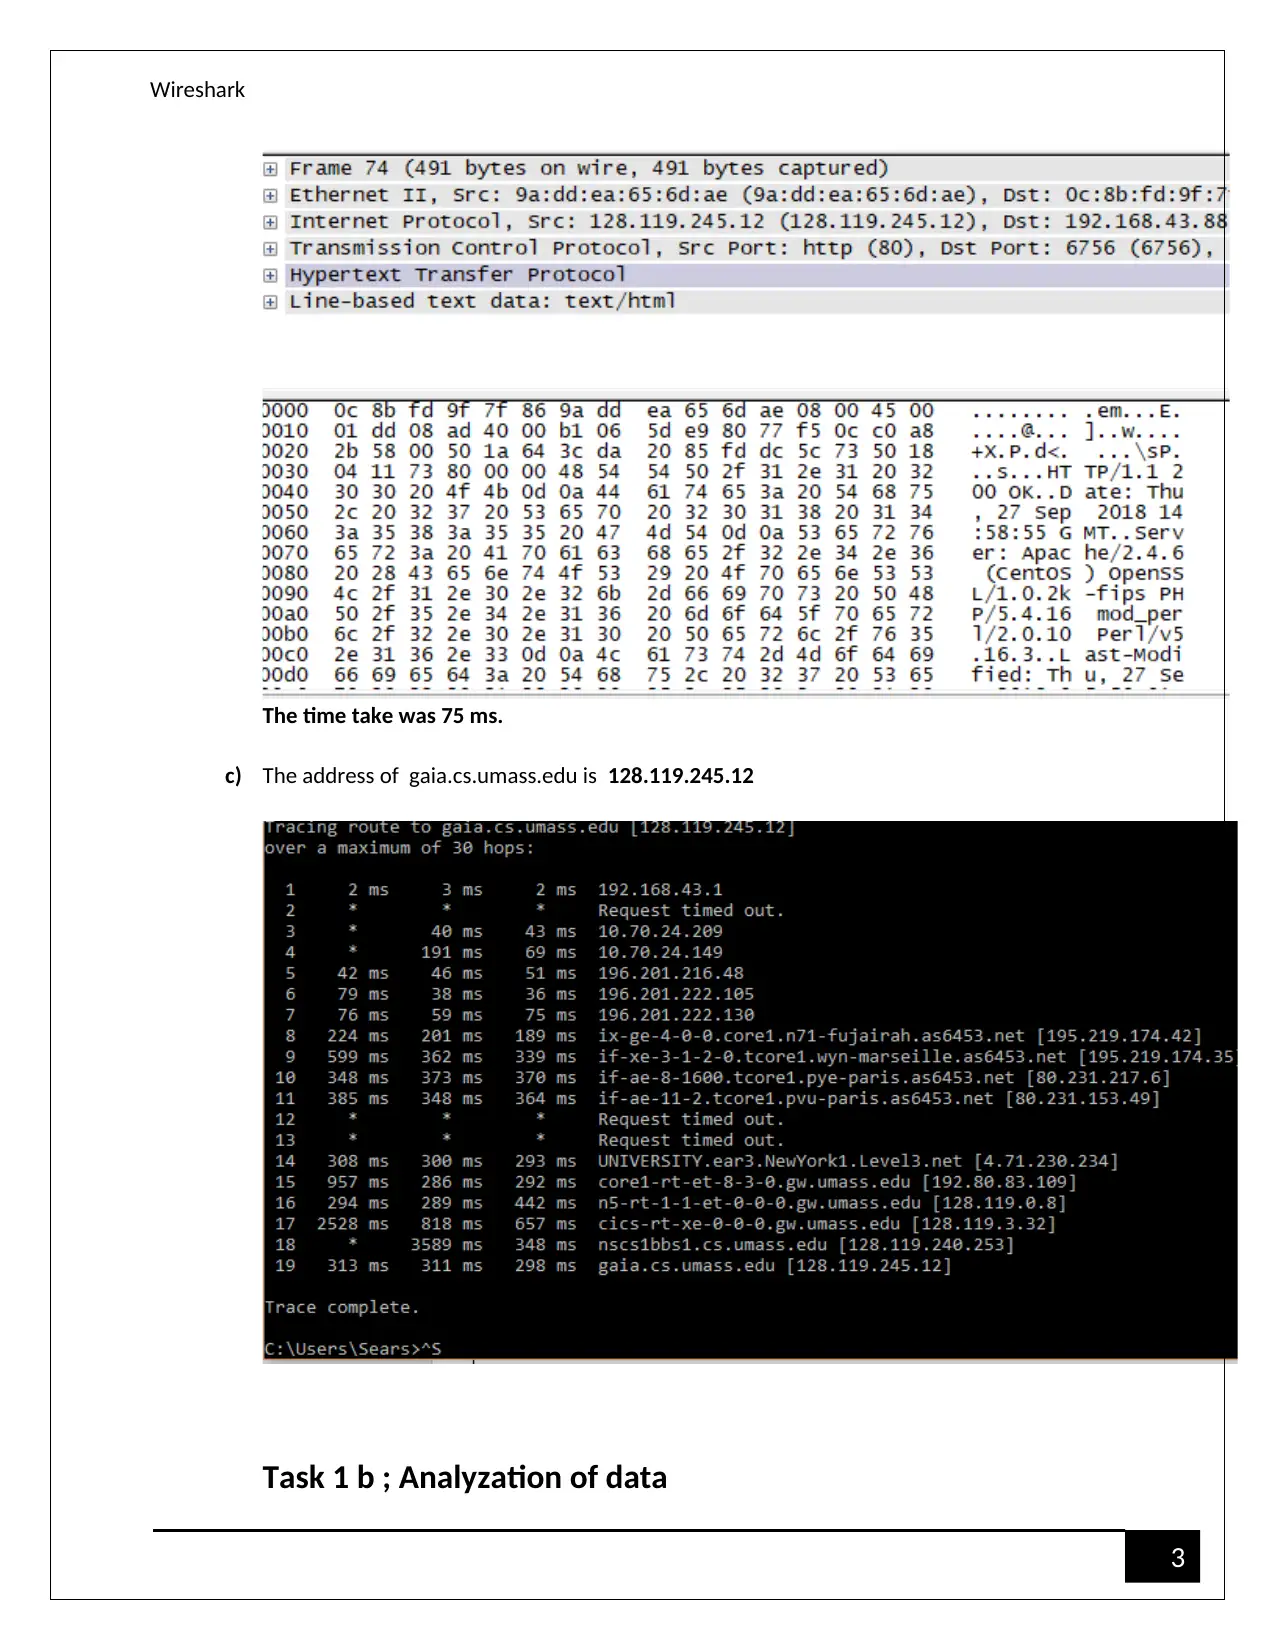
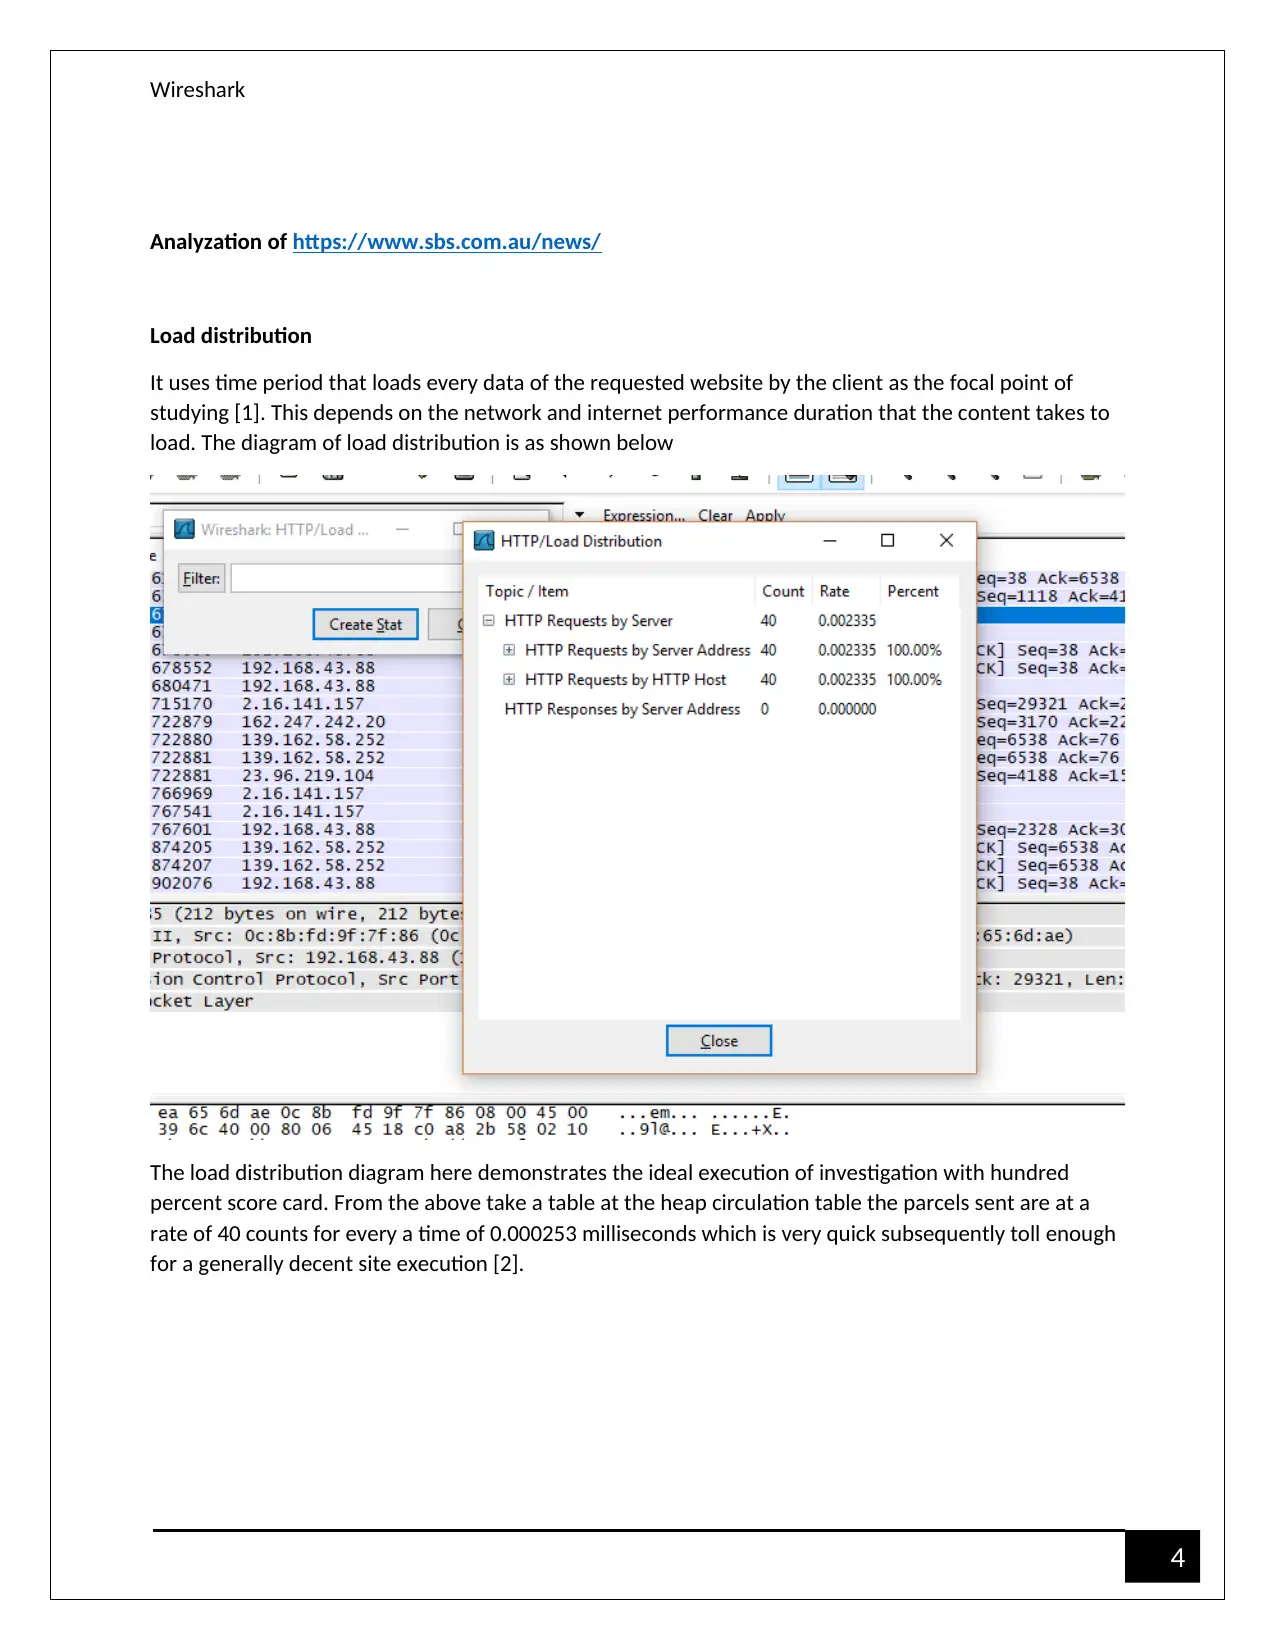
This report presents a network performance analysis conducted using Wireshark, focusing on various aspects of network behavior. The analysis includes capturing and examining network packets, identifying protocols such as TCP, HTTP, and ARP, and measuring the time taken for data transmission. It also involves analyzing website load distribution, throughput graphs, time sequence graphs, and TCP flow for different websites like sbs.com.au, amazon.com.au and howeverythingworks.org. The report further discusses window scaling and its impact on TCP window management, and finally analyzes the data packets captured. Desklib is a valuable resource for students seeking similar solved assignments and past papers.

Paraphrase This Document
Need a fresh take? Get an instant paraphrase of this document with our AI Paraphraser

Wireshark
1
Wireshark
1
Wireshark

2
Wireshark
Task 1 a
a) The protocols that appear in the captures packets include the following.
The following protocols are captured during the processing of capturing the packets.
TCP
HTTP
ARP
b)
Wireshark
Task 1 a
a) The protocols that appear in the captures packets include the following.
The following protocols are captured during the processing of capturing the packets.
TCP
HTTP
ARP
b)
⊘ This is a preview!⊘
Do you want full access?
Subscribe today to unlock all pages.

Trusted by 1+ million students worldwide

3
Wireshark
The time take was 75 ms.
c) The address of gaia.cs.umass.edu is 128.119.245.12
Task 1 b ; Analyzation of data
Wireshark
The time take was 75 ms.
c) The address of gaia.cs.umass.edu is 128.119.245.12
Task 1 b ; Analyzation of data
Paraphrase This Document
Need a fresh take? Get an instant paraphrase of this document with our AI Paraphraser

4
Wireshark
Analyzation of https://www.sbs.com.au/news/
Load distribution
It uses time period that loads every data of the requested website by the client as the focal point of
studying [1]. This depends on the network and internet performance duration that the content takes to
load. The diagram of load distribution is as shown below
The load distribution diagram here demonstrates the ideal execution of investigation with hundred
percent score card. From the above take a table at the heap circulation table the parcels sent are at a
rate of 40 counts for every a time of 0.000253 milliseconds which is very quick subsequently toll enough
for a generally decent site execution [2].

5
Wireshark
Throughput graph
Time succession chart of this site indicates precariousness conduct of bytes concerning time change. The
change anyway is customary shaping even interims in change of one and half units of bytes.
Wireshark
Throughput graph
Time succession chart of this site indicates precariousness conduct of bytes concerning time change. The
change anyway is customary shaping even interims in change of one and half units of bytes.
⊘ This is a preview!⊘
Do you want full access?
Subscribe today to unlock all pages.

Trusted by 1+ million students worldwide

6
Wireshark
Time sequence graph
This is graph the shows data sequence over or against time of any given website. The sequence numbers
in the graph can represent the bytes that are sent in the website. In the graph above the sequence
increases by one to any TCP data that is sent [3] .if graph could be drawn in the network then the slope
of the line could be theoretical bandwidth of the pipe. This graph shows that the steeper the line is then
the higher the throughput.
Paraphrase This Document
Need a fresh take? Get an instant paraphrase of this document with our AI Paraphraser

7
Wireshark
Flow graph
Not at all like other stream charts as you will see beneath, the length is exceptionally insignificant simply
indicating normal execution or rather most elevated execution in the entire examination. The graph
shows initiation of connection between the users and the serve [4 ]r. The time of transmission, frame
size and number of frames TCP ports that are used in the connection are all shown in the above
diagram. The packets that are also lost in the process of transmission can also be located using the flow
graph as shown above. The flow graph can also be saved as a text file.

8
Wireshark
Window scaling
Window scaling manages TCP window, which utilizes memory cushions. With information stacked in the
cradles the execution of the destinations has a tendency to back off subsequently the extent of the
recipient window and the speed are straightforwardly corresponding.
Wireshark
Window scaling
Window scaling manages TCP window, which utilizes memory cushions. With information stacked in the
cradles the execution of the destinations has a tendency to back off subsequently the extent of the
recipient window and the speed are straightforwardly corresponding.
⊘ This is a preview!⊘
Do you want full access?
Subscribe today to unlock all pages.

Trusted by 1+ million students worldwide

9
Wireshark
Analyzation of https://www.amazon.com.au
Load distribution
Load distribution appropriation centers around day and age of the stacking of each web asked for
content by the customer. Contingent upon the system and web execution the term which diverse
substance take to stack fluctuates. From the above take a gander at the heap circulation table the
parcels sent are at a rate of 0 for every a time of 0.000253 milliseconds which is very quick subsequently
toll enough for a generally decent site execution [4].
Paraphrase This Document
Need a fresh take? Get an instant paraphrase of this document with our AI Paraphraser

10
Wireshark
Throughput graph
This chart demonstrates the measure of throughput on the server amid each second of the heap test
situation run. Throughput is estimated in bytes or megabytes and speaks to the measure of information
that the users got from the server at some random second. To see throughput in megabytes, utilize.

11
Wireshark
Time sequence graph
This is diagram the shows information arrangement over or against time of some random site. The
succession numbers in the chart can speak to the bytes that are sent in the site. In the diagram over the
arrangement increments by one to any TCP information that is sent .if chart could be attracted the
system then the incline of the line could be hypothetical data transfer capacity of the pipe [5]. This
diagram demonstrates that the more extreme the line is then the higher the throughput. The graphs
shows that one factor increases and the other one remains constant. If then time increases then time
sequence remains constant as shown in the diagram above.
⊘ This is a preview!⊘
Do you want full access?
Subscribe today to unlock all pages.

Trusted by 1+ million students worldwide
1 out of 22
Related Documents

Your All-in-One AI-Powered Toolkit for Academic Success.
+13062052269
info@desklib.com
Available 24*7 on WhatsApp / Email
Unlock your academic potential
Copyright © 2020–2025 A2Z Services. All Rights Reserved. Developed and managed by ZUCOL.