BN208 Networked Applications: Network Analysis and Performance
VerifiedAdded on 2023/06/11
|15
|1267
|125
Report
AI Summary
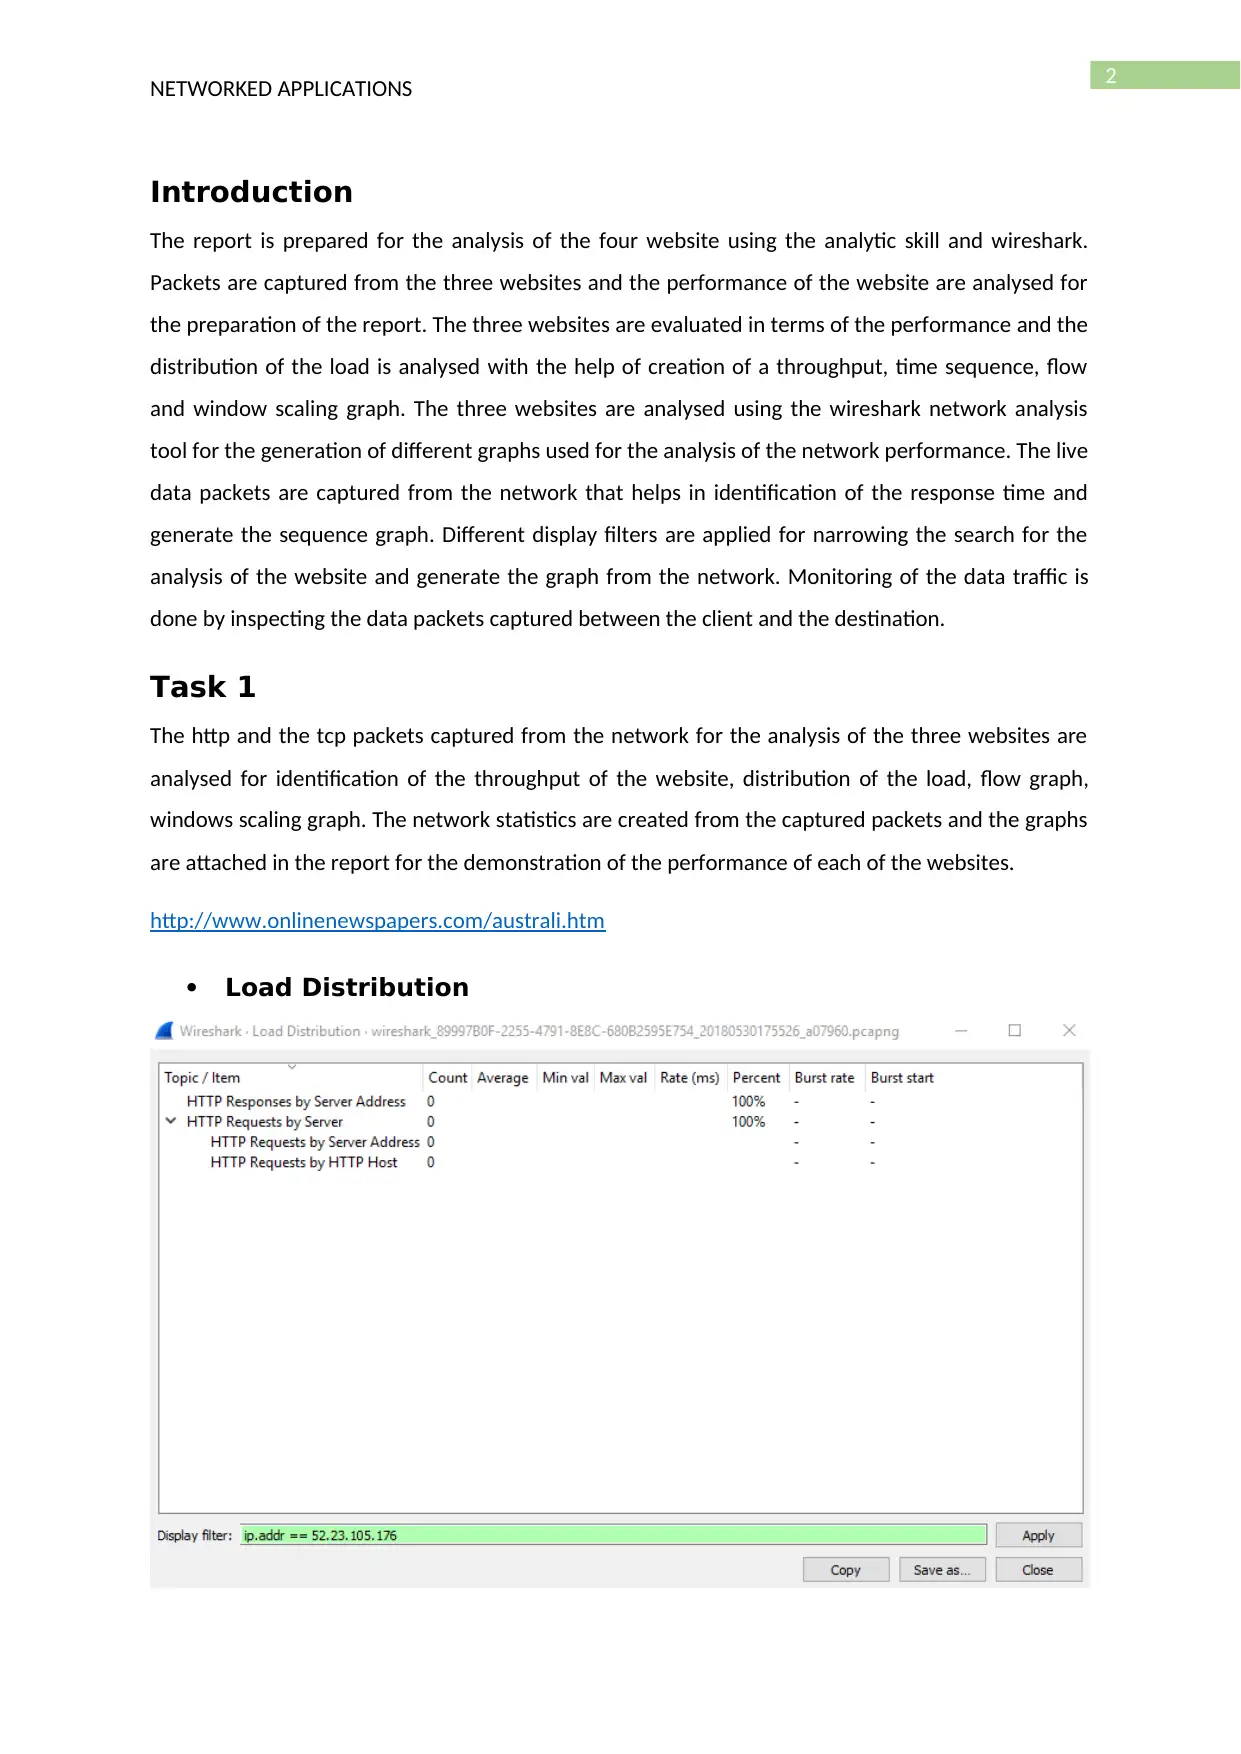
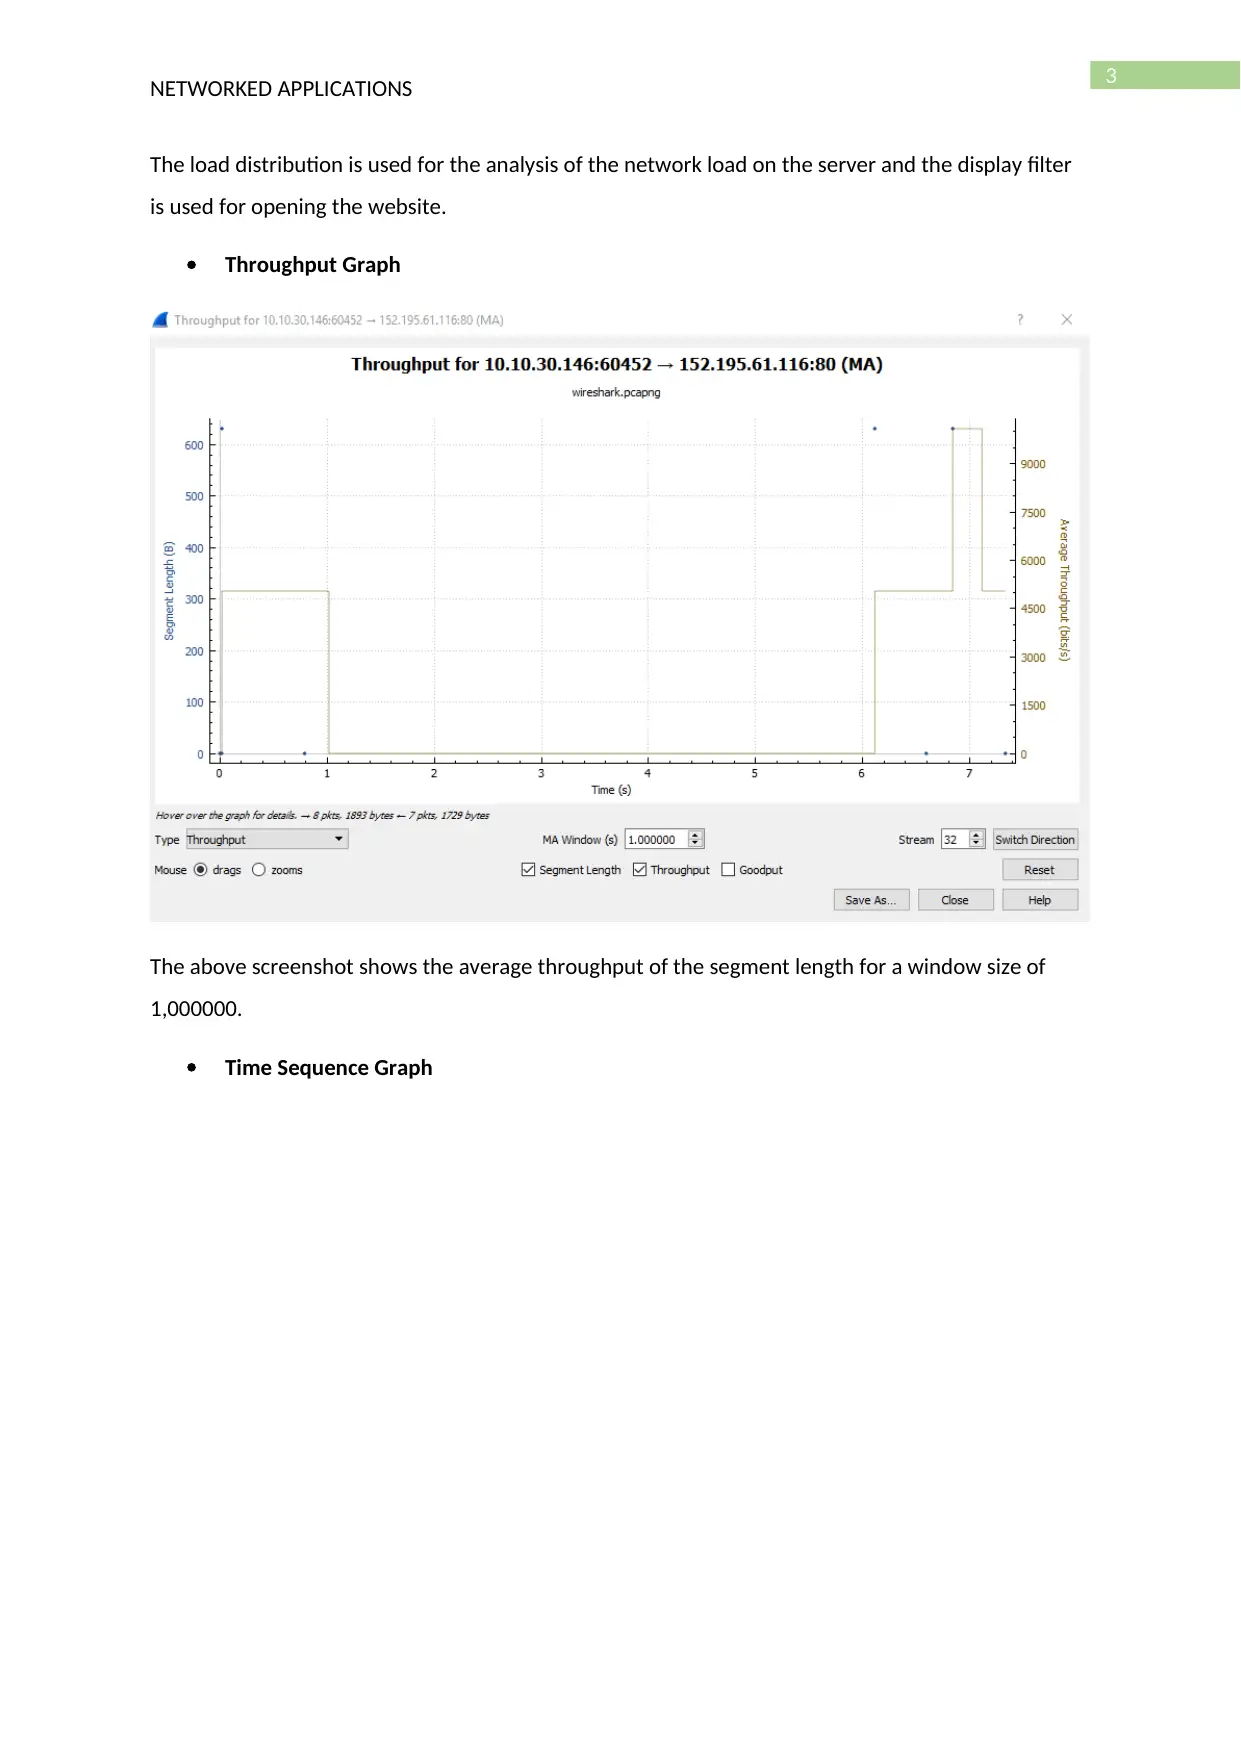
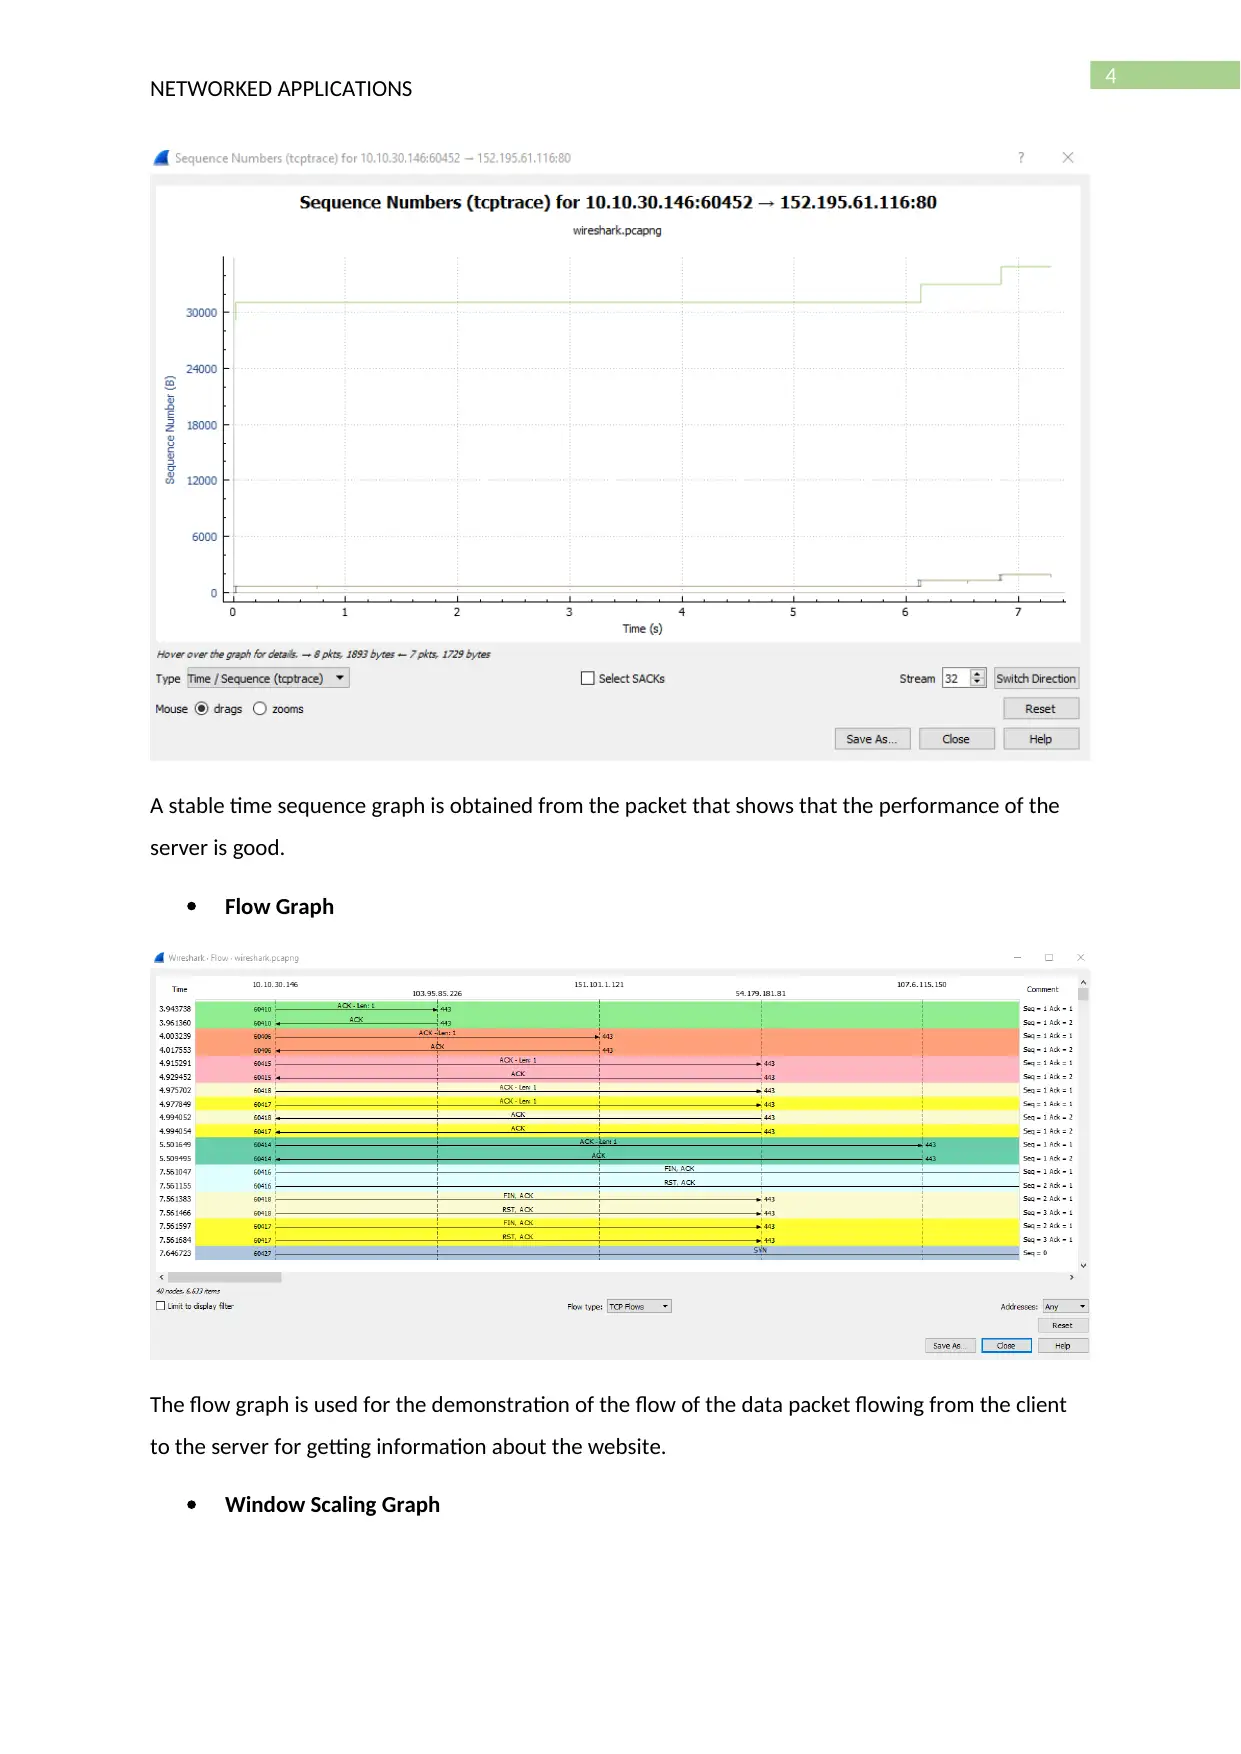
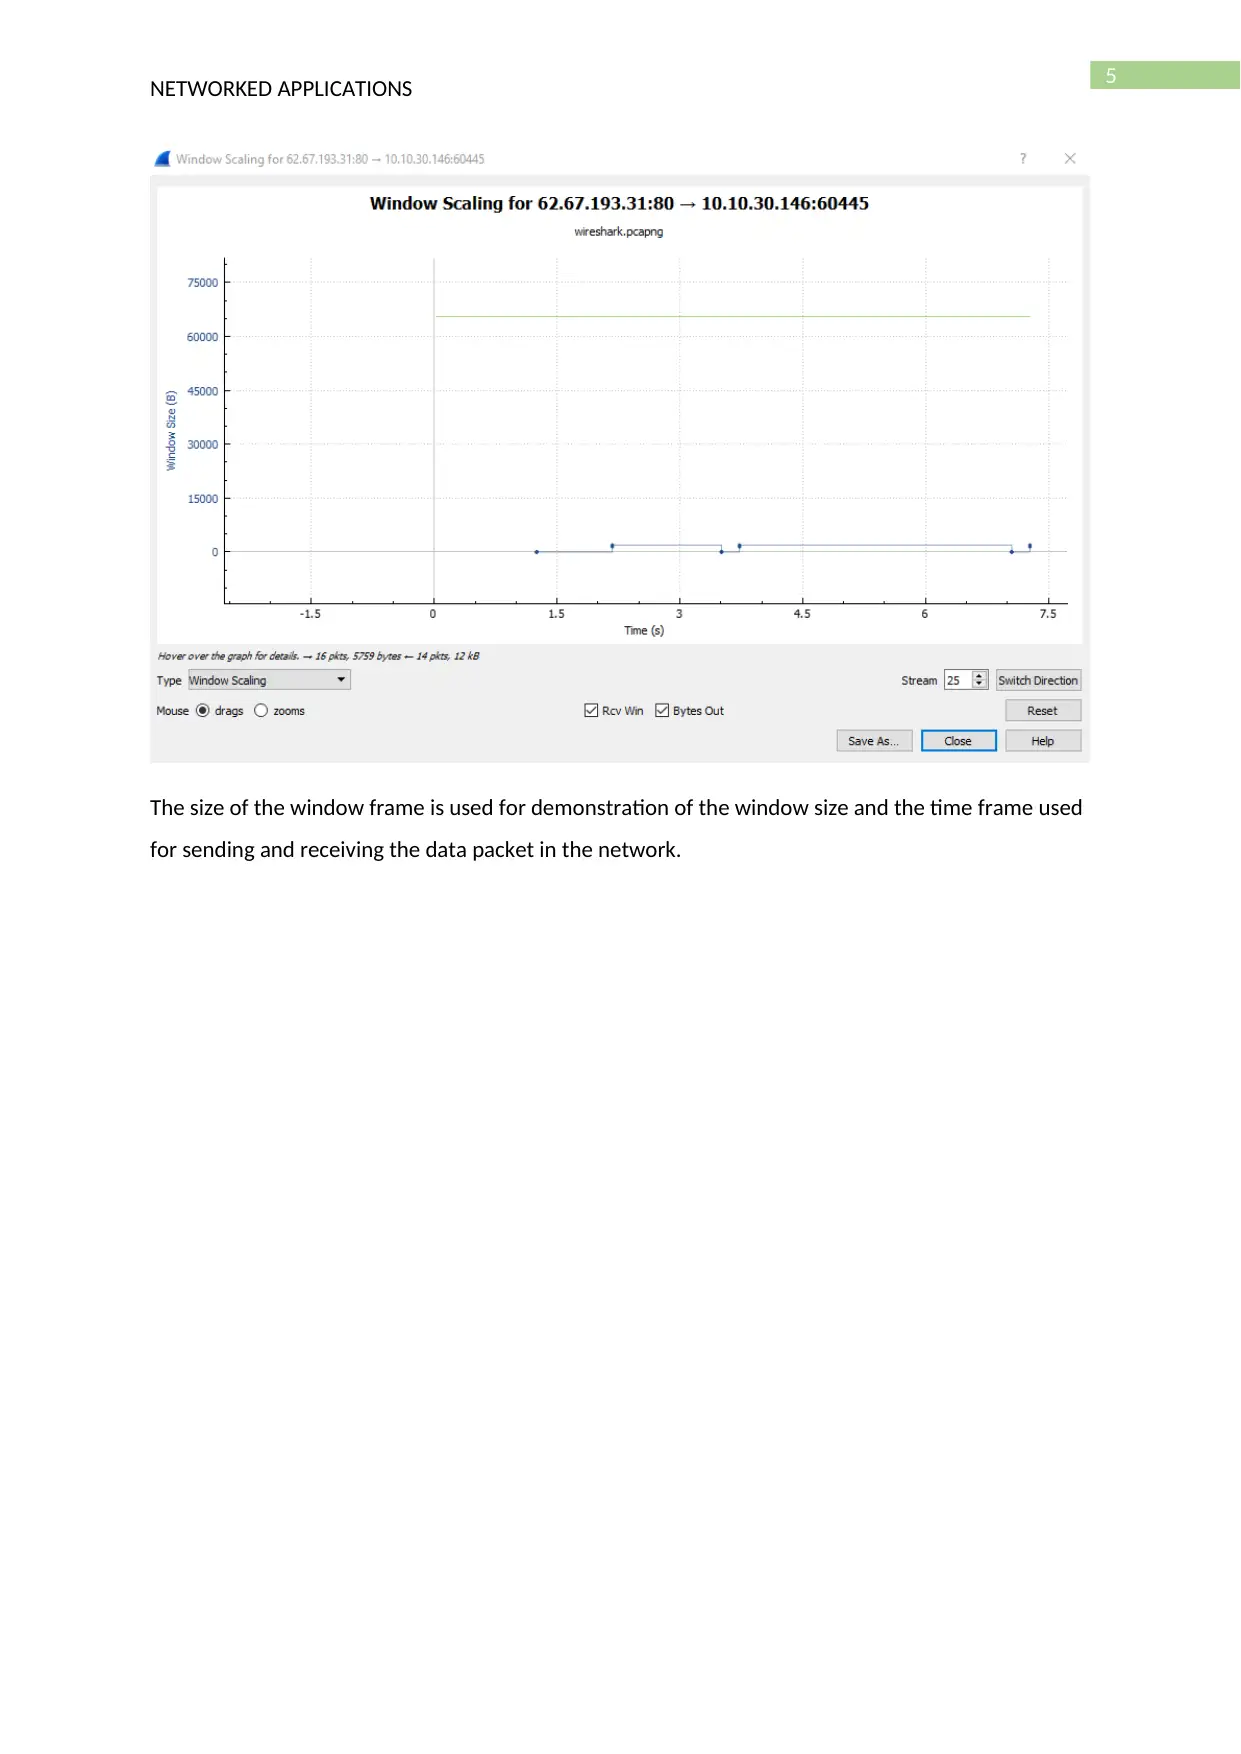
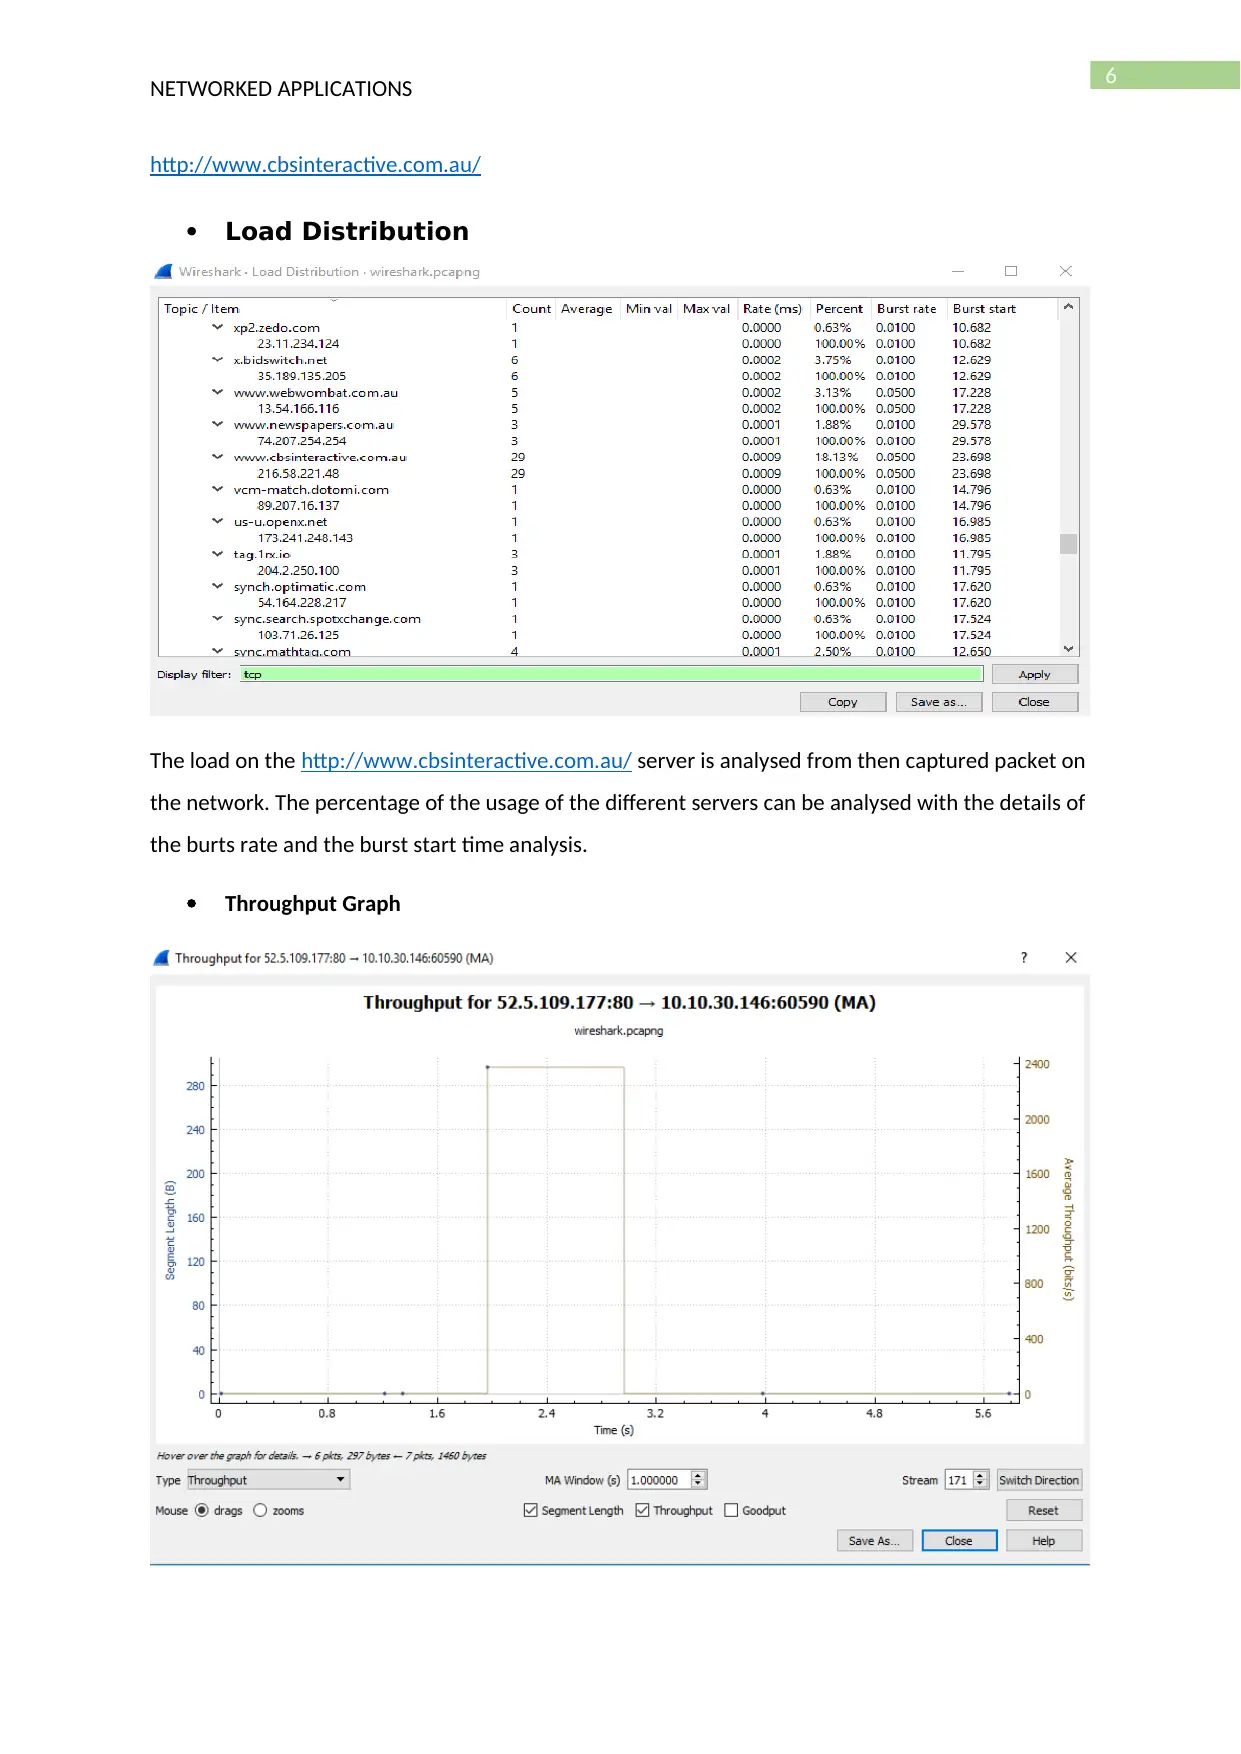
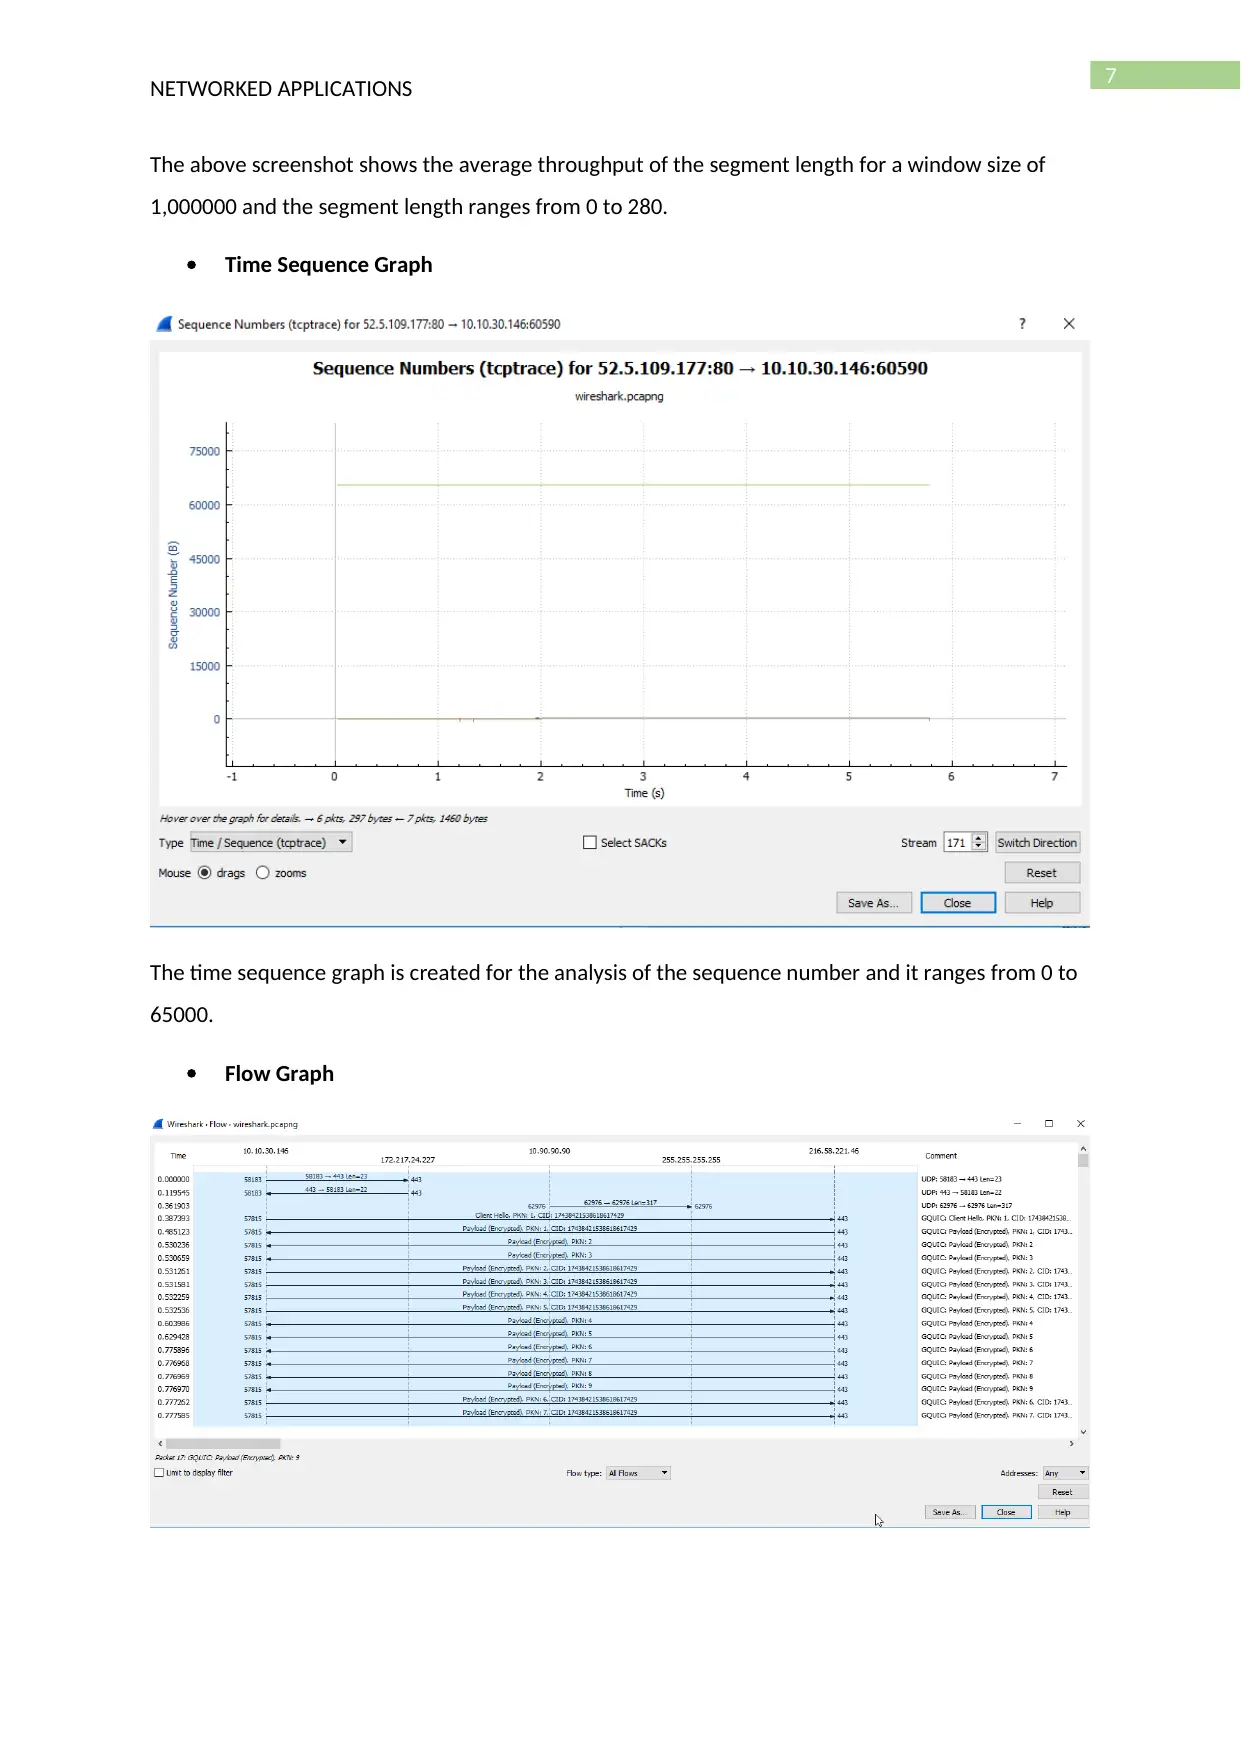
This report provides an analysis of network performance for three websites using Wireshark, focusing on HTTP and TCP packets. The analysis includes load distribution, throughput graphs, time sequence graphs, flow graphs, and window scaling graphs to evaluate website performance. The report details the methodology of capturing live data packets, applying display filters, and generating graphs for performance analysis. The study assesses the stability and performance of the websites in terms of handling user load and response times, concluding that Wireshark is an effective tool for network traffic analysis and website performance evaluation. The analysis helps in finding the IP address of the server hosted by the website and different information are gathered such as the window size, maximum size of the segment, windows scaling option and values.

Running head: NETWORKED APPLICATIONS
Analyse Network Performance
Name of the Student
Name of the University
Author’s Note
Analyse Network Performance
Name of the Student
Name of the University
Author’s Note
Paraphrase This Document
Need a fresh take? Get an instant paraphrase of this document with our AI Paraphraser

1
NETWORKED APPLICATIONS
Table of Contents
Introduction...........................................................................................................................................2
Task 1.....................................................................................................................................................2
Load Distribution.......................................................................................................................3
Load Distribution.......................................................................................................................6
Load Distribution.......................................................................................................................9
Throughput Graph.....................................................................................................................9
Task 2...................................................................................................................................................12
Throughput Graph...................................................................................................................12
Time Sequence Graph..............................................................................................................12
Conclusion...........................................................................................................................................13

2
NETWORKED APPLICATIONS
Introduction
The report is prepared for the analysis of the four website using the analytic skill and wireshark.
Packets are captured from the three websites and the performance of the website are analysed for
the preparation of the report. The three websites are evaluated in terms of the performance and the
distribution of the load is analysed with the help of creation of a throughput, time sequence, flow
and window scaling graph. The three websites are analysed using the wireshark network analysis
tool for the generation of different graphs used for the analysis of the network performance. The live
data packets are captured from the network that helps in identification of the response time and
generate the sequence graph. Different display filters are applied for narrowing the search for the
analysis of the website and generate the graph from the network. Monitoring of the data traffic is
done by inspecting the data packets captured between the client and the destination.
Task 1
The http and the tcp packets captured from the network for the analysis of the three websites are
analysed for identification of the throughput of the website, distribution of the load, flow graph,
windows scaling graph. The network statistics are created from the captured packets and the graphs
are attached in the report for the demonstration of the performance of each of the websites.
http://www.onlinenewspapers.com/australi.htm
Load Distribution
⊘ This is a preview!⊘
Do you want full access?
Subscribe today to unlock all pages.

Trusted by 1+ million students worldwide

3
NETWORKED APPLICATIONS
The load distribution is used for the analysis of the network load on the server and the display filter
is used for opening the website.
Throughput Graph
The above screenshot shows the average throughput of the segment length for a window size of
1,000000.
Time Sequence Graph
NETWORKED APPLICATIONS
The load distribution is used for the analysis of the network load on the server and the display filter
is used for opening the website.
Throughput Graph
The above screenshot shows the average throughput of the segment length for a window size of
1,000000.
Time Sequence Graph
Paraphrase This Document
Need a fresh take? Get an instant paraphrase of this document with our AI Paraphraser

4
NETWORKED APPLICATIONS
A stable time sequence graph is obtained from the packet that shows that the performance of the
server is good.
Flow Graph
The flow graph is used for the demonstration of the flow of the data packet flowing from the client
to the server for getting information about the website.
Window Scaling Graph

5
NETWORKED APPLICATIONS
The size of the window frame is used for demonstration of the window size and the time frame used
for sending and receiving the data packet in the network.
NETWORKED APPLICATIONS
The size of the window frame is used for demonstration of the window size and the time frame used
for sending and receiving the data packet in the network.
⊘ This is a preview!⊘
Do you want full access?
Subscribe today to unlock all pages.

Trusted by 1+ million students worldwide

6
NETWORKED APPLICATIONS
http://www.cbsinteractive.com.au/
Load Distribution
The load on the http://www.cbsinteractive.com.au/ server is analysed from then captured packet on
the network. The percentage of the usage of the different servers can be analysed with the details of
the burts rate and the burst start time analysis.
Throughput Graph
Paraphrase This Document
Need a fresh take? Get an instant paraphrase of this document with our AI Paraphraser

7
NETWORKED APPLICATIONS
The above screenshot shows the average throughput of the segment length for a window size of
1,000000 and the segment length ranges from 0 to 280.
Time Sequence Graph
The time sequence graph is created for the analysis of the sequence number and it ranges from 0 to
65000.
Flow Graph

8
NETWORKED APPLICATIONS
The flow of the data traffic and the information is analysed for the development of the network
analysis report for the website http://www.cbsinteractive.com.au/.
Window Scaling Graph
The size of the window frame is used for demonstration of the window size and the time frame used
for sending and receiving the data packet in the network.
http://www.newspapers.com.au/
⊘ This is a preview!⊘
Do you want full access?
Subscribe today to unlock all pages.

Trusted by 1+ million students worldwide

9
NETWORKED APPLICATIONS
Load Distribution
The load distribution of the http://www.newspapers.com.au/ server is analysed form the packet
captured form the network interface.
Throughput Graph
NETWORKED APPLICATIONS
Load Distribution
The load distribution of the http://www.newspapers.com.au/ server is analysed form the packet
captured form the network interface.
Throughput Graph
Paraphrase This Document
Need a fresh take? Get an instant paraphrase of this document with our AI Paraphraser

10
NETWORKED APPLICATIONS
The through put graph is created for the analysis of the through put of the
http://www.newspapers.com.au/ server. The length of the segment ranges from 0 to 5000 and it is
used as the average throughput.
Time Sequence Graph
The time sequence graph is created from the wireshark and from the analysis it is found that the
connection is stable and linear graph is obtained from the analysis.
Flow Graph

11
NETWORKED APPLICATIONS
The flow graph is created for the analysis of the flow of the data traffic in the network for connecting
with the http://www.newspapers.com.au/ server.
Window Scaling Graph
The windows scaling graph is created for the analysis of the window size for the
http://www.newspapers.com.au/ and it ranges from 0 to 30000.
⊘ This is a preview!⊘
Do you want full access?
Subscribe today to unlock all pages.

Trusted by 1+ million students worldwide
1 out of 15
Related Documents

Your All-in-One AI-Powered Toolkit for Academic Success.
+13062052269
info@desklib.com
Available 24*7 on WhatsApp / Email
Unlock your academic potential
Copyright © 2020–2025 A2Z Services. All Rights Reserved. Developed and managed by ZUCOL.