Research Proposal: Board Responsibility and Carbon Emission Reduction

Verified

Added on  2023/06/06

|16
|3387
|440
Project
AI Summary
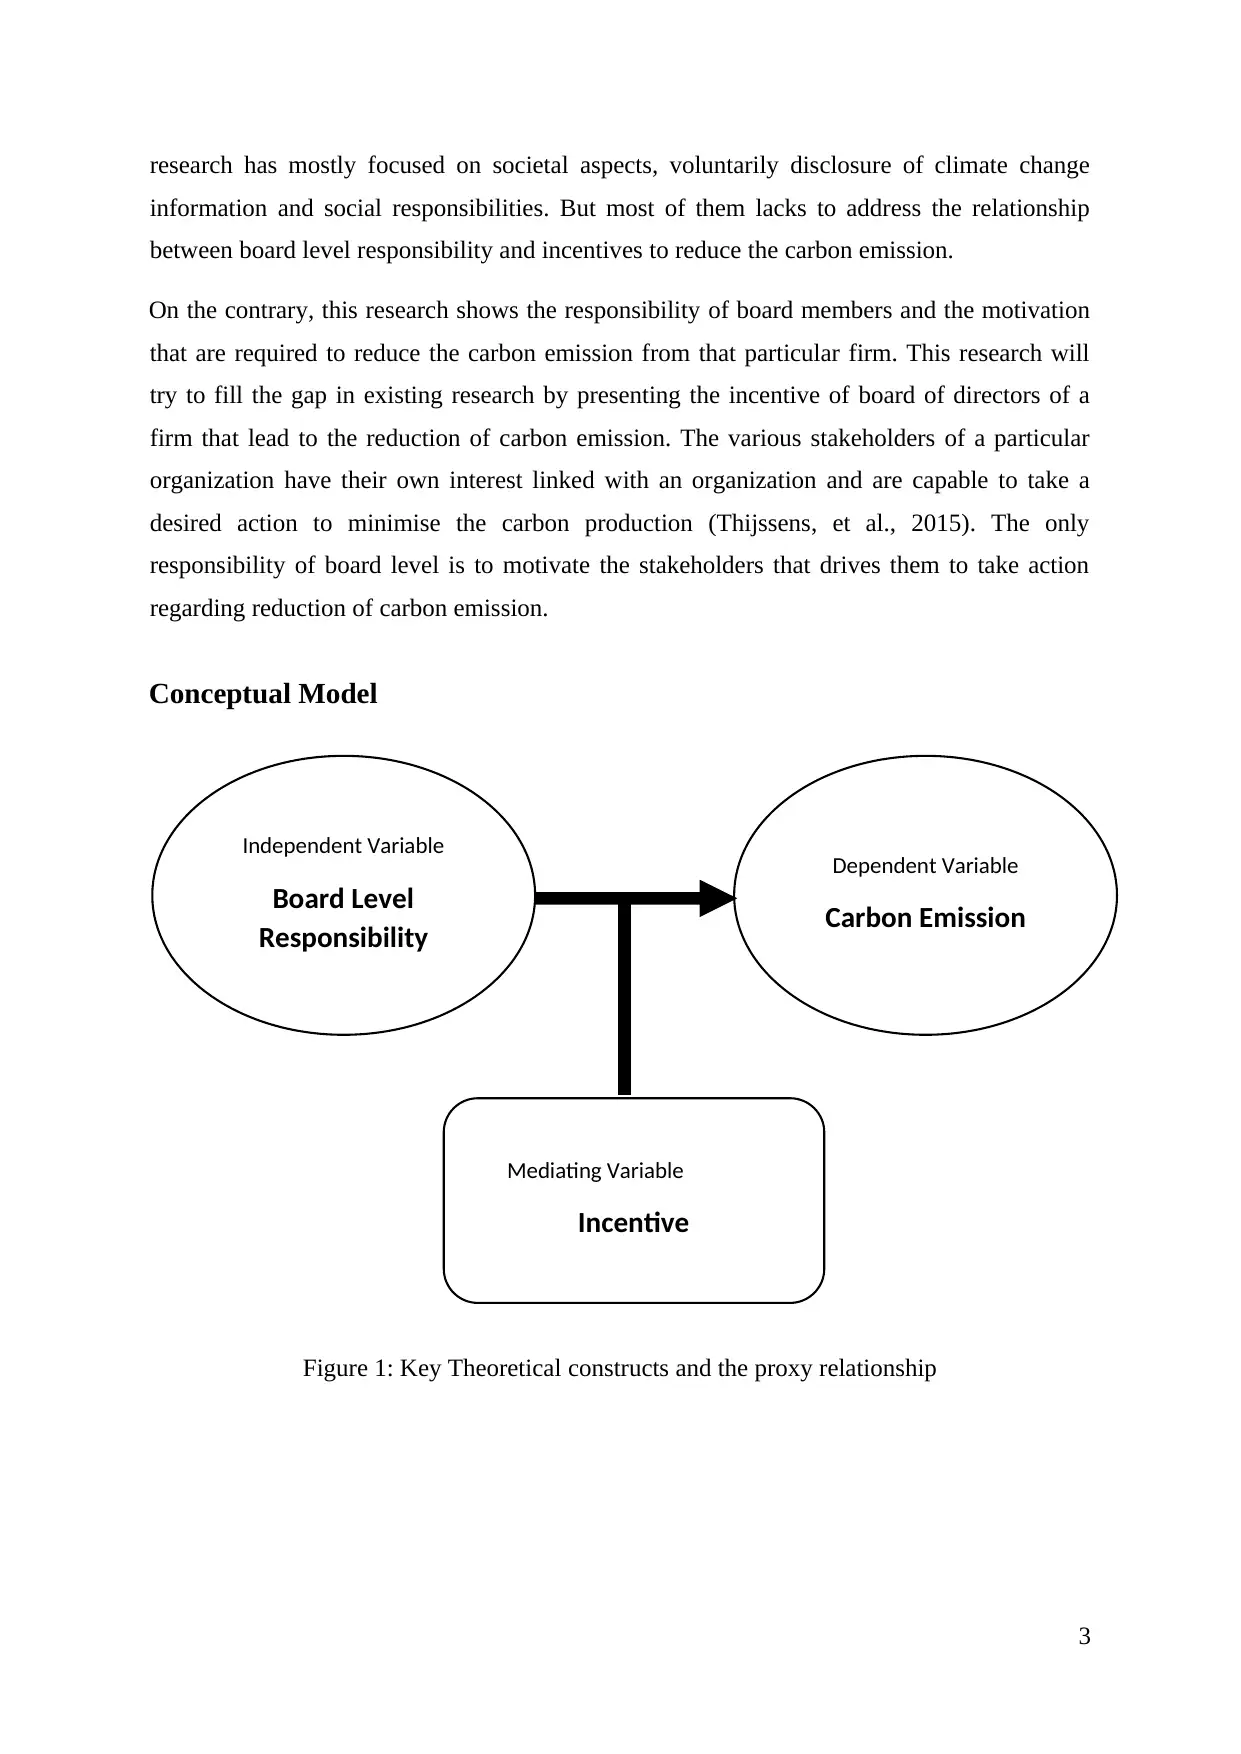
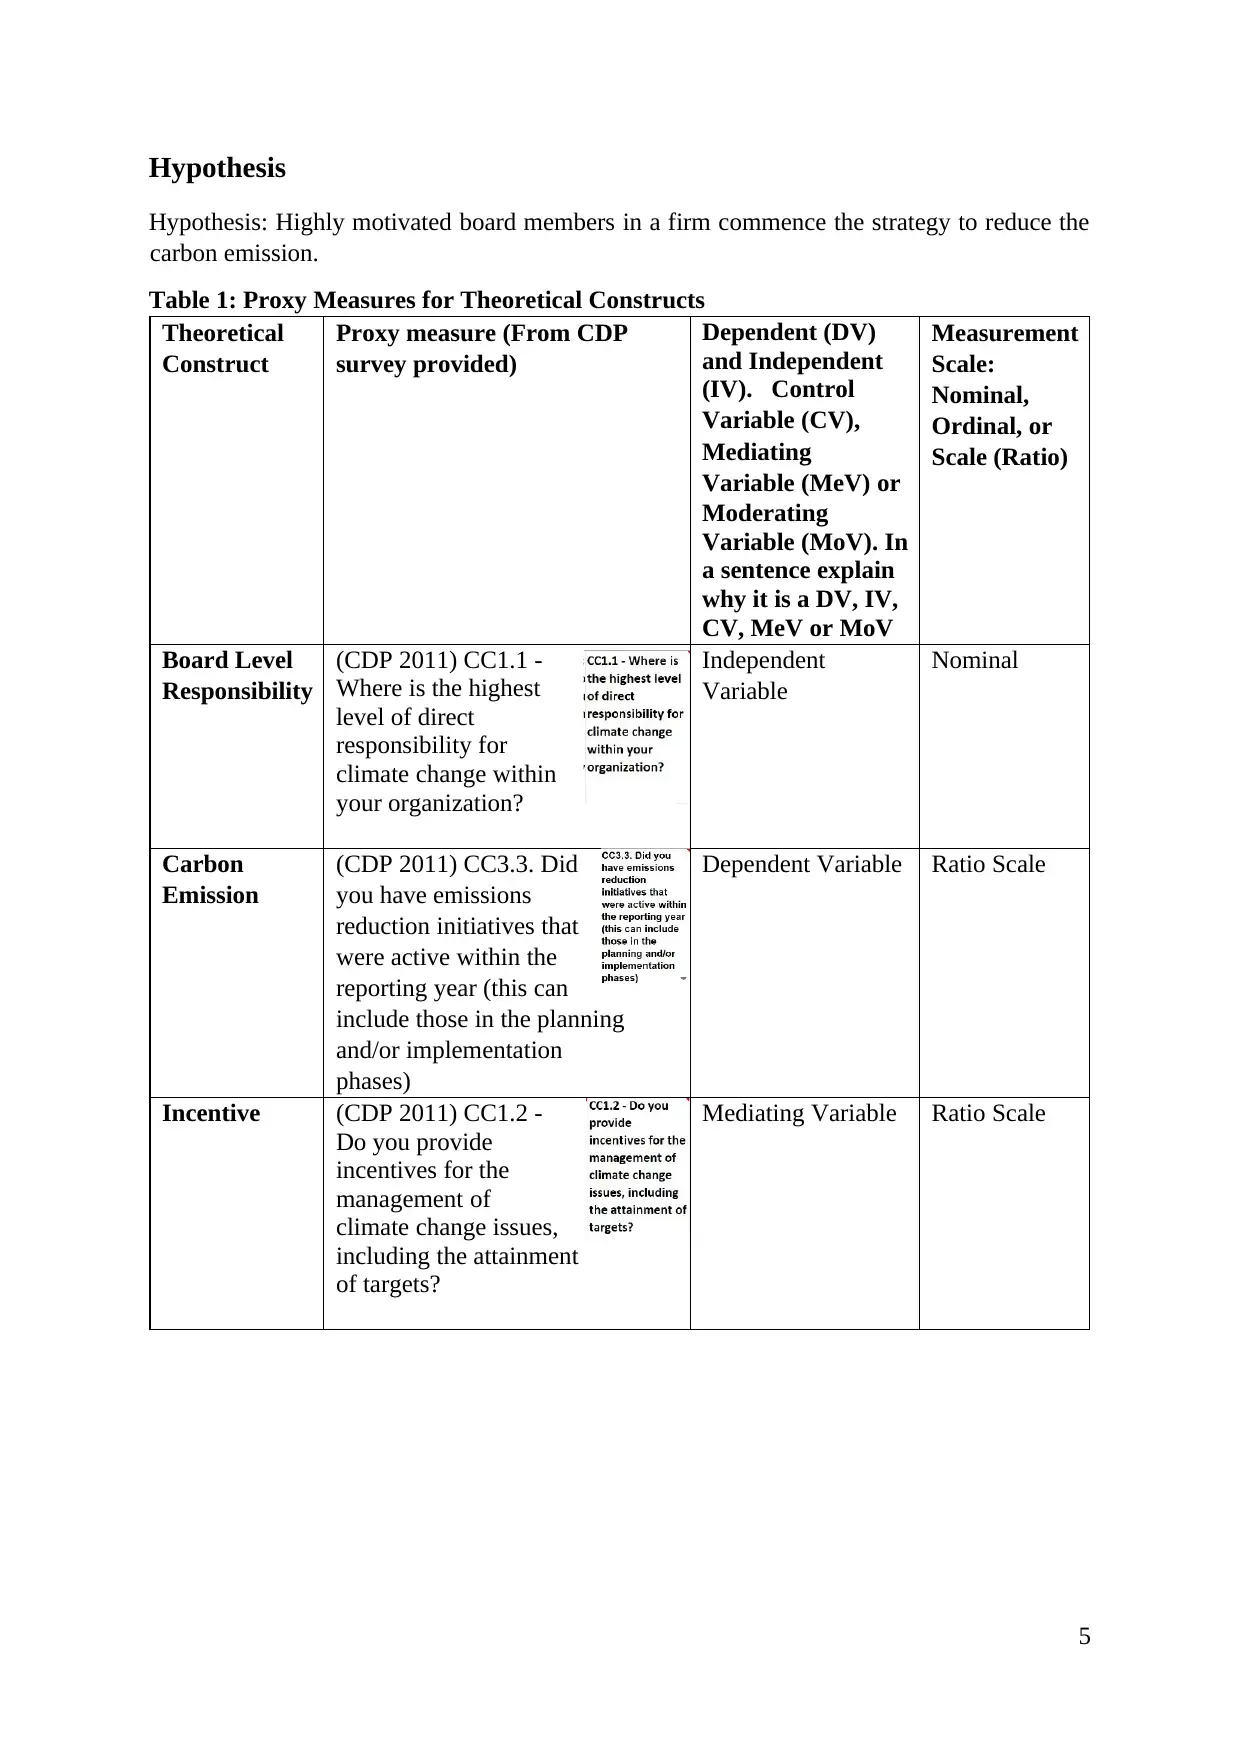
This research proposal investigates the relationship between board-level responsibility for climate change and carbon emission reduction, grounded in stakeholder theory. The study aims to determine if board-level accountability leads to reduced carbon emissions, exploring the mediating role of incentives. The literature review highlights the growing importance of environmental governance and the stakeholder theory's relevance in aligning business practices with societal values. The practical motivation stems from stakeholder pressure for improved organizational environmental performance. The research employs a quantitative approach, utilizing data from the Carbon Disclosure Project (CDP) survey, with a sample of 202 companies across various industries. The research employs descriptive statistics to analyze the data. Findings indicate a strong emphasis on emission reduction initiatives and the importance of incentives. The research concludes with an analysis of the independent, dependent, and mediating variables, including board level responsibility, carbon emission, and incentives respectively. The methodology involves the use of proxy measures from CDP, with nominal and ratio scales, to assess the relationship between the variables, and the data analysis reveals the distribution across industries and the level of responsibility within organizations.
Document Page
MGT723 Research Project
Assessment Task 1: Research Proposal
Student Name:
Student Id:
Your assigned research topic*: Stakeholder theory
Research Question: Does board level responsibility for climate change lead
to reduce carbon emission?
Title: Board level responsibility for climate change lead to reduction in
carbon emission.
Submission Date:
Acknowledgement:
I certify that I have carefully reviewed the university’s academic misconduct
policy. I understand that the source of ideas must be referenced and that
quotation marks and a reference are required when directly quoting anyone
else’s words.
1
tabler-icon-diamond-filled.svg

Paraphrase This Document

Need a fresh take? Get an instant paraphrase of this document with our AI Paraphraser
Document Page
Literature Review
Due to immense effect on environment nowadays it’s necessary to enhance the new
governance so that it will bring positive impact on reducing carbon. Thus, Carbon emission is
becoming the major threats recently and many stakeholders have been requesting for
incentives to the board members that may lead to the reduction of carbon emission (Ben-
Amar & Mcllkenny 2014). According to the stakeholder theory, to do a business, the shared
values between the society and business firms are crucial (Fontaine, Haarman & Schmid
2016). Additionally, since stakeholder theory is concerned with the accountability of
organisation, in a stakeholder perspective, an organisation should be able to fulfil the
expectation of all the stakeholder groups (Fernando & Steward 2014). Firms are producing
millions of carbons each day and with good board level strategy and incentives, issues in
environment can be managed.
The research here presents the detail insight on how the business strategy of disclosing the
climate change and carbon emission information helps in reducing the emission of carbon.
Practical Motivation
The issues regarding organizational environmental performance is motivating the
stakeholders to address those issues. Since, the organization are highly responsible for greater
emission of carbon, board level responsibility of an organization plays a crucial role in taking
set of actions to reduce the carbon emission. Thus, a set of target needs to be set by the
organization and to achieve those targets, stakeholders need to exercise a control mechanism,
pressures or agreements (Pinkse & Kolk 2010). The needs to address carbon emission issue is
growing and thus reduction of carbon pollutants from the organization is linked with
corporate social responsibility approach.
Theoretical Motivation
There are many previous researches done on measures to preserve the environment. One of
the research that is most often carried out in context of preserving the environment is how to
reduce the carbon emission from a firm. Regarding same, Ben-Amar & Mcllkenny (2014)
had carried out the research on relationship of board of director’s effectiveness and voluntary
climate change disclosure. Carbon Disclosure Project CDP) is the basis for that particular
research where, the information regarding the production of carbon by a firm are revealed and
the strategies to mitigate the risks developed by it are discussed. Furthermore, previous
2
Document Page
research has mostly focused on societal aspects, voluntarily disclosure of climate change
information and social responsibilities. But most of them lacks to address the relationship
between board level responsibility and incentives to reduce the carbon emission.
On the contrary, this research shows the responsibility of board members and the motivation
that are required to reduce the carbon emission from that particular firm. This research will
try to fill the gap in existing research by presenting the incentive of board of directors of a
firm that lead to the reduction of carbon emission. The various stakeholders of a particular
organization have their own interest linked with an organization and are capable to take a
desired action to minimise the carbon production (Thijssens, et al., 2015). The only
responsibility of board level is to motivate the stakeholders that drives them to take action
regarding reduction of carbon emission.
Conceptual Model
Figure 1: Key Theoretical constructs and the proxy relationship
3
Independent Variable
Board Level
Responsibility
Dependent Variable
Carbon Emission
Mediating Variable
Incentive
Document Page
Independent Variable: Board Level Responsibility
One of the key responsibilities of the board of organisation is to manage its stakeholders
effectively in order to achieve the goals (Fernando & Steward 2014). Regarding the reduction
of carbon emission, a board level management can implement the strategy to control the
emission of carbon by simply disclosing the carbon emission information. On the basis of that
particular disclosed information, stakeholders of different interest can contribute to minimise
the carbon emission. For example, a director of an organisation can formulate the plan to use
the resources that produces the less amount of carbon. Susith, Fernando & Stewart,
Lawrence 2014.
Dependent Variable: Carbon Emission
Since carbon emission is main contributor to climate change issues including global warming,
identifying the driving forces which affect carbon emission is becoming the trending topic for
many researchers (Guo & Jiang 2011). One of the key reasons for greater amount of carbon
emission is rapid economic growth which led to increase in demand for energy (Guo & Jiang
2011).
Here, carbon emission is taken as dependent variable as board level responsibility and
incentives from different stakeholders is a resulting factor for an amount of carbon emitted by
that organisation.
Mediating Variable: Incentives
Incentives of an organization is considered as the mediating variable, since it explains the
relationship between the board level responsibility (independent variable) and carbon
emission (dependent variable). In a particular organisation, incentives given to stakeholders
by board level might result in control of carbon emission.
4
tabler-icon-diamond-filled.svg

Paraphrase This Document

Need a fresh take? Get an instant paraphrase of this document with our AI Paraphraser
Document Page
Hypothesis
Hypothesis: Highly motivated board members in a firm commence the strategy to reduce the
carbon emission.
Table 1: Proxy Measures for Theoretical Constructs
Theoretical
Construct
Proxy measure (From CDP
survey provided)
Dependent (DV)
and Independent
(IV). Control
Variable (CV),
Mediating
Variable (MeV) or
Moderating
Variable (MoV). In
a sentence explain
why it is a DV, IV,
CV, MeV or MoV
Measurement
Scale:
Nominal,
Ordinal, or
Scale (Ratio)
Board Level
Responsibility
(CDP 2011) CC1.1 -
Where is the highest
level of direct
responsibility for
climate change within
your organization?
Independent
Variable
Nominal
Carbon
Emission
(CDP 2011) CC3.3. Did
you have emissions
reduction initiatives that
were active within the
reporting year (this can
include those in the planning
and/or implementation
phases)
Dependent Variable Ratio Scale
Incentive (CDP 2011) CC1.2 -
Do you provide
incentives for the
management of
climate change issues,
including the attainment
of targets?
Mediating Variable Ratio Scale
5
Document Page
Research Method/Data Collection
The sample in this research is madeup of companies covered in the Carbon Disclosure Project
(CDP) survey. CDP facilitates the analysis of different companies based on the carbon
emissions data. A big dataset is built to provide transparency, robust methods and value to
investors (cdp, n.d.). This research chose the data from the year 2011 as its sample data.
All the sample companies in this research reported a plan or implementation of carbon
emission reduction strategy during the reporting year. A sample of 202 companies in various
industries such as manufacturing, banking, transport, and retail was used. The data provided
is broad covering industries across the world and is therefore generalizable and replicable
since data is provided for other years as well.
Three survey questions acted as proxy measure in our research and are listed below. This
survey questions represented the variables of the study. The independent variable (IV) was
represented by CC1.1, the dependent variable (DV) was represented by CC3.3, and the
mediating variable (MV) was represented by CC1.2 and was coded as follows:
CC1.1 column answers the question: Where is the highest level of direct responsibility for
climate change within your organization? The answers for this question are coded in
numbers, where 3 represents the highest direct responsibility, 1 represents lowest and 2
represents average.
CC3.3 column answers the question: Did you have emissions reduction initiatives that were
active within the reporting year (this can include those in the planning and/or implementation
phases). For this question, if answer is 1, then company is active with emissions reduction
initiatives. Whereas, the company is not active with emissions reduction initiatives if answer
is 2.
6
Document Page
CC1.2 column answers the following question: Do you provide incentives for the
management of climate change issues, including the attainment of targets? The codes for this
question, if answer is 1, then the company provides incentives for the management of climate
change issues. Whereas, if answer is 2, then the company doesn’t provide incentives.
The research checked for missing data and anomalies but none was found. The data set was
complete and free of corrupt data. Columns of variables that are not of initerest to the study
were deleted leaving only those columns of CC1.2, CC1.1, and CC3.3. The file was therefore
openned in SPSS for analysis. But before the analysis, the data was chcked to ensure tha they
were given the crecty measure level (nominal, ordinal, scale).
Data analysis- Descriptive
There were 202 company samples. Out these, 101 (50%) companies are from the USA, 13
(6.4%) are from Canada, Sweden 8 (4%), UK 7 (3.5%), and other countries followed in that
order as illustrated by the pie chat in figure 1 below.
Figure 2: Sample countries
7
tabler-icon-diamond-filled.svg

Paraphrase This Document

Need a fresh take? Get an instant paraphrase of this document with our AI Paraphraser
Document Page
In the sample, 38 industries are sampled. Among them the banking and financial industry
covered the highest percentage at 15.2%, followed closely by the technology hardware and
equipment industry at 11.4%. Retailing, Oil and Gas, and food and beverage processing take
the third highest frequency (5%). The least sectors only took 0.5% and include among them
tobacco, specialized consumer services, professional services, homebuilding, construction
materials, containers and packaging as well as ground transportation.
Figure 3: Industries represented in the sample
8
Document Page
Table 2: Descriptive Statistics for all the variables CC1.1, CC1.2, and CC3.3
Descriptive Statistics
CC1.1 -
Where is the
highest level
of direct
responsibility
for climate
change
within your
organization?
CC1.2 - Do
you provide
incentives for
the
management
of climate
change
issues,
including the
attainment of
targets?
CC3.3. Did
you have
emissions
reduction
initiatives
that were
active within
the reporting
year (this can
include those
in the
planning
and/or
implementati
on phases)
N Valid 202 202 202
Missing 0 0 0
Mean 1.82 1.45 1.05
Median 2.00 1.00 1.00
Mode 2 1 1
Std. Deviation .413 .498 .227
Variance .170 .248 .052
Skewness -1.213 .221 3.956
Std. Error of
Skewness
.171 .171 .171
Kurtosis .750 -1.971 13.790
Std. Error of Kurtosis .341 .341 .341
Range 2 1 1
Maximum 3 2 2
Independent Variable
Table 3: Independent variable
CC1.1 - Where is the highest level of direct responsibility for
climate change within your organization?
Frequency Percent
Valid
Percent
Cumulative
Percent
Valid Lowest 39 19.3 19.3 19.3
Average 161 79.7 79.7 99.0
Highest 2 1.0 1.0 100.0
Total 202 100.0 100.0
9
Document Page
Figure 4: Independent Variable
In table 2 and figure 3, 202 companies are represented and all are valid. Code 1 represents the
lowest level of direct responsibility, 2 indicates average direct responsibility, and 3 represents
the highest level of responsibility for climate change within the organization. 161 (79.7%)
companies replied with 2, 39 (19.3%) replied with 1, and only 2 (1%) replied with 3. The
mean of the response is 1.82, a standard deviation of 0.413, and it is negatively skewed -
1.213 and positive kurtois of 0.750.
Dependent Variable
Table 4: dependent variable
CC3.3. Did you have emissions reduction initiatives that were
active within the reporting year (this can include those in the
planning and/or implementation phases)
Frequency Percent
Valid
Percent
Cumulative
Percent
Valid yes 191 94.6 94.6 94.6
no 11 5.4 5.4 100.0
Total 202 100.0 100.0
10
tabler-icon-diamond-filled.svg

Paraphrase This Document

Need a fresh take? Get an instant paraphrase of this document with our AI Paraphraser
Document Page
Figure 5: CC3.3 Dependent variable
In the figure 4, it is observed that 202 companies responded with either 1 for Yes or 2 for No.
There was no invalid data. 191 (94.6%) companies indicated that they have emission
reduction initiatives that were active within the reporting year (including those in the
planning and implementation phases. Only 11 (5.4%) replied with a NO for this variable. The
mean of the response was 1.05 and the standard deviation is 0.227. The response has a
positive skewness 3.956 and a positive kurtosis 13.790.
Mediating Variable
Table 5: mitigating variable
CC1.2 - Do you provide incentives for the management of climate
change issues, including the attainment of targets?
Frequency Percent
Valid
Percent
Cumulative
Percent
Valid yes 112 55.4 55.4 55.4
no 90 44.6 44.6 100.0
Total 202 100.0 100.0
11
Document Page
Figure 5\6: mitigating variable
From the figure 5, 112 (55.4%) agree that the board of directors provides incentives for the
management of climate change issues, including the attainment of targets. The other 90
(44.6%) indicated that there were not incentives given. The mean of the response was 1.45
with a standard deviation of 0.498. The response also had a positive skewness 0.221 with a
negative kurtois -1.971.
Table 6: Statistics between direct responsibility and carbon emission
Case Processing Summary
CC1.1 - Where is the
highest level of direct
responsibility for climate
change within your
organization?
Cases
Valid Missing Total
N Percent N Percent N Percent
CC3.3. Did you have
emissions reduction
initiatives that were
active within the
reporting year (this can
include those in the
planning and/or
implementation phases)
Lowest 39 100.0% 0 0.0% 39 100.0%
Average 161 100.0% 0 0.0% 161 100.0%
Highest 2 100.0% 0 0.0% 2 100.0%
12
chevron_up_icon
1 out of 16
circle_padding
hide_on_mobile
zoom_out_icon
[object Object]