Consumer Behavior Analysis of Bunbury Boat Show Attendees: Report
VerifiedAdded on 2023/06/04
|18
|2995
|230
Report
AI Summary
This report analyzes consumer behavior and attitudes towards the Bunbury Boat Show, based on a survey of 244 attendees. The research investigates demographics, attitudes towards water-based activities, online behavior, and purchasing habits. Key findings reveal that the majority of attendees are male, and the primary barriers to participation in boating are lack of time and costs. The show is generally considered good value for money and informative, with a strong positive correlation between the two. Attendees enjoy the show for the opportunity to handle products, get advice, ask questions, talk to dealers, compare products, and find information about new products. The report concludes with recommendations to increase future attendance, emphasizing the value and informative nature of the show.
3/11/2018
Consumer Behavior with regards to the Bunbury Boat Show
Consumer Behavior with regards to the Bunbury Boat Show
Paraphrase This Document
Need a fresh take? Get an instant paraphrase of this document with our AI Paraphraser
Table of Contents
Introduction.................................................................................................................................................1
Research methodology................................................................................................................................2
Data collection and analysis....................................................................................................................2
Demographic description........................................................................................................................2
Results.........................................................................................................................................................4
Conclusion.................................................................................................................................................15
Recommendations.....................................................................................................................................15
Introduction
The recreational marine industry has widely been considered an alternative form of relaxation
and activity (Watson, 2008). A range of activities are being carried out in the marine industry
some of which are fishing and boating activities (Siân E. Rees, 2010).
However, significant changes have been experienced in the marine industry more so over the
past ten years resulting to a decline in the industry’s customer base (Beyers, 2008). Many factors
are thought to be attributed to this decline including an increased demand on leisure time, the
economic downturn and the rise of online entertainment especially among the youth (Prothe,
1993).
The research detailed in this report was therefore conducted to investigate the Bunbury Boat
Show attendees’ attitudes and consumer behavior with regards to the Bunbury Boat show in
order to find out how to increase the number of attendees to the Bunbury Boat Show in the
future.
The research statement for this study was to investigate the attitudes, consumer behavior and
online activity of current visitors to the Bunbury Boat Show.
The objectives for this research are as below;
i. Build a demographic profile of participants attending the Bunbury Boat Show.
ii. Investigate Bunbury Boat Show attendees attitudes and consumer behavior to water-
based
Activities.
iii. Investigate Bunbury Boat Show attendees’ attitudes and consumer behavior with regards
to the Bunbury Boat Show.
1
⊘ This is a preview!⊘
Do you want full access?
Subscribe today to unlock all pages.
Trusted by 1+ million students worldwide
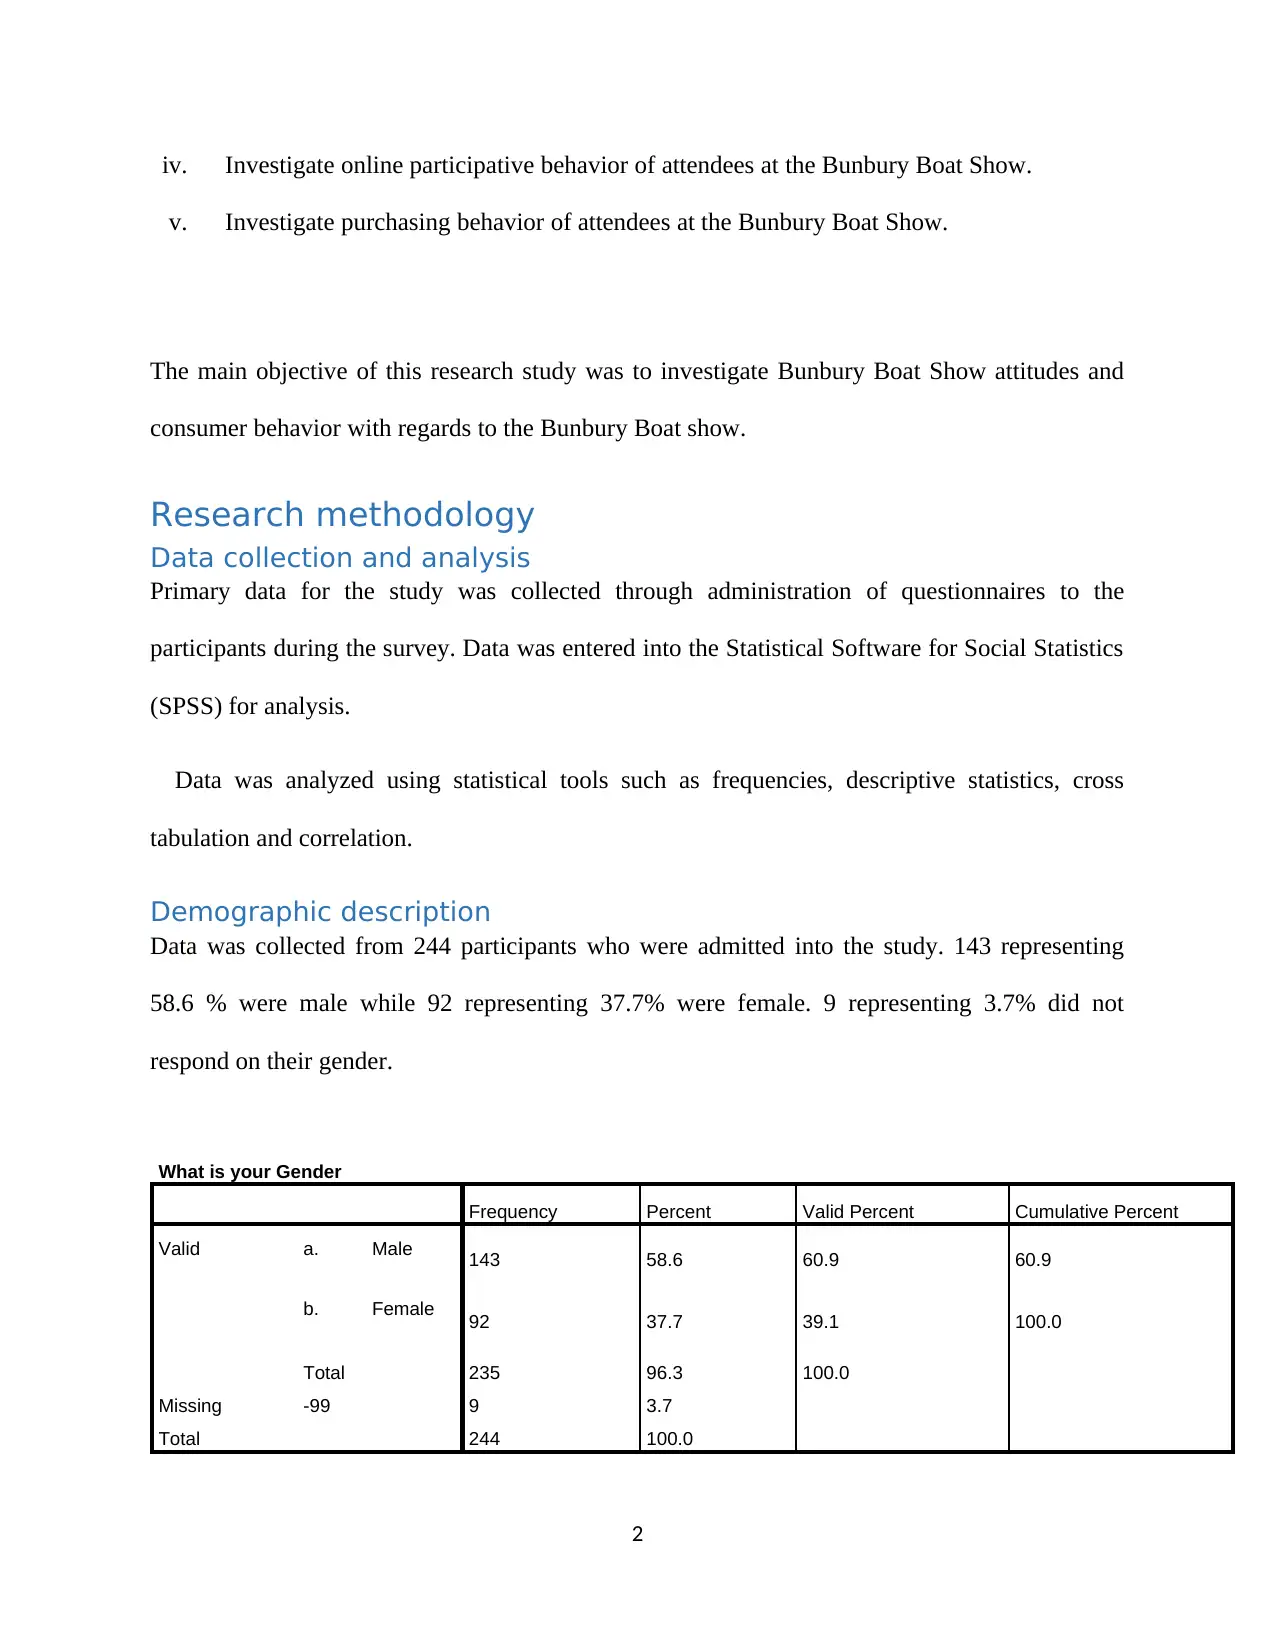
iv. Investigate online participative behavior of attendees at the Bunbury Boat Show.
v. Investigate purchasing behavior of attendees at the Bunbury Boat Show.
The main objective of this research study was to investigate Bunbury Boat Show attitudes and
consumer behavior with regards to the Bunbury Boat show.
Research methodology
Data collection and analysis
Primary data for the study was collected through administration of questionnaires to the
participants during the survey. Data was entered into the Statistical Software for Social Statistics
(SPSS) for analysis.
Data was analyzed using statistical tools such as frequencies, descriptive statistics, cross
tabulation and correlation.
Demographic description
Data was collected from 244 participants who were admitted into the study. 143 representing
58.6 % were male while 92 representing 37.7% were female. 9 representing 3.7% did not
respond on their gender.
What is your Gender
Frequency Percent Valid Percent Cumulative Percent
Valid a. Male 143 58.6 60.9 60.9
b. Female 92 37.7 39.1 100.0
Total 235 96.3 100.0
Missing -99 9 3.7
Total 244 100.0
2
Paraphrase This Document
Need a fresh take? Get an instant paraphrase of this document with our AI Paraphraser
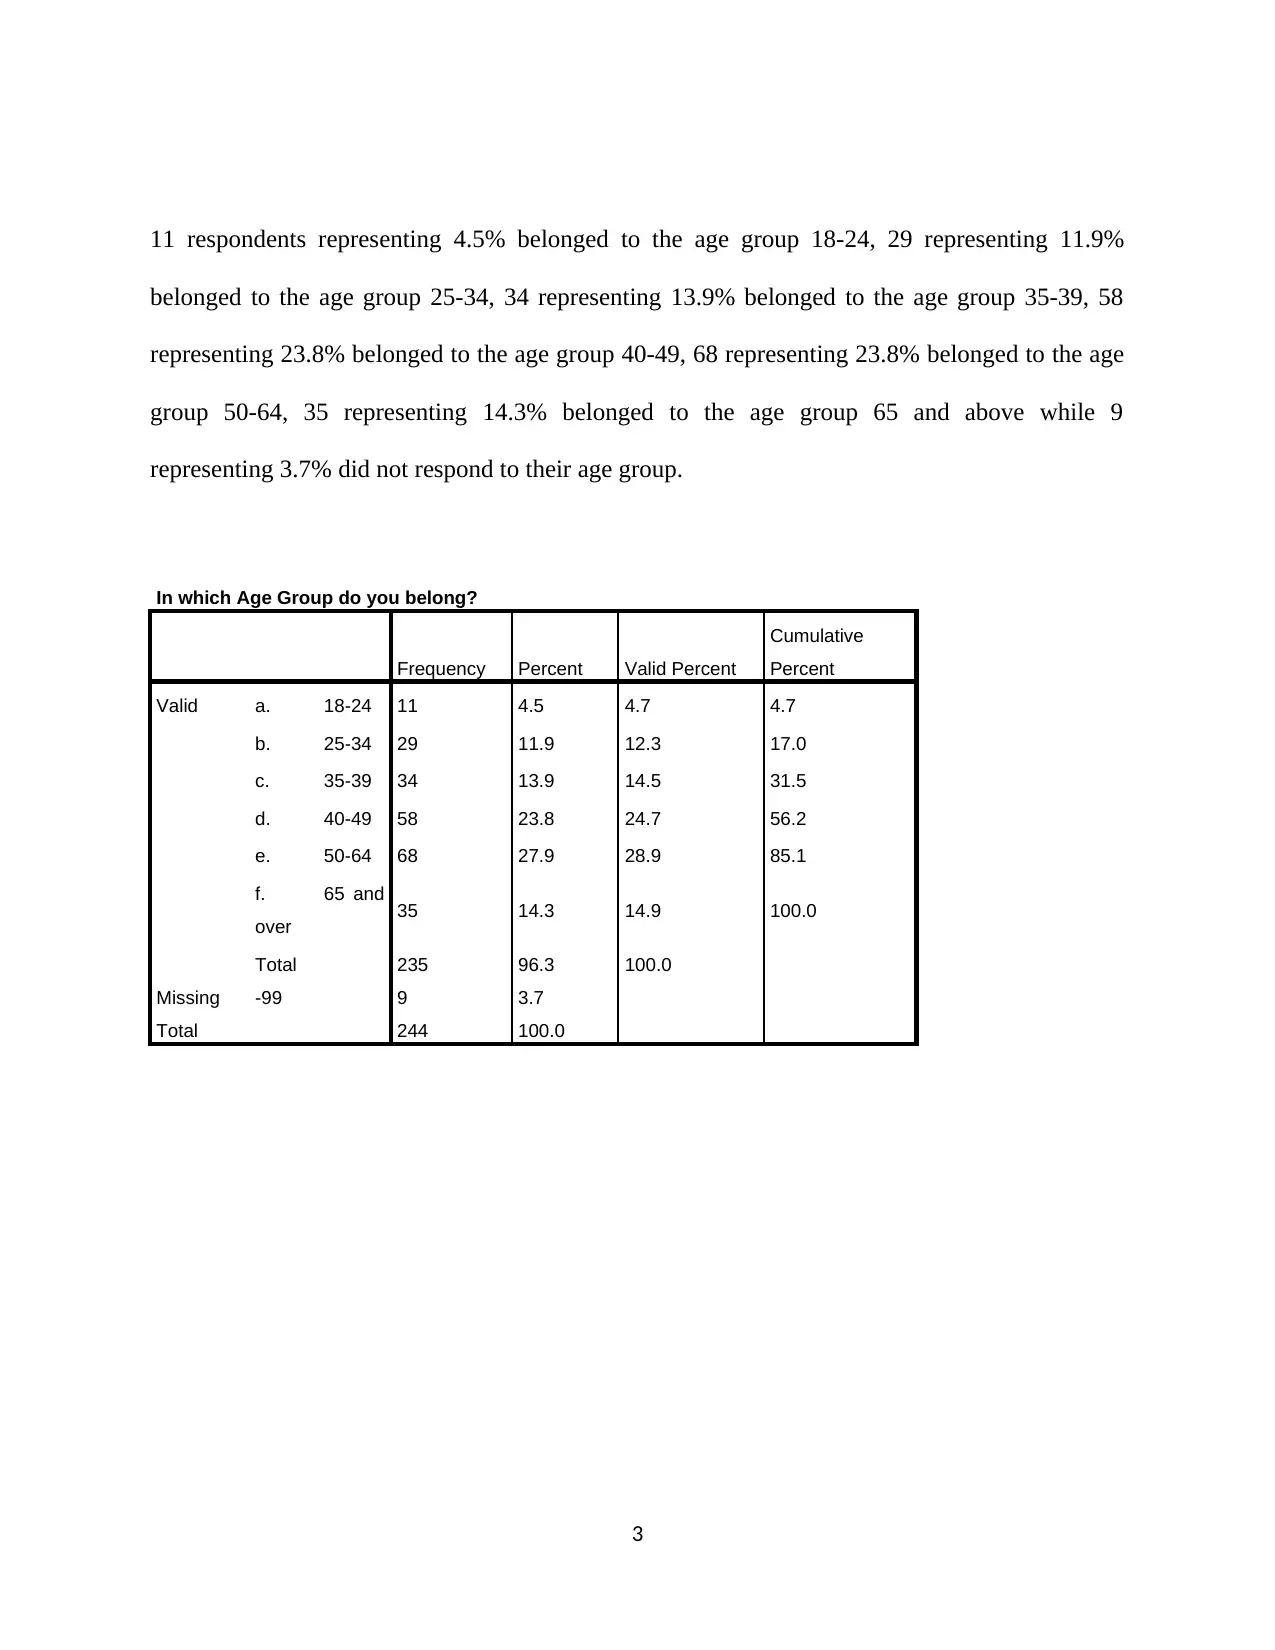
11 respondents representing 4.5% belonged to the age group 18-24, 29 representing 11.9%
belonged to the age group 25-34, 34 representing 13.9% belonged to the age group 35-39, 58
representing 23.8% belonged to the age group 40-49, 68 representing 23.8% belonged to the age
group 50-64, 35 representing 14.3% belonged to the age group 65 and above while 9
representing 3.7% did not respond to their age group.
In which Age Group do you belong?
Frequency Percent Valid Percent
Cumulative
Percent
Valid a. 18-24 11 4.5 4.7 4.7
b. 25-34 29 11.9 12.3 17.0
c. 35-39 34 13.9 14.5 31.5
d. 40-49 58 23.8 24.7 56.2
e. 50-64 68 27.9 28.9 85.1
f. 65 and
over 35 14.3 14.9 100.0
Total 235 96.3 100.0
Missing -99 9 3.7
Total 244 100.0
3
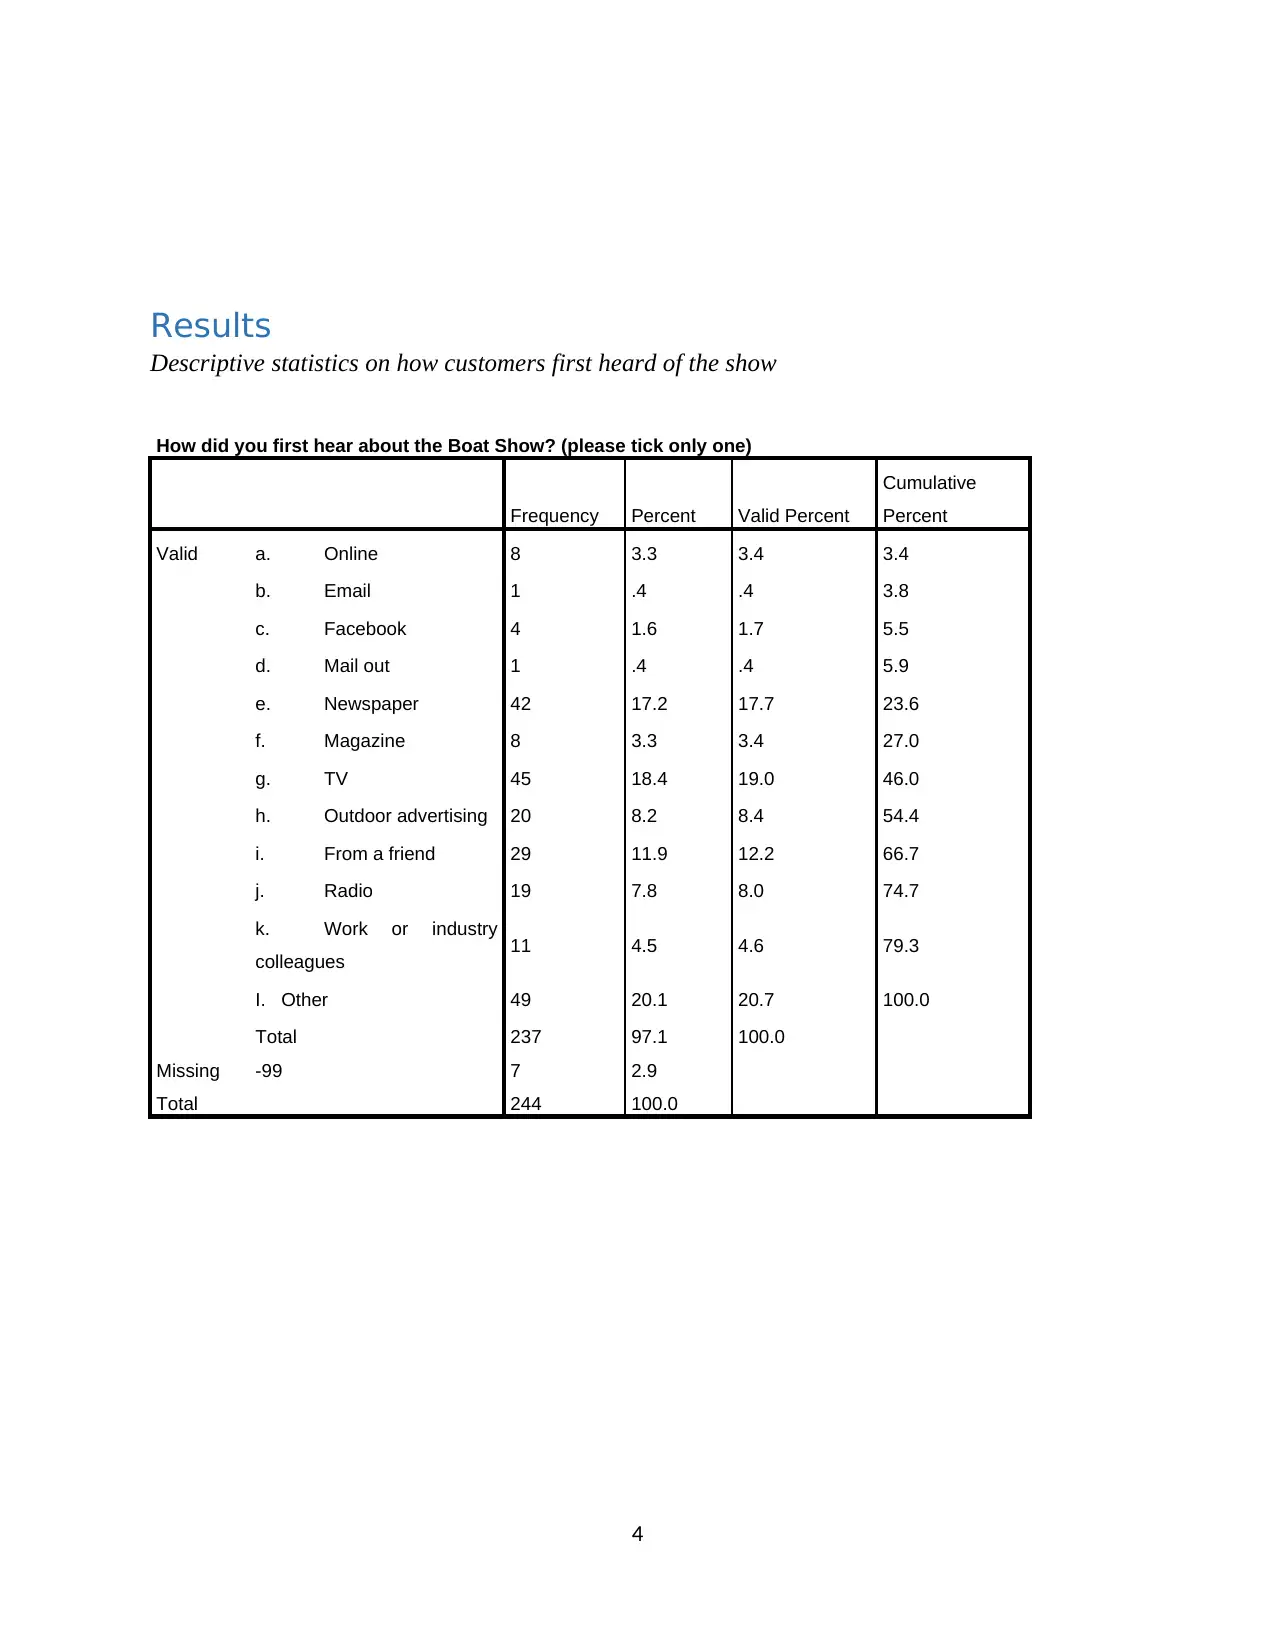
Results
Descriptive statistics on how customers first heard of the show
How did you first hear about the Boat Show? (please tick only one)
Frequency Percent Valid Percent
Cumulative
Percent
Valid a. Online 8 3.3 3.4 3.4
b. Email 1 .4 .4 3.8
c. Facebook 4 1.6 1.7 5.5
d. Mail out 1 .4 .4 5.9
e. Newspaper 42 17.2 17.7 23.6
f. Magazine 8 3.3 3.4 27.0
g. TV 45 18.4 19.0 46.0
h. Outdoor advertising 20 8.2 8.4 54.4
i. From a friend 29 11.9 12.2 66.7
j. Radio 19 7.8 8.0 74.7
k. Work or industry
colleagues 11 4.5 4.6 79.3
I. Other 49 20.1 20.7 100.0
Total 237 97.1 100.0
Missing -99 7 2.9
Total 244 100.0
4
⊘ This is a preview!⊘
Do you want full access?
Subscribe today to unlock all pages.
Trusted by 1+ million students worldwide
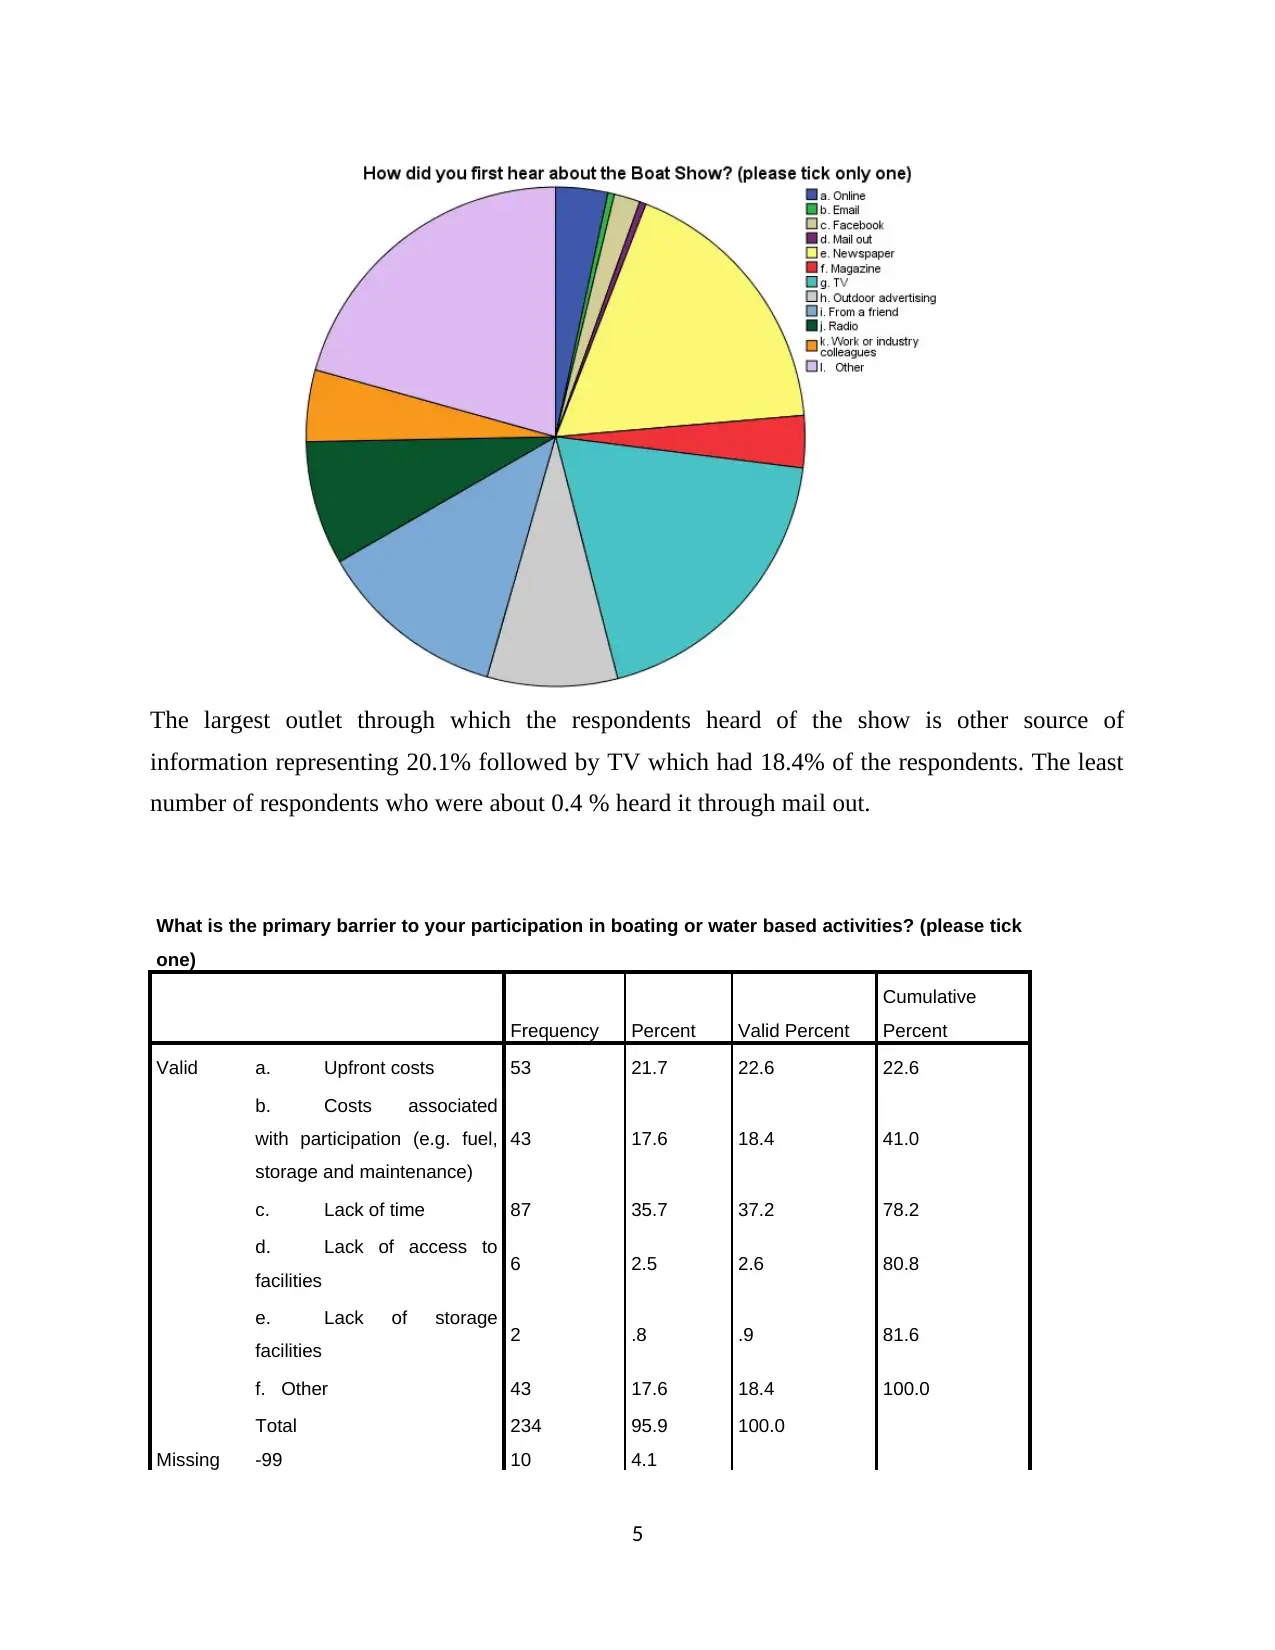
The largest outlet through which the respondents heard of the show is other source of
information representing 20.1% followed by TV which had 18.4% of the respondents. The least
number of respondents who were about 0.4 % heard it through mail out.
What is the primary barrier to your participation in boating or water based activities? (please tick
one)
Frequency Percent Valid Percent
Cumulative
Percent
Valid a. Upfront costs 53 21.7 22.6 22.6
b. Costs associated
with participation (e.g. fuel,
storage and maintenance)
43 17.6 18.4 41.0
c. Lack of time 87 35.7 37.2 78.2
d. Lack of access to
facilities 6 2.5 2.6 80.8
e. Lack of storage
facilities 2 .8 .9 81.6
f. Other 43 17.6 18.4 100.0
Total 234 95.9 100.0
Missing -99 10 4.1
5
Paraphrase This Document
Need a fresh take? Get an instant paraphrase of this document with our AI Paraphraser
Total 244 100.0
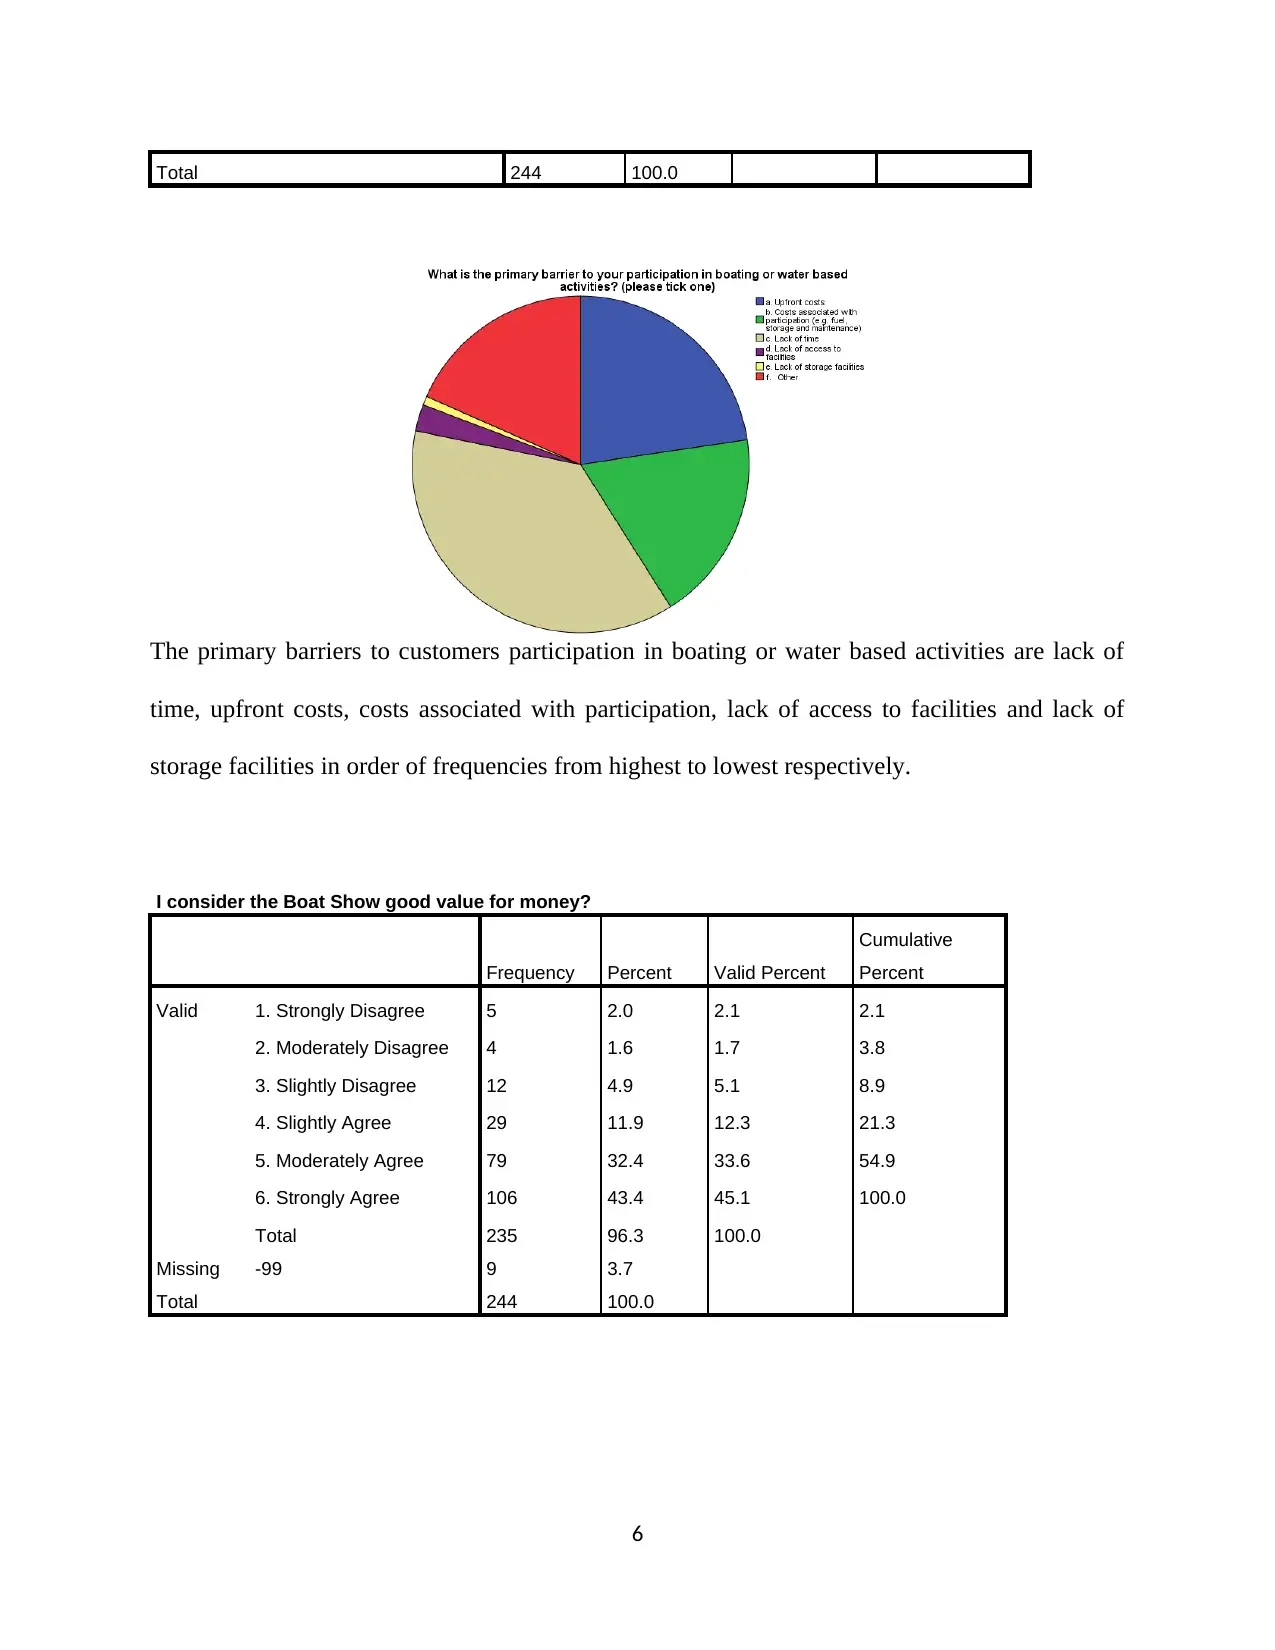
The primary barriers to customers participation in boating or water based activities are lack of
time, upfront costs, costs associated with participation, lack of access to facilities and lack of
storage facilities in order of frequencies from highest to lowest respectively.
I consider the Boat Show good value for money?
Frequency Percent Valid Percent
Cumulative
Percent
Valid 1. Strongly Disagree 5 2.0 2.1 2.1
2. Moderately Disagree 4 1.6 1.7 3.8
3. Slightly Disagree 12 4.9 5.1 8.9
4. Slightly Agree 29 11.9 12.3 21.3
5. Moderately Agree 79 32.4 33.6 54.9
6. Strongly Agree 106 43.4 45.1 100.0
Total 235 96.3 100.0
Missing -99 9 3.7
Total 244 100.0
6
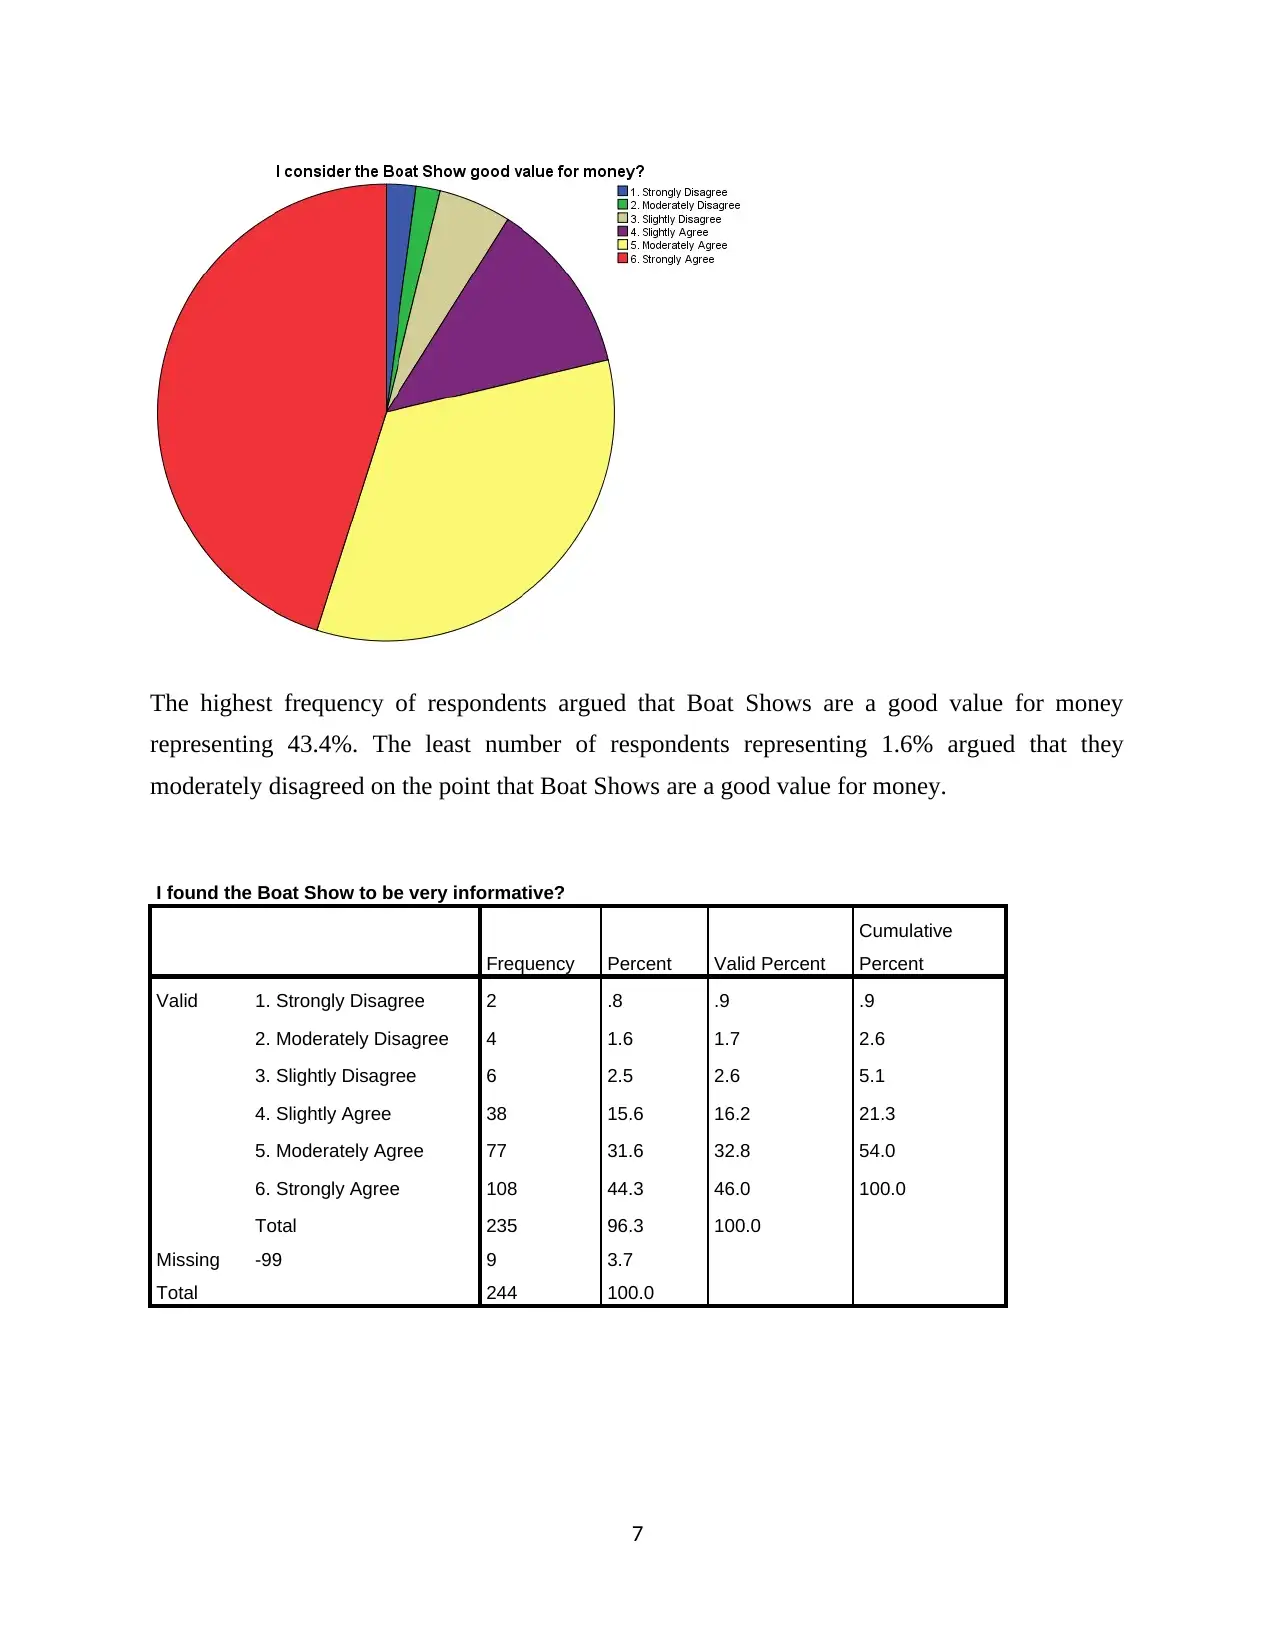
The highest frequency of respondents argued that Boat Shows are a good value for money
representing 43.4%. The least number of respondents representing 1.6% argued that they
moderately disagreed on the point that Boat Shows are a good value for money.
I found the Boat Show to be very informative?
Frequency Percent Valid Percent
Cumulative
Percent
Valid 1. Strongly Disagree 2 .8 .9 .9
2. Moderately Disagree 4 1.6 1.7 2.6
3. Slightly Disagree 6 2.5 2.6 5.1
4. Slightly Agree 38 15.6 16.2 21.3
5. Moderately Agree 77 31.6 32.8 54.0
6. Strongly Agree 108 44.3 46.0 100.0
Total 235 96.3 100.0
Missing -99 9 3.7
Total 244 100.0
7
⊘ This is a preview!⊘
Do you want full access?
Subscribe today to unlock all pages.
Trusted by 1+ million students worldwide
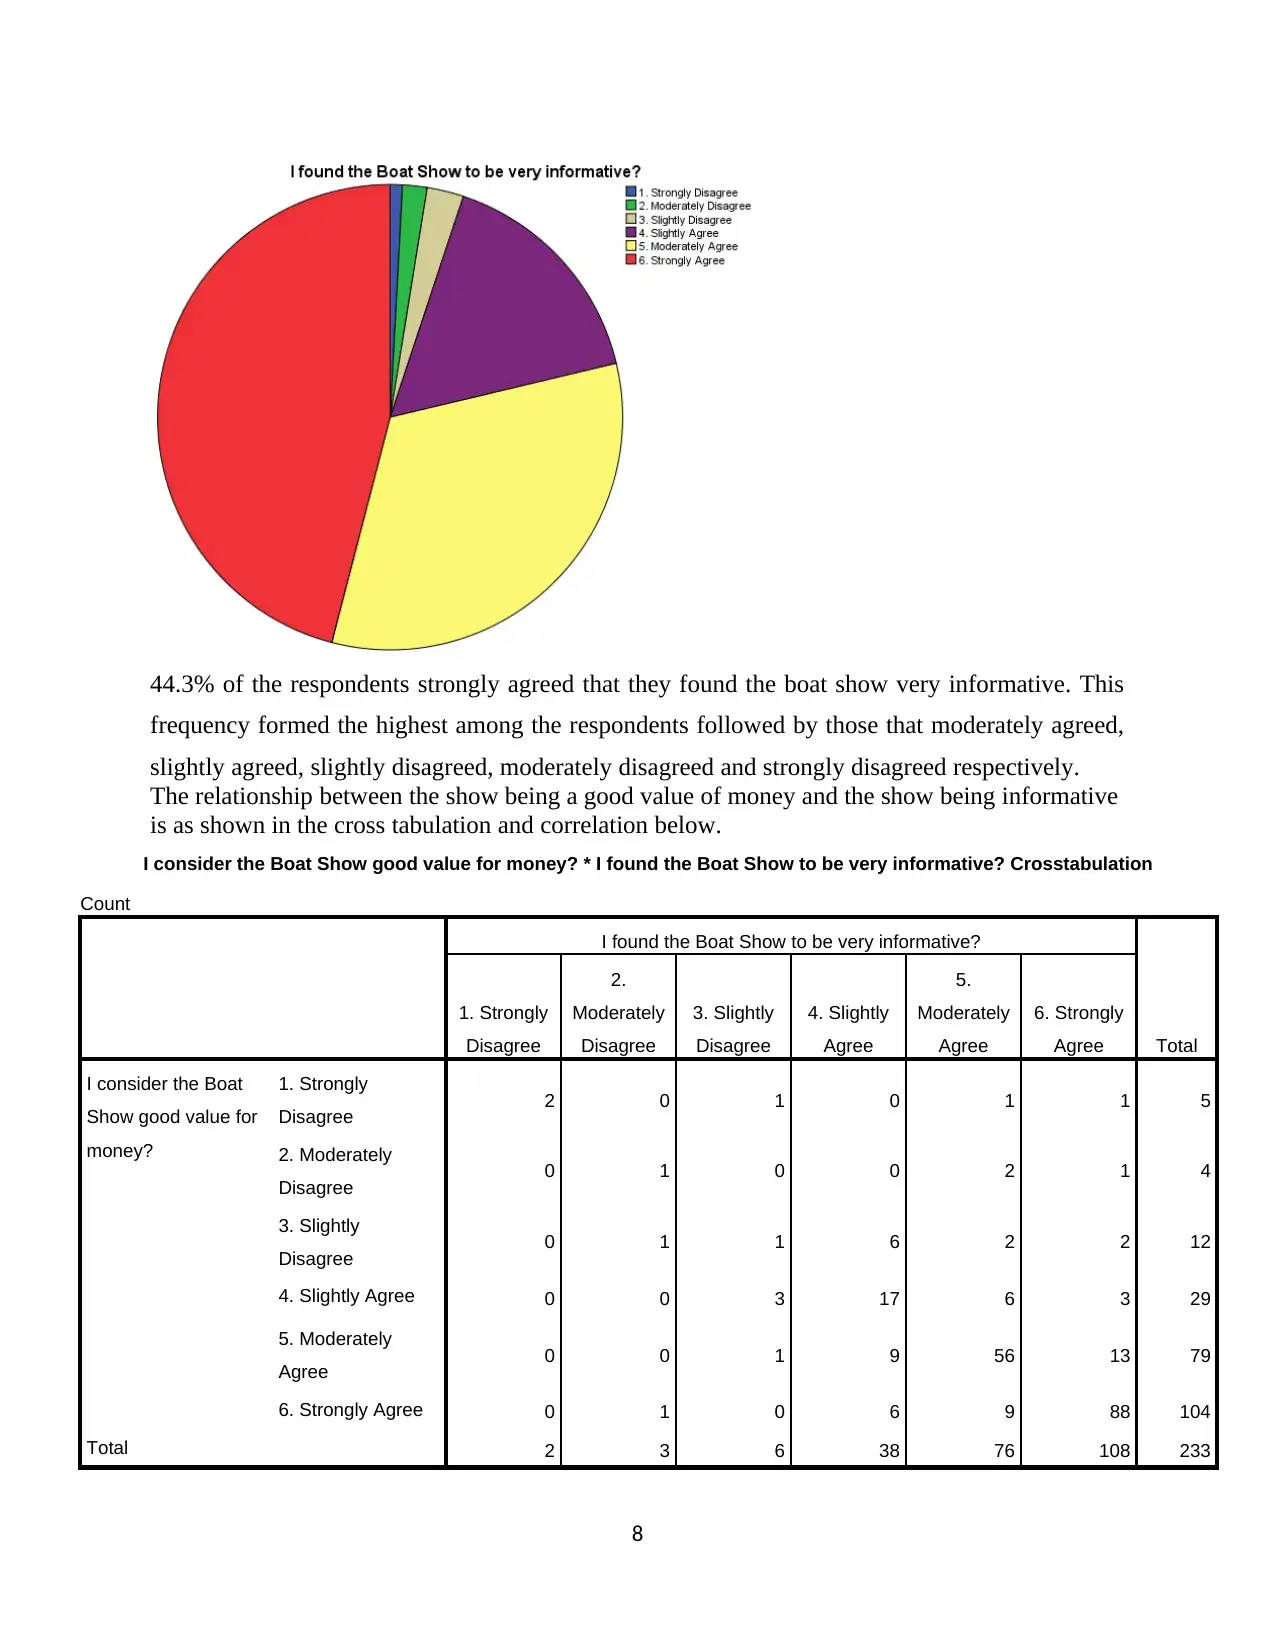
44.3% of the respondents strongly agreed that they found the boat show very informative. This
frequency formed the highest among the respondents followed by those that moderately agreed,
slightly agreed, slightly disagreed, moderately disagreed and strongly disagreed respectively.
The relationship between the show being a good value of money and the show being informative
is as shown in the cross tabulation and correlation below.
I consider the Boat Show good value for money? * I found the Boat Show to be very informative? Crosstabulation
Count
I found the Boat Show to be very informative?
Total
1. Strongly
Disagree
2.
Moderately
Disagree
3. Slightly
Disagree
4. Slightly
Agree
5.
Moderately
Agree
6. Strongly
Agree
I consider the Boat
Show good value for
money?
1. Strongly
Disagree 2 0 1 0 1 1 5
2. Moderately
Disagree 0 1 0 0 2 1 4
3. Slightly
Disagree 0 1 1 6 2 2 12
4. Slightly Agree 0 0 3 17 6 3 29
5. Moderately
Agree 0 0 1 9 56 13 79
6. Strongly Agree 0 1 0 6 9 88 104
Total 2 3 6 38 76 108 233
8
Paraphrase This Document
Need a fresh take? Get an instant paraphrase of this document with our AI Paraphraser
Correlations
I consider the Boat
Show good value for
money?
I found the Boat Show
to be very informative?
I consider the Boat Show good value
for money?
Pearson Correlation 1 .608**
Sig. (2-tailed) .000
N 235 233
I found the Boat Show to be very
informative?
Pearson Correlation .608** 1
Sig. (2-tailed) .000
N 233 235
**. Correlation is significant at the 0.01 level (2-tailed).
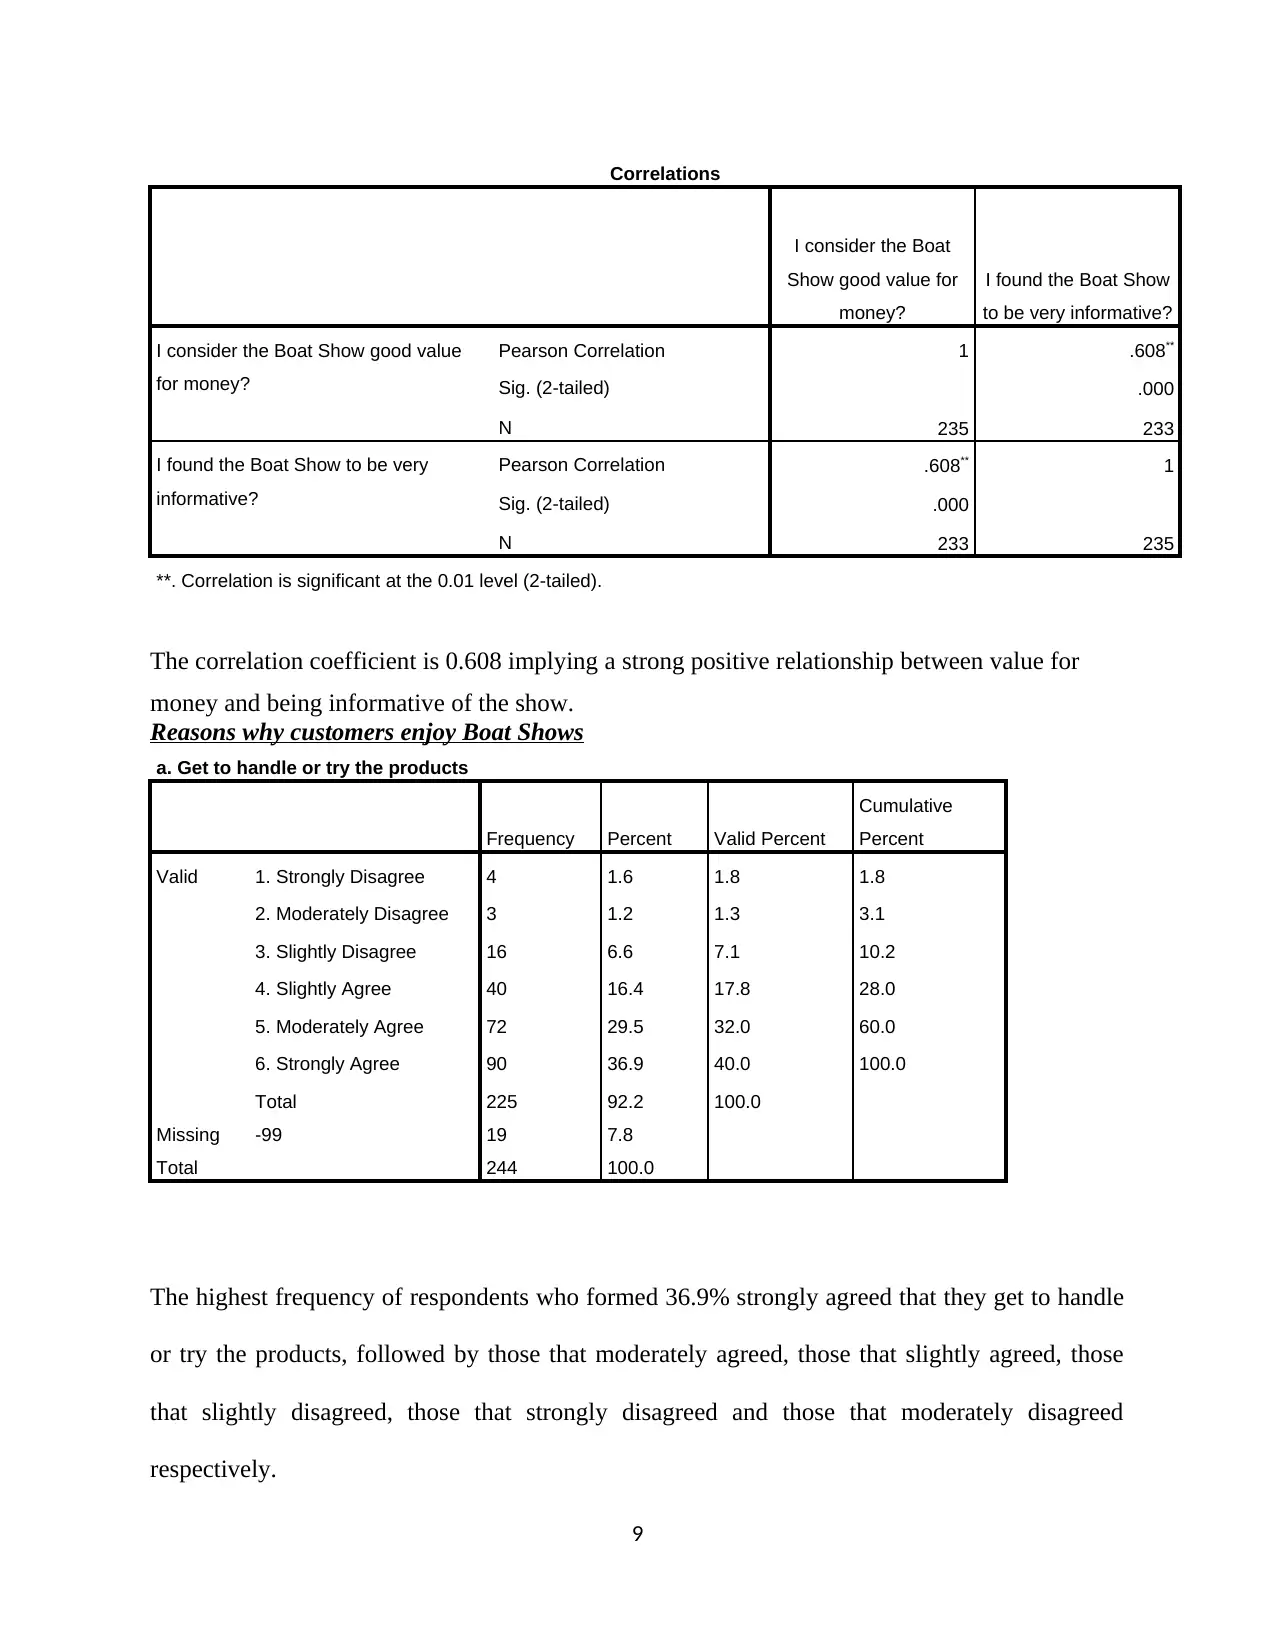
The correlation coefficient is 0.608 implying a strong positive relationship between value for
money and being informative of the show.
Reasons why customers enjoy Boat Shows
a. Get to handle or try the products
Frequency Percent Valid Percent
Cumulative
Percent
Valid 1. Strongly Disagree 4 1.6 1.8 1.8
2. Moderately Disagree 3 1.2 1.3 3.1
3. Slightly Disagree 16 6.6 7.1 10.2
4. Slightly Agree 40 16.4 17.8 28.0
5. Moderately Agree 72 29.5 32.0 60.0
6. Strongly Agree 90 36.9 40.0 100.0
Total 225 92.2 100.0
Missing -99 19 7.8
Total 244 100.0
The highest frequency of respondents who formed 36.9% strongly agreed that they get to handle
or try the products, followed by those that moderately agreed, those that slightly agreed, those
that slightly disagreed, those that strongly disagreed and those that moderately disagreed
respectively.
9
I consider the Boat
Show good value for
money?
I found the Boat Show
to be very informative?
I consider the Boat Show good value
for money?
Pearson Correlation 1 .608**
Sig. (2-tailed) .000
N 235 233
I found the Boat Show to be very
informative?
Pearson Correlation .608** 1
Sig. (2-tailed) .000
N 233 235
**. Correlation is significant at the 0.01 level (2-tailed).
The correlation coefficient is 0.608 implying a strong positive relationship between value for
money and being informative of the show.
Reasons why customers enjoy Boat Shows
a. Get to handle or try the products
Frequency Percent Valid Percent
Cumulative
Percent
Valid 1. Strongly Disagree 4 1.6 1.8 1.8
2. Moderately Disagree 3 1.2 1.3 3.1
3. Slightly Disagree 16 6.6 7.1 10.2
4. Slightly Agree 40 16.4 17.8 28.0
5. Moderately Agree 72 29.5 32.0 60.0
6. Strongly Agree 90 36.9 40.0 100.0
Total 225 92.2 100.0
Missing -99 19 7.8
Total 244 100.0
The highest frequency of respondents who formed 36.9% strongly agreed that they get to handle
or try the products, followed by those that moderately agreed, those that slightly agreed, those
that slightly disagreed, those that strongly disagreed and those that moderately disagreed
respectively.
9
b. Get advice on products I am interested in
Frequency Percent Valid Percent
Cumulative
Percent
Valid 1. Strongly Disagree 3 1.2 1.3 1.3
2. Moderately Disagree 7 2.9 3.1 4.4
3. Slightly Disagree 10 4.1 4.4 8.7
4. Slightly Agree 46 18.9 20.1 28.8
5. Moderately Agree 73 29.9 31.9 60.7
6. Strongly Agree 90 36.9 39.3 100.0
Total 229 93.9 100.0
Missing -99 15 6.1
Total 244 100.0
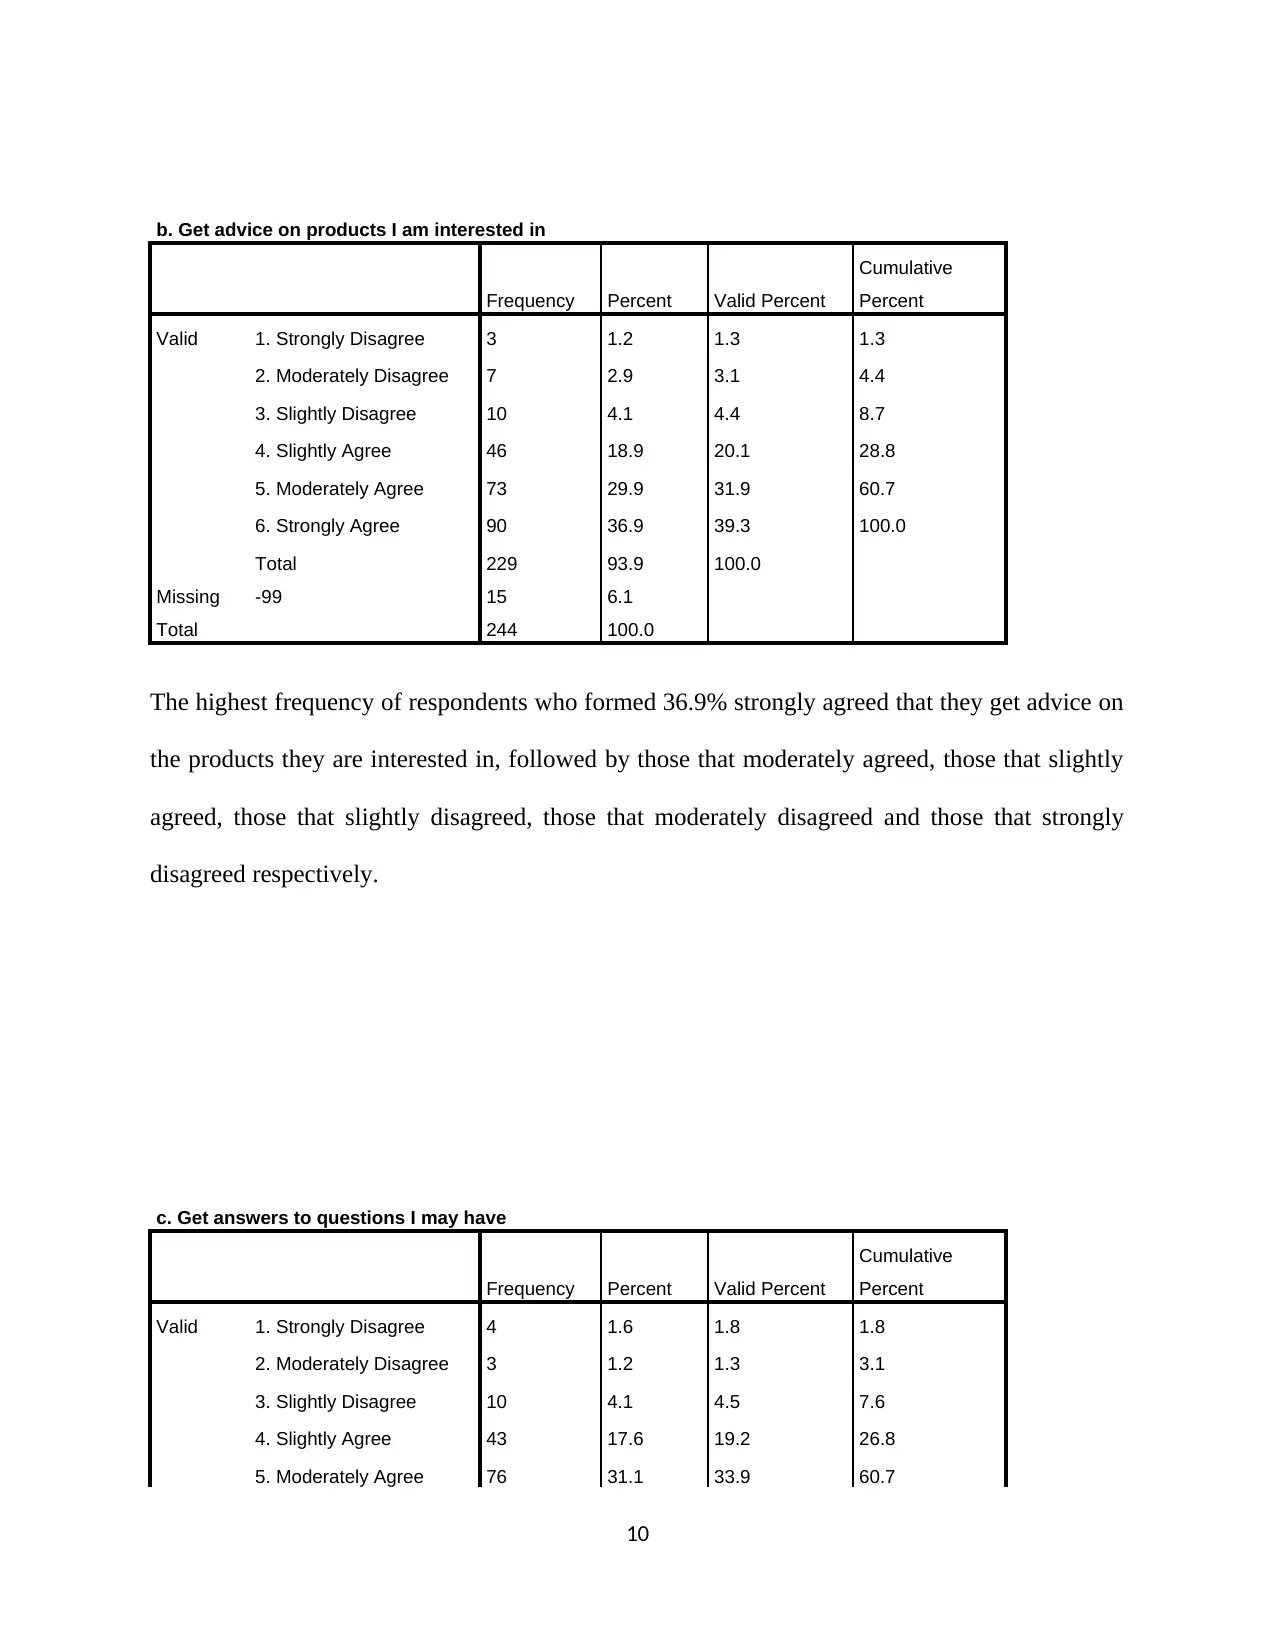
The highest frequency of respondents who formed 36.9% strongly agreed that they get advice on
the products they are interested in, followed by those that moderately agreed, those that slightly
agreed, those that slightly disagreed, those that moderately disagreed and those that strongly
disagreed respectively.
c. Get answers to questions I may have
Frequency Percent Valid Percent
Cumulative
Percent
Valid 1. Strongly Disagree 4 1.6 1.8 1.8
2. Moderately Disagree 3 1.2 1.3 3.1
3. Slightly Disagree 10 4.1 4.5 7.6
4. Slightly Agree 43 17.6 19.2 26.8
5. Moderately Agree 76 31.1 33.9 60.7
10
Frequency Percent Valid Percent
Cumulative
Percent
Valid 1. Strongly Disagree 3 1.2 1.3 1.3
2. Moderately Disagree 7 2.9 3.1 4.4
3. Slightly Disagree 10 4.1 4.4 8.7
4. Slightly Agree 46 18.9 20.1 28.8
5. Moderately Agree 73 29.9 31.9 60.7
6. Strongly Agree 90 36.9 39.3 100.0
Total 229 93.9 100.0
Missing -99 15 6.1
Total 244 100.0
The highest frequency of respondents who formed 36.9% strongly agreed that they get advice on
the products they are interested in, followed by those that moderately agreed, those that slightly
agreed, those that slightly disagreed, those that moderately disagreed and those that strongly
disagreed respectively.
c. Get answers to questions I may have
Frequency Percent Valid Percent
Cumulative
Percent
Valid 1. Strongly Disagree 4 1.6 1.8 1.8
2. Moderately Disagree 3 1.2 1.3 3.1
3. Slightly Disagree 10 4.1 4.5 7.6
4. Slightly Agree 43 17.6 19.2 26.8
5. Moderately Agree 76 31.1 33.9 60.7
10
⊘ This is a preview!⊘
Do you want full access?
Subscribe today to unlock all pages.
Trusted by 1+ million students worldwide
1 out of 18
Your All-in-One AI-Powered Toolkit for Academic Success.
+13062052269
info@desklib.com
Available 24*7 on WhatsApp / Email
![[object Object]](/_next/static/media/star-bottom.7253800d.svg)
Unlock your academic potential
Copyright © 2020–2026 A2Z Services. All Rights Reserved. Developed and managed by ZUCOL.