Body Composition Analysis Practical Report: Health Science Module
VerifiedAdded on 2023/04/08
|16
|2665
|109
Report
AI Summary
This report presents a practical analysis of body composition, comparing results obtained from various anthropometric assessment methods. The study involved ten participants, whose body mass index (BMI), waist-to-hip ratio, and body fat percentages were calculated using bioimpedance and 'Body Stat' equipment. The report highlights the discrepancies in results due to the varied working principles of each method, with body composition methods generally showing higher body fat percentages, possibly due to their greater accuracy and comprehensiveness. The findings suggest that future health professionals should employ a range of techniques for improved assessment and clinical diagnosis, while also considering the importance of cost-effectiveness. The report includes detailed data tables, figures illustrating body fat percentages, and a discussion of the results, limitations, and conclusions drawn from the study. It emphasizes the need for a collaborative approach in healthcare to ensure accurate screening and positive health outcomes.
Running head: BODY COMPOSITION ANALYSIS PRACTICAL
BODY COMPOSITION ANALYSIS USING VARIOUS ANTHROPOMETRIC
MEASUREMENT TEACHNIQUES AND EQUIPMENT
Name of the Student:
Name of the University:
Author note:
BODY COMPOSITION ANALYSIS USING VARIOUS ANTHROPOMETRIC
MEASUREMENT TEACHNIQUES AND EQUIPMENT
Name of the Student:
Name of the University:
Author note:
Paraphrase This Document
Need a fresh take? Get an instant paraphrase of this document with our AI Paraphraser
1BODY COMPOSITION ANALYSIS PRACTICAL
Executive Summary
The paragraphs of the report aims to shed light on the different results of body composition
and anthropometric measurements obtained. The study consisted of 10 participants, whose
body mass index, waist-to-hip ratio and body fat percentages were calculated using bio-
impedance and body composition ‘Bio Stat’ equipment. It was observed that different
methods reported different results due to their varied principles of working. Body
composition results of body fat percentages showed higher number of individuals in
possession of ‘unacceptable’ or ‘unhealthy’ adiposity levels, possibly due to greater
comprehensiveness, accuracy and detail. Hence, future health professionals must incorporate
varied techniques for improved assessment along with consideration of cost effectiveness.
2BODY COMPOSITION ANALYSIS PRACTICAL
Table of Contents
Introduction....................................................................................................................3
Aim.................................................................................................................................3
Hypothesis......................................................................................................................3
Method...........................................................................................................................4
Results............................................................................................................................5
Table 1: Body Composition Data using various Methods (As designed by the
Author)...................................................................................................................................5
Figure 1: Body Fat Percentages by Bio-Impedance and Body Composition (As
designed by the Author).........................................................................................................7
Figure 2: Distribution of ‘healthy/acceptable’ subjects across all the methods.........8
Discussion......................................................................................................................8
Conclusion....................................................................................................................11
References....................................................................................................................12
Appendices...................................................................................................................15
Appendix 1: Raw Data (As collected by the Author)..............................................15
⊘ This is a preview!⊘
Do you want full access?
Subscribe today to unlock all pages.
Trusted by 1+ million students worldwide
3BODY COMPOSITION ANALYSIS PRACTICAL
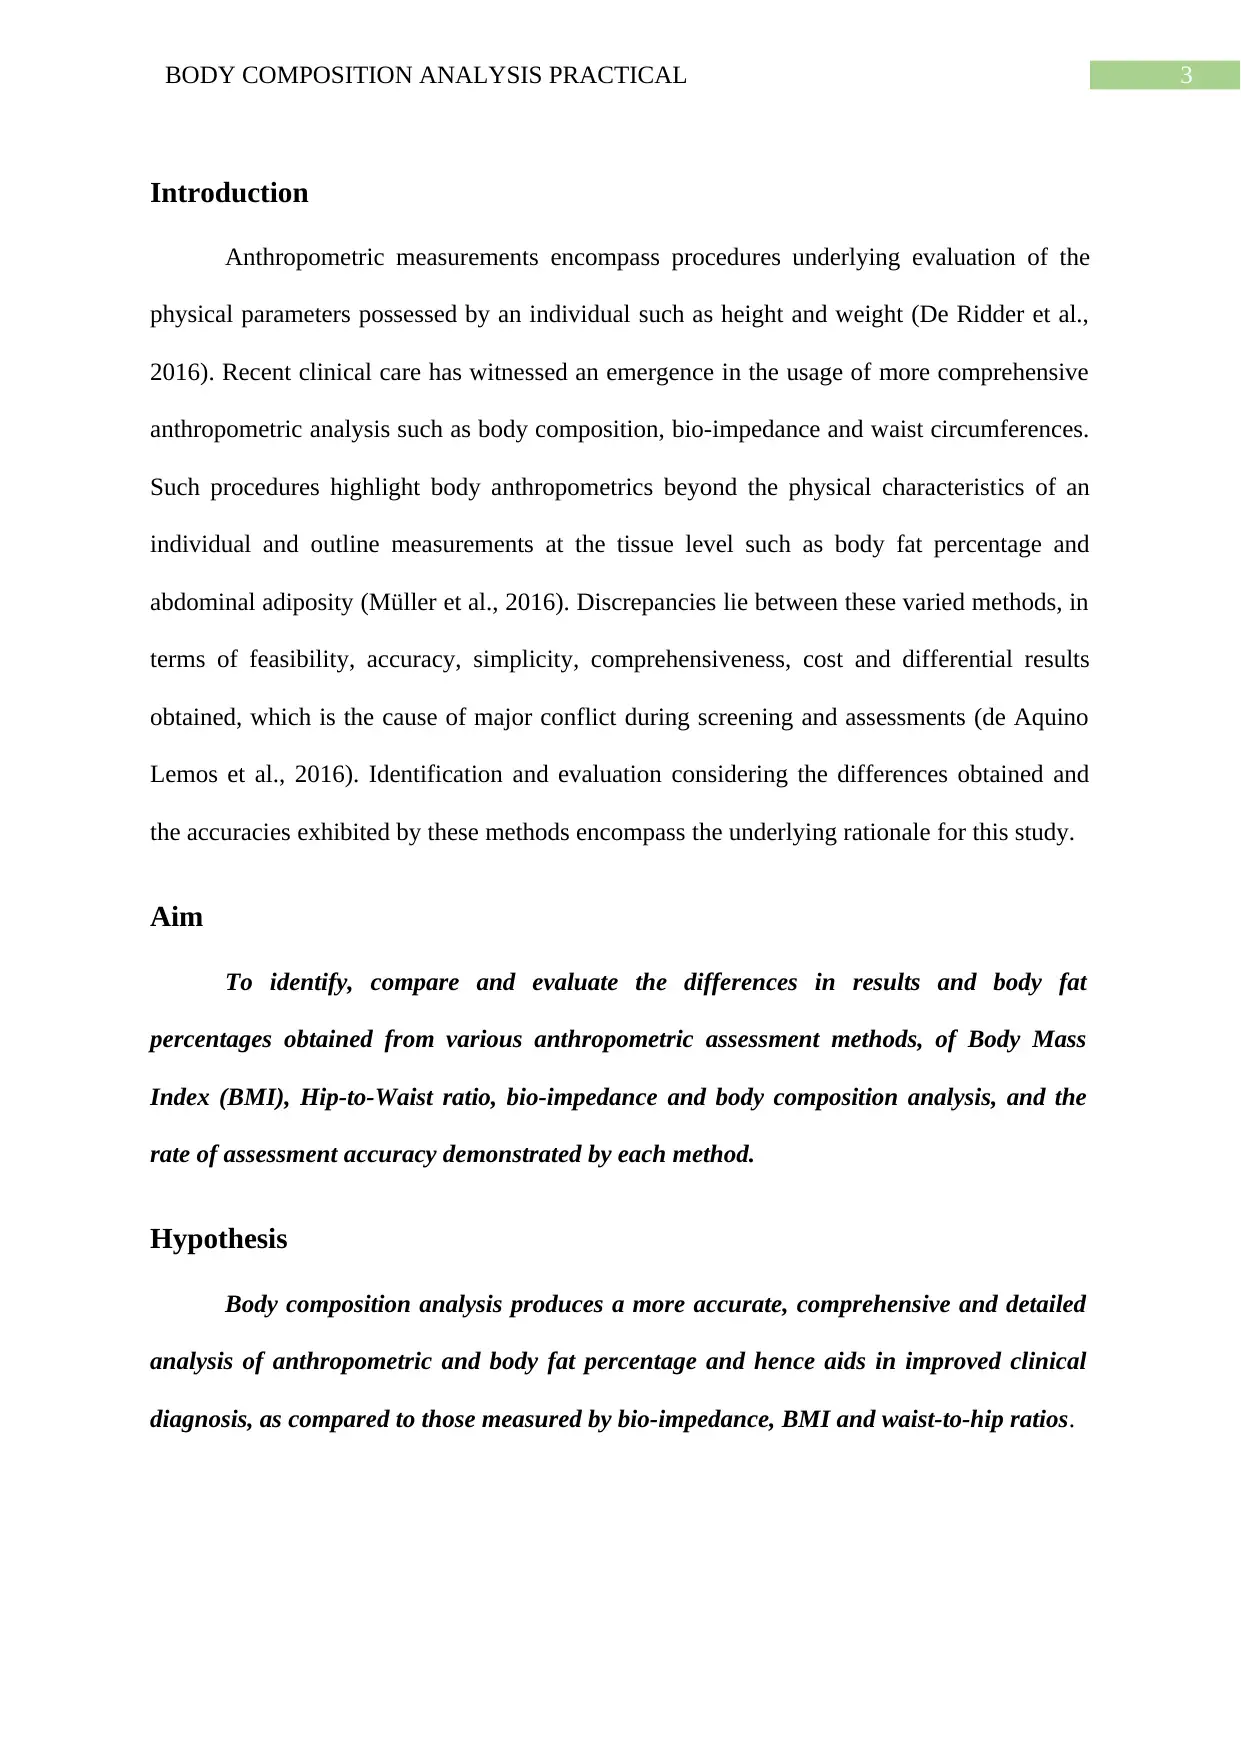
Introduction
Anthropometric measurements encompass procedures underlying evaluation of the
physical parameters possessed by an individual such as height and weight (De Ridder et al.,
2016). Recent clinical care has witnessed an emergence in the usage of more comprehensive
anthropometric analysis such as body composition, bio-impedance and waist circumferences.
Such procedures highlight body anthropometrics beyond the physical characteristics of an
individual and outline measurements at the tissue level such as body fat percentage and
abdominal adiposity (Müller et al., 2016). Discrepancies lie between these varied methods, in
terms of feasibility, accuracy, simplicity, comprehensiveness, cost and differential results
obtained, which is the cause of major conflict during screening and assessments (de Aquino
Lemos et al., 2016). Identification and evaluation considering the differences obtained and
the accuracies exhibited by these methods encompass the underlying rationale for this study.
Aim
To identify, compare and evaluate the differences in results and body fat
percentages obtained from various anthropometric assessment methods, of Body Mass
Index (BMI), Hip-to-Waist ratio, bio-impedance and body composition analysis, and the
rate of assessment accuracy demonstrated by each method.
Hypothesis
Body composition analysis produces a more accurate, comprehensive and detailed
analysis of anthropometric and body fat percentage and hence aids in improved clinical
diagnosis, as compared to those measured by bio-impedance, BMI and waist-to-hip ratios.
Paraphrase This Document
Need a fresh take? Get an instant paraphrase of this document with our AI Paraphraser
4BODY COMPOSITION ANALYSIS PRACTICAL
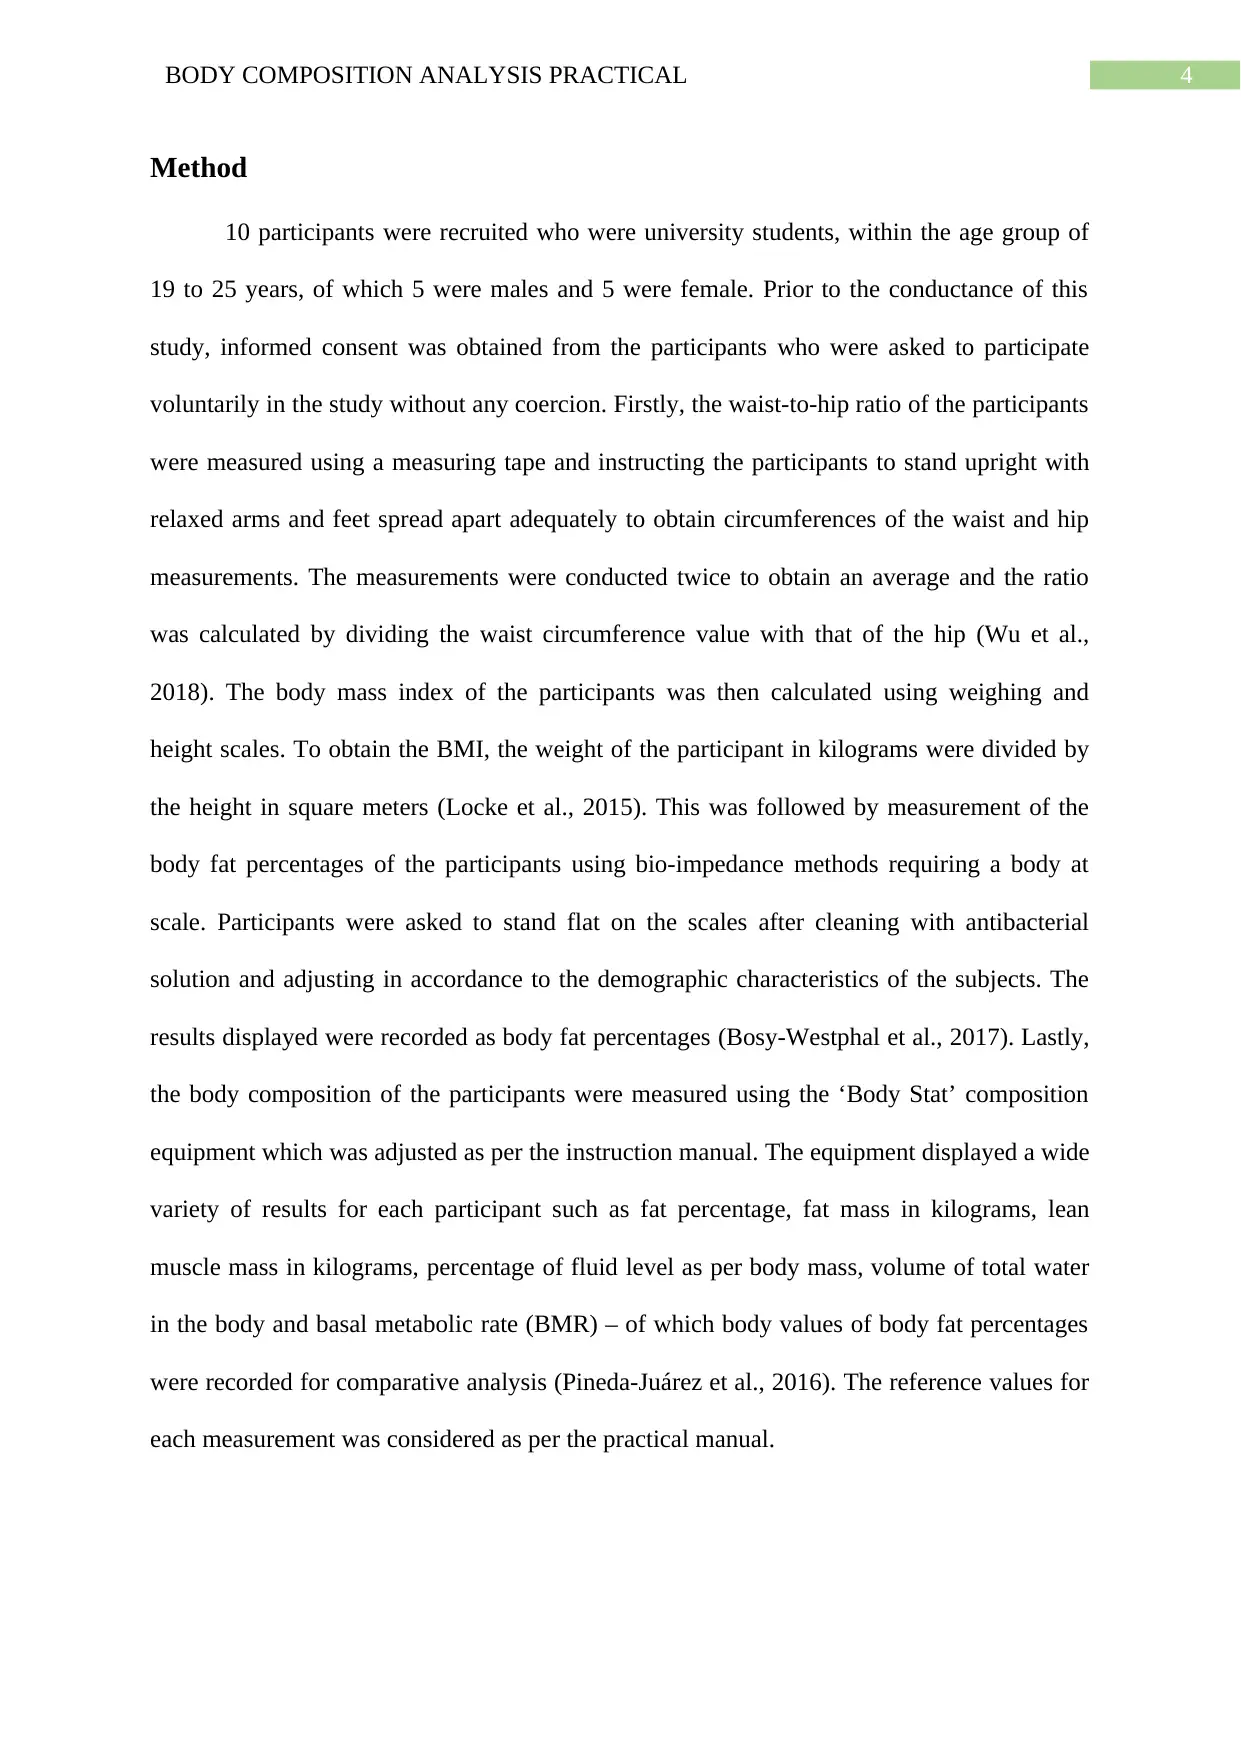
Method
10 participants were recruited who were university students, within the age group of
19 to 25 years, of which 5 were males and 5 were female. Prior to the conductance of this
study, informed consent was obtained from the participants who were asked to participate
voluntarily in the study without any coercion. Firstly, the waist-to-hip ratio of the participants
were measured using a measuring tape and instructing the participants to stand upright with
relaxed arms and feet spread apart adequately to obtain circumferences of the waist and hip
measurements. The measurements were conducted twice to obtain an average and the ratio
was calculated by dividing the waist circumference value with that of the hip (Wu et al.,
2018). The body mass index of the participants was then calculated using weighing and
height scales. To obtain the BMI, the weight of the participant in kilograms were divided by
the height in square meters (Locke et al., 2015). This was followed by measurement of the
body fat percentages of the participants using bio-impedance methods requiring a body at
scale. Participants were asked to stand flat on the scales after cleaning with antibacterial
solution and adjusting in accordance to the demographic characteristics of the subjects. The
results displayed were recorded as body fat percentages (Bosy-Westphal et al., 2017). Lastly,
the body composition of the participants were measured using the ‘Body Stat’ composition
equipment which was adjusted as per the instruction manual. The equipment displayed a wide
variety of results for each participant such as fat percentage, fat mass in kilograms, lean
muscle mass in kilograms, percentage of fluid level as per body mass, volume of total water
in the body and basal metabolic rate (BMR) – of which body values of body fat percentages
were recorded for comparative analysis (Pineda-Juárez et al., 2016). The reference values for
each measurement was considered as per the practical manual.
5BODY COMPOSITION ANALYSIS PRACTICAL
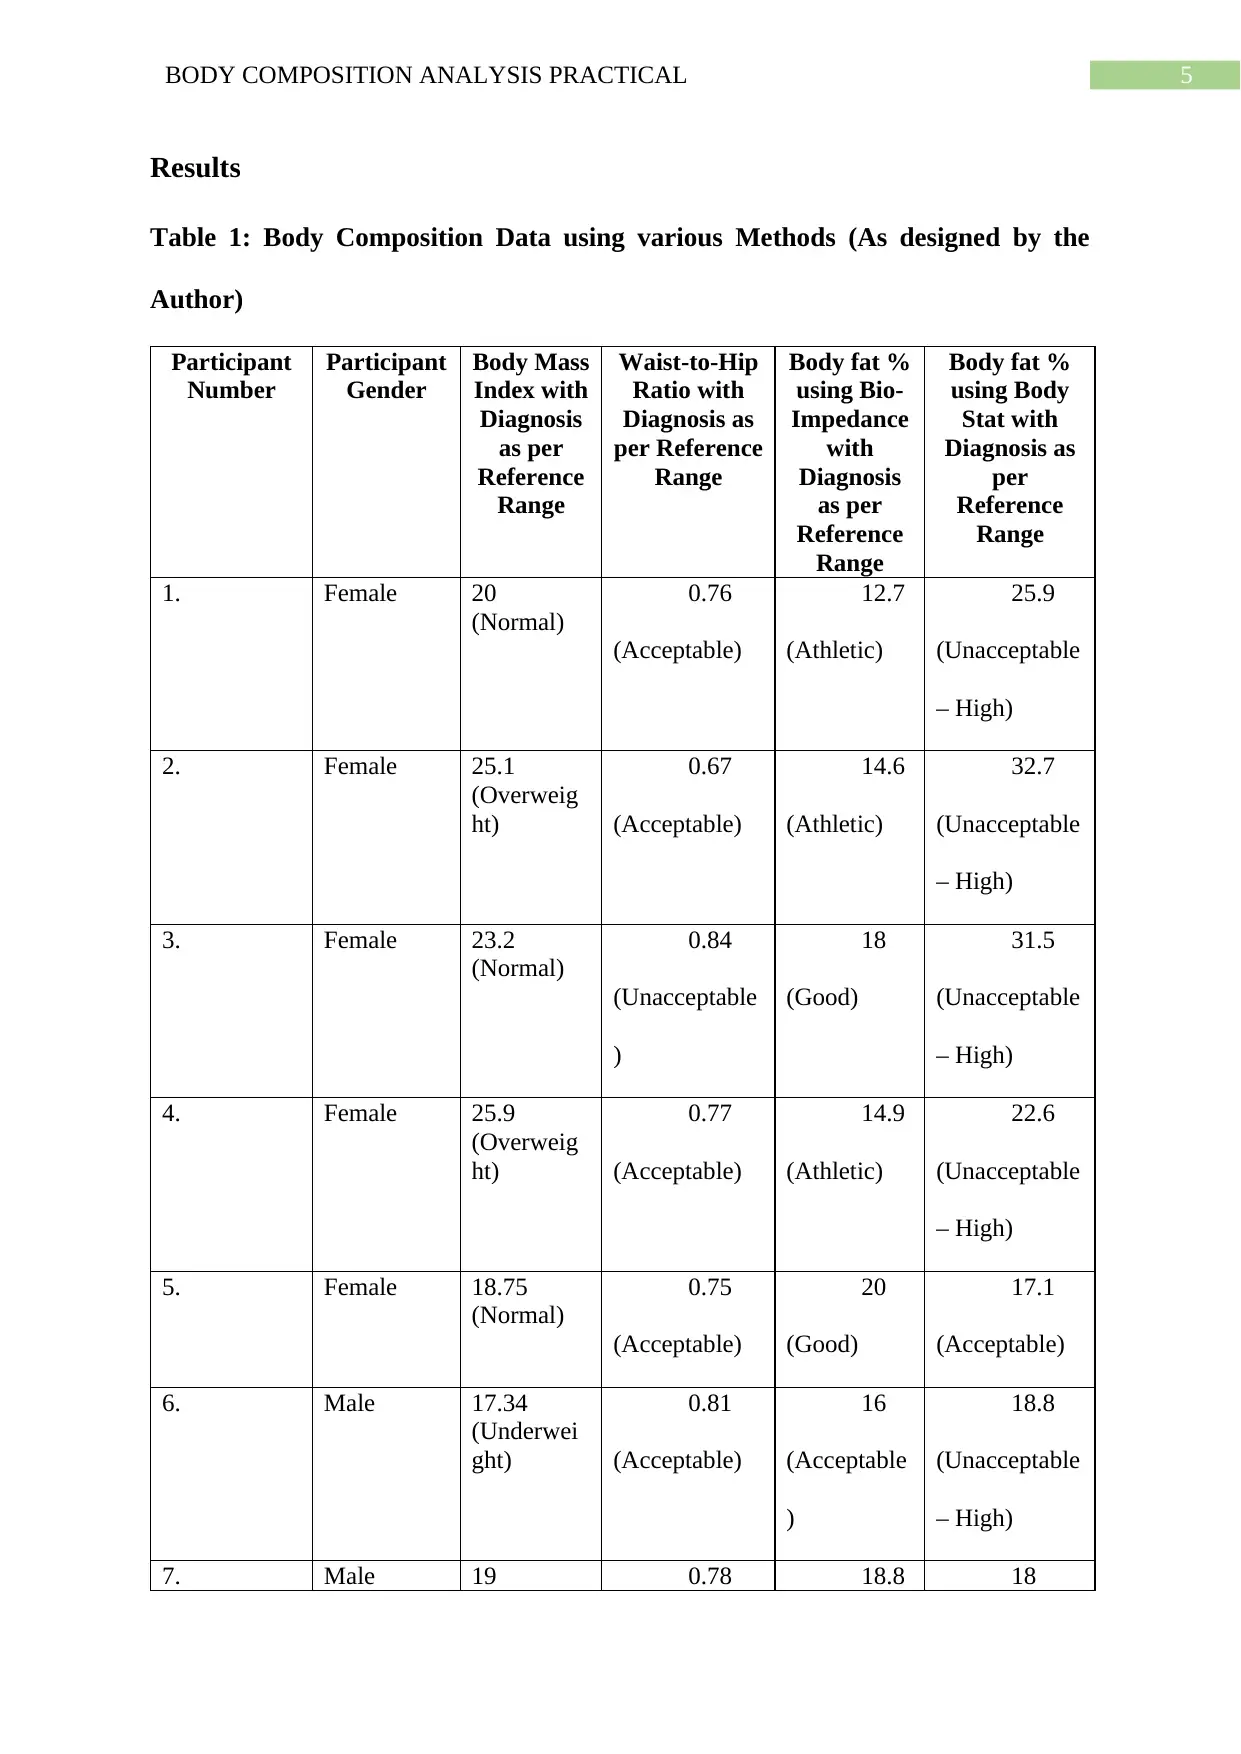
Results
Table 1: Body Composition Data using various Methods (As designed by the
Author)
Participant
Number
Participant
Gender
Body Mass
Index with
Diagnosis
as per
Reference
Range
Waist-to-Hip
Ratio with
Diagnosis as
per Reference
Range
Body fat %
using Bio-
Impedance
with
Diagnosis
as per
Reference
Range
Body fat %
using Body
Stat with
Diagnosis as
per
Reference
Range
1. Female 20
(Normal)
0.76
(Acceptable)
12.7
(Athletic)
25.9
(Unacceptable
– High)
2. Female 25.1
(Overweig
ht)
0.67
(Acceptable)
14.6
(Athletic)
32.7
(Unacceptable
– High)
3. Female 23.2
(Normal)
0.84
(Unacceptable
)
18
(Good)
31.5
(Unacceptable
– High)
4. Female 25.9
(Overweig
ht)
0.77
(Acceptable)
14.9
(Athletic)
22.6
(Unacceptable
– High)
5. Female 18.75
(Normal)
0.75
(Acceptable)
20
(Good)
17.1
(Acceptable)
6. Male 17.34
(Underwei
ght)
0.81
(Acceptable)
16
(Acceptable
)
18.8
(Unacceptable
– High)
7. Male 19 0.78 18.8 18
⊘ This is a preview!⊘
Do you want full access?
Subscribe today to unlock all pages.
Trusted by 1+ million students worldwide
6BODY COMPOSITION ANALYSIS PRACTICAL
(Normal) (Acceptable) (Acceptable
)
(Acceptable)
8. Male 23.7
(Normal)
0.83
(Acceptable)
27.2
(Obesity)
17.3
(Acceptable)
9. Male 22.7
(Normal)
0.85
(Acceptable)
4.8
(Athletic)
18.5
(Unacceptable
– High)
10. Male 18.7
(Normal)
0.76
(Acceptable)
- -
Table 1 summarises the key body composition results obtained from various
procedures, and hence highlights differences in values and diagnosis obtained across these
methods. It can be observed that body fat percentage values recorded by body composition
methods are much higher in comparison to those measured by bio-impedance methods. The
same can be observed in diagnosis where most individuals are classified to possess
unacceptable body fat percentages which is conflicting with otherwise ‘healthy’ or
‘acceptable’ values presented by BMI and waist-to-hip ratios.
Paraphrase This Document
Need a fresh take? Get an instant paraphrase of this document with our AI Paraphraser
7BODY COMPOSITION ANALYSIS PRACTICAL
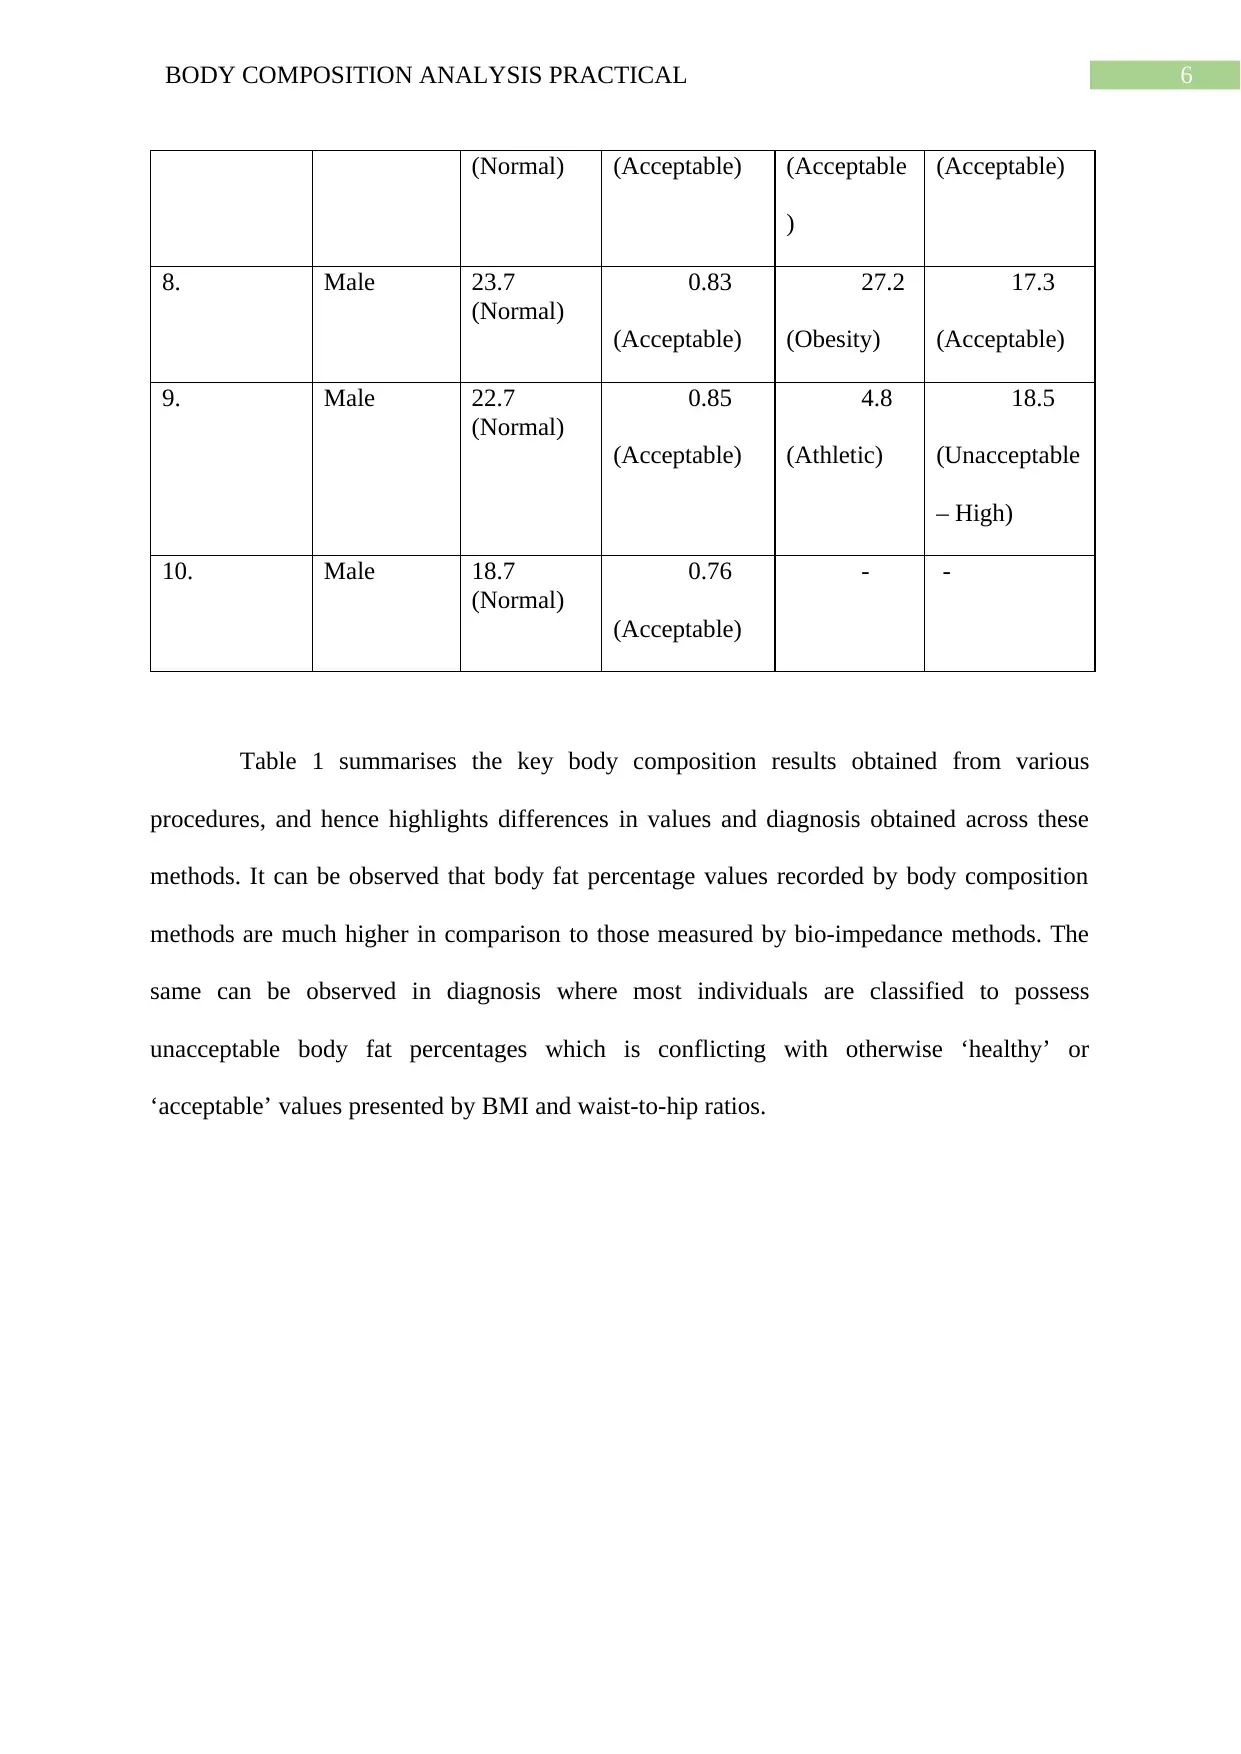
Figure 1: Body Fat Percentages by Bio-Impedance and Body Composition (As
designed by the Author)
Participant
1 Participant
2 Participant
3 Participant
4 Participant
5 Participant
6 Particioant
7 Partcipant
8 Participant
9
0
5
10
15
20
25
30
35
Body Fat Percentages (%)
Bio-Impedance Body Composition
Figure 1 outlines the differences in body fat percentages measured by both bio-
impedance and body composition equipment where the former has been demonstrated to
display higher percentages of body fat among participants.
8BODY COMPOSITION ANALYSIS PRACTICAL
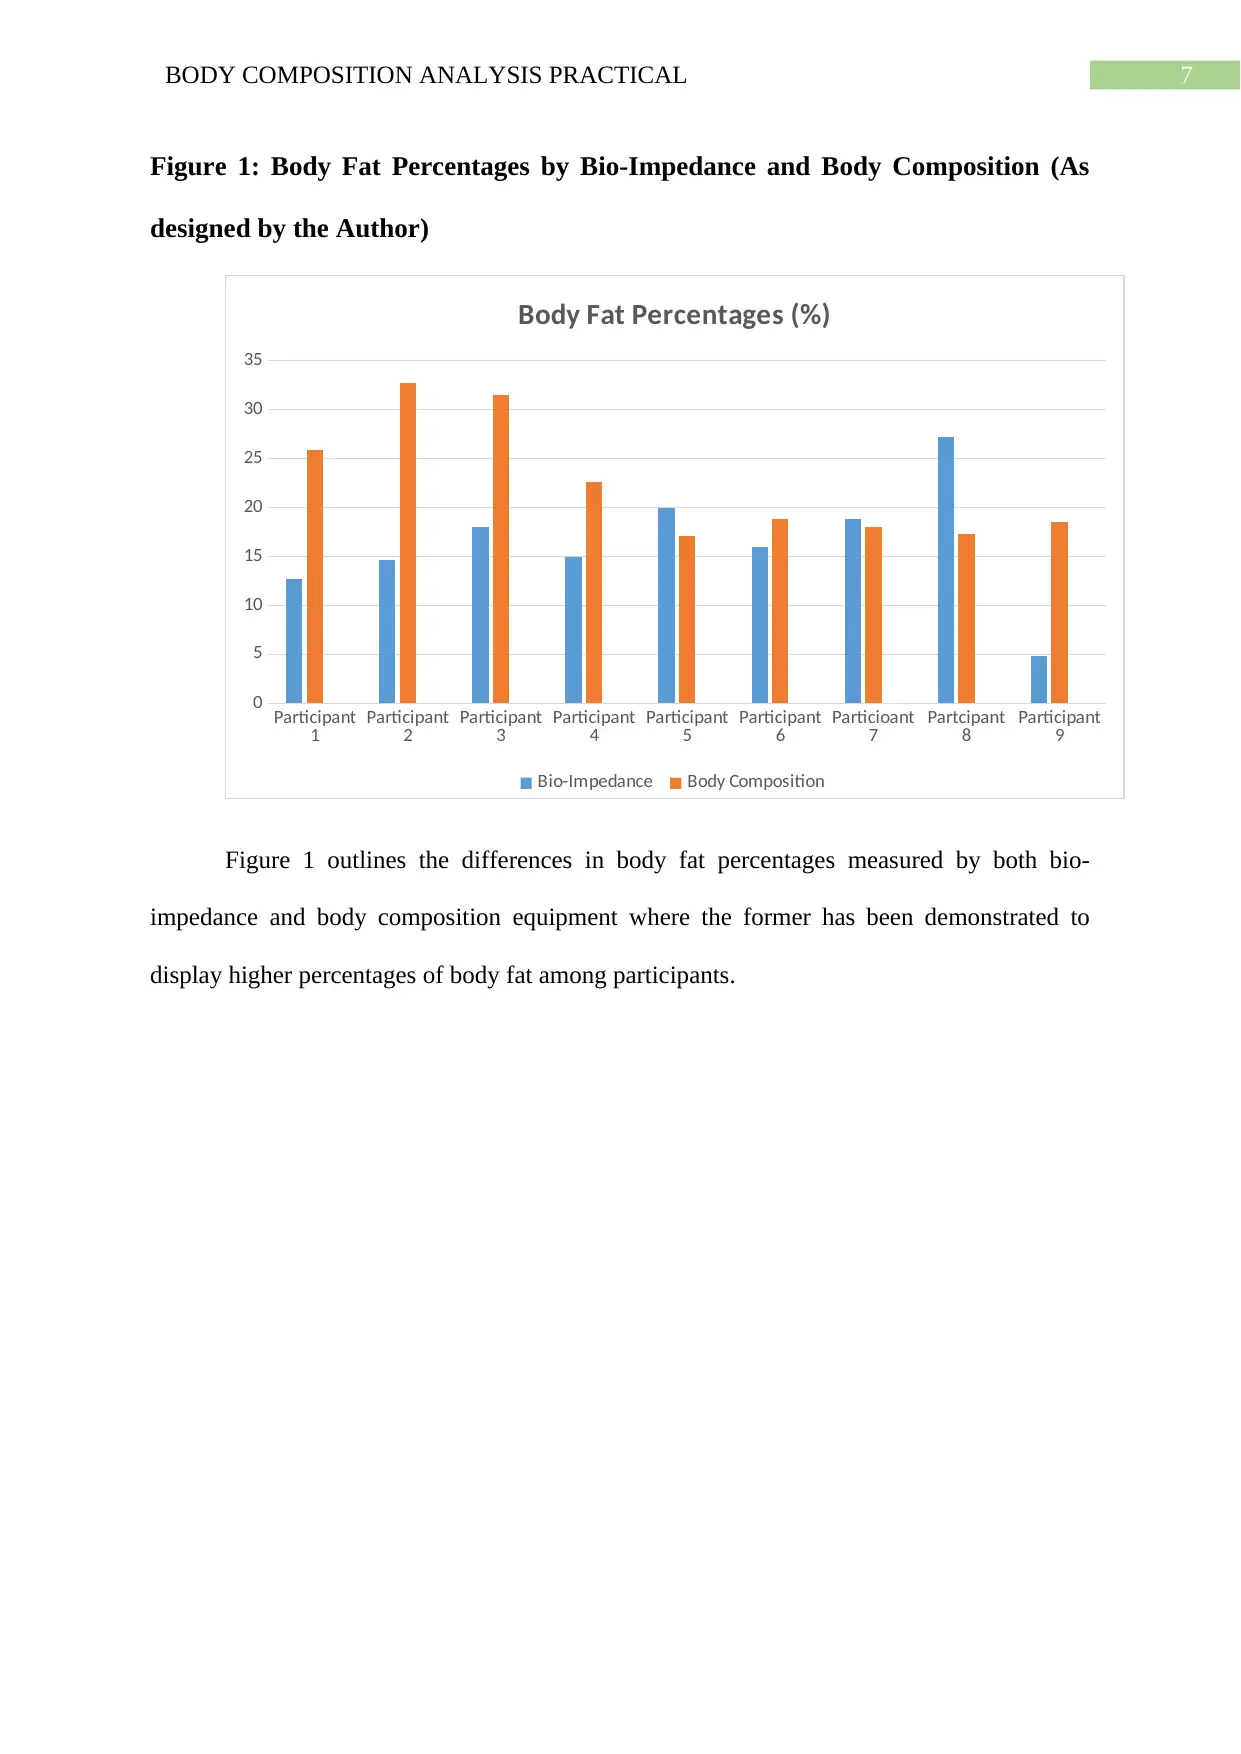
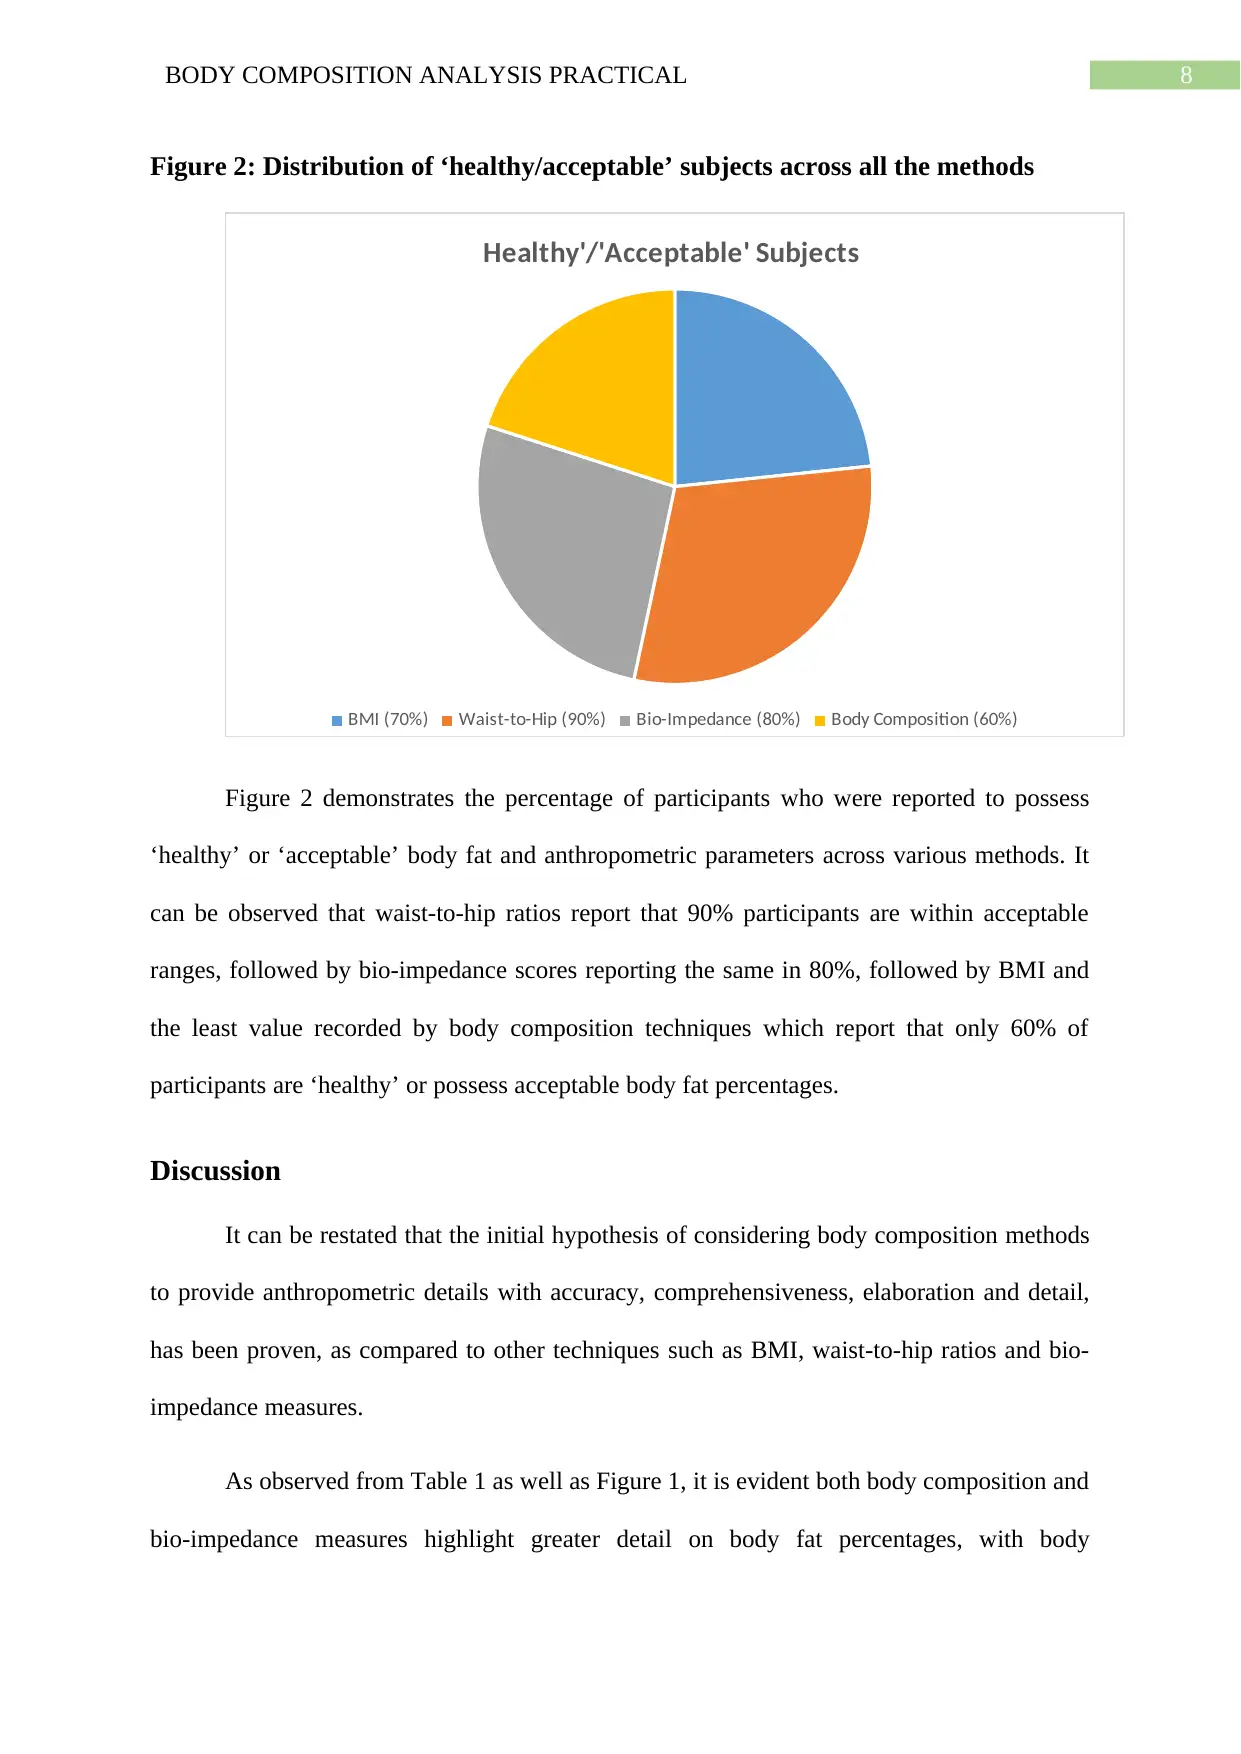
Figure 2: Distribution of ‘healthy/acceptable’ subjects across all the methods
Healthy'/'Acceptable' Subjects
BMI (70%) Waist-to-Hip (90%) Bio-Impedance (80%) Body Composition (60%)
Figure 2 demonstrates the percentage of participants who were reported to possess
‘healthy’ or ‘acceptable’ body fat and anthropometric parameters across various methods. It
can be observed that waist-to-hip ratios report that 90% participants are within acceptable
ranges, followed by bio-impedance scores reporting the same in 80%, followed by BMI and
the least value recorded by body composition techniques which report that only 60% of
participants are ‘healthy’ or possess acceptable body fat percentages.
Discussion
It can be restated that the initial hypothesis of considering body composition methods
to provide anthropometric details with accuracy, comprehensiveness, elaboration and detail,
has been proven, as compared to other techniques such as BMI, waist-to-hip ratios and bio-
impedance measures.
As observed from Table 1 as well as Figure 1, it is evident both body composition and
bio-impedance measures highlight greater detail on body fat percentages, with body
⊘ This is a preview!⊘
Do you want full access?
Subscribe today to unlock all pages.
Trusted by 1+ million students worldwide
9BODY COMPOSITION ANALYSIS PRACTICAL
composition methods highlighting higher values of the same. Bio-impedance and especially
body composition methods are considered to be more accurate methods of anthropometric
analysis due to their usage of electrical currents (Tewari et al., 2018). Bio-impedance
methods rely on the principle of electrical currents which relay tissue composition values as
per the measurement of voltage values. Such principles result in measurement of muscle and
fat tissue distribution with greater accuracy hence resulting in different results obtained from
bio-impedance measures (Fosbøl & Zerahn, 2015). Body composition methods utilise similar
principles of functioning but displays greater accuracy due its requirement of suitable
laboratory arrangements for adequate working. This can be observed in body composition
methods which use Bio Stat equipment to produce comprehensive and detailed
anthropometric analytical calculations such as fat percentage, fat mass in kilograms, lean
muscle mass in kilograms, percentage of fluid level as per body mass, volume of total water
in the body and basal metabolic rate (BMR) – of which body values of body fat percentages
were recorded for comparative analysis (Lemos et al., 2016). Such comprehensive
technological usage can be reflected in the differential results obtained hence making body
composition methods a far more accurate procedure for anthropometric assessment.
The pie chart highlighted in Figure 2 highlighted the distribution of ‘healthy’ subjects
who were determined to be in possession of acceptable anthropometric characteristics as per
references ranges specified by each method. It was observed that waist-to-hip calculations
recorded maximum number of participants as ‘healthy’, followed by bio-impedance methods,
BMI values and lastly with body composition methods recording the least number of
participants to possess values within acceptable ranges. Such differences in reporting can be
based on the distinctive functioning and physical parameters measured by each of the above
methods (Borga et al., 2018).
Paraphrase This Document
Need a fresh take? Get an instant paraphrase of this document with our AI Paraphraser
10BODY COMPOSITION ANALYSIS PRACTICAL
Waist-to-hip ratios, due to their measurement of abdominal adiposity, are beneficial
for the prediction and diagnosis of metabolic disorders due to their association with
abdominal obesity. However such values do not calculate weight distribution as per an
individual’s height which predicts a person’s health as per his or her body mass present
within per square meter of his or her height (Baik et al., 2017). However, BMI does not
reflect the true composition of various tissues which add on to an individual’s weight. Hence,
in accordance to BMI, an individual with greater lean muscle mass may be reported as
overweight as compared to a ‘normal’ individual with greater adiposity (Ashwell & Gibson,
2016). This is where bio-impedance and body composition provides more accurate analysis
since these highlight detailed values of body fat distribution with the latter being more
comprehensive (Ravindranath et al., 2016).
Hence, health professionals must consider usage of multiple methods rather than just
one, since each method produces different results due their differential functioning principles
and hence, a collaborative approach will provide improved assessment, screening, diagnosis,
treatment and positive health outcomes (Kyle et al., 2015). However, body composition
methods may not be cost effective and feasible due to laboratory usage and hence, future
research is needed to formulate comprehensive yet feasible anthropometric procedures for
individuals belonging to remote areas or underprivileged economic groups (Agguire et al.,
2015).
This study presented key limitations in terms of small sample size, incomplete values,
and comparative measurement of only body fat percentages and lack of considerations of
subjects with unique clinical conditions or age groups. Future improved research is required
with greater sample size and wider participant characteristics to correct such limitations
(Queirós, Faria & Almeida, 2017).
11BODY COMPOSITION ANALYSIS PRACTICAL
Conclusion
Hence, it can be concluded that the above study provided a detailed comparison on
the body composition analysis results obtained from various methods. It can be summarised
that body composition methods using Body Stat produced more detailed and accurate
analysis as compared to BMI, bio-impedance and waist-to-hip ratios. Hence, future clinical
professionals must considered incorporation of multiple techniques in order to obtained
accurate anthropometric and body composition results. However, cost effectiveness must also
be considered to ensure healthcare equity.
⊘ This is a preview!⊘
Do you want full access?
Subscribe today to unlock all pages.
Trusted by 1+ million students worldwide
1 out of 16
Related Documents


Your All-in-One AI-Powered Toolkit for Academic Success.
+13062052269
info@desklib.com
Available 24*7 on WhatsApp / Email
![[object Object]](/_next/static/media/star-bottom.7253800d.svg)
Unlock your academic potential
Copyright © 2020–2026 A2Z Services. All Rights Reserved. Developed and managed by ZUCOL.