Strategic Analysis of Boeing: Financial and Internal Analysis
VerifiedAdded on 2020/05/28
|22
|3288
|46
Report
AI Summary
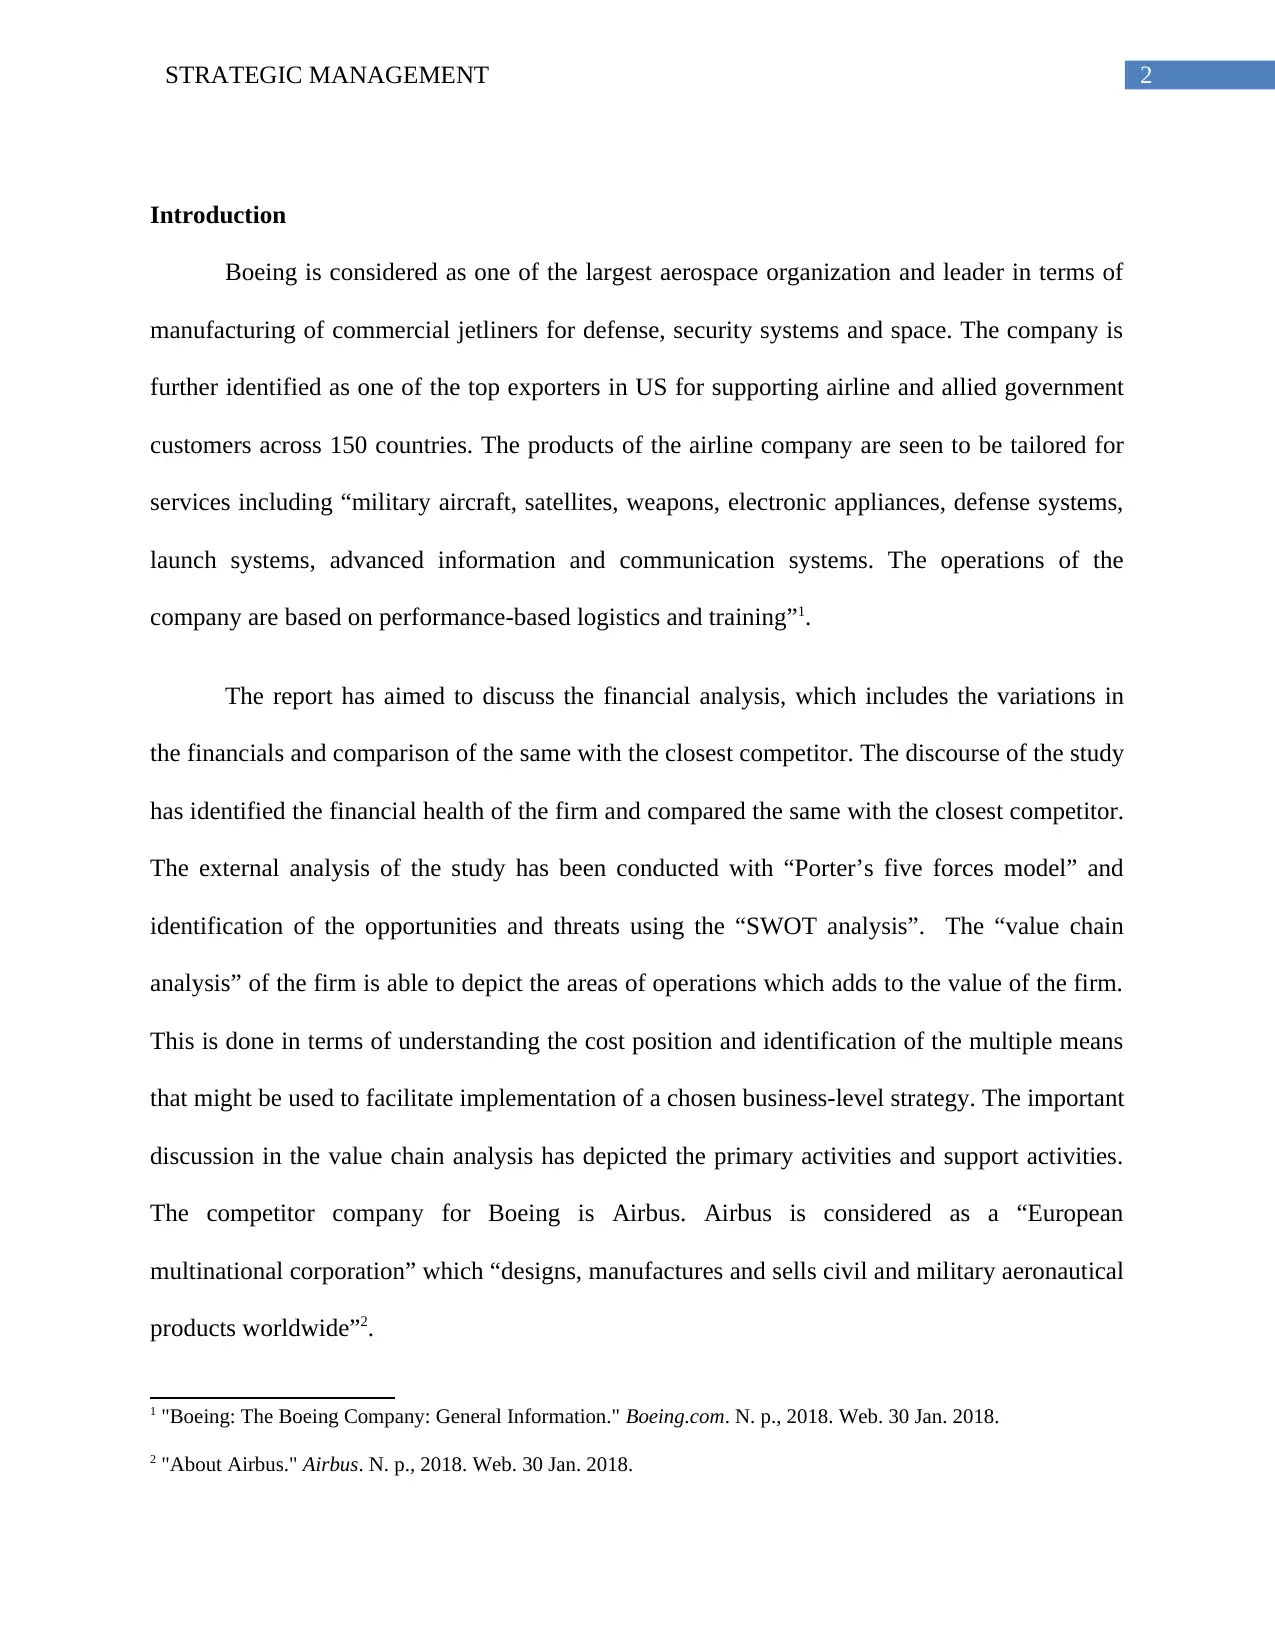
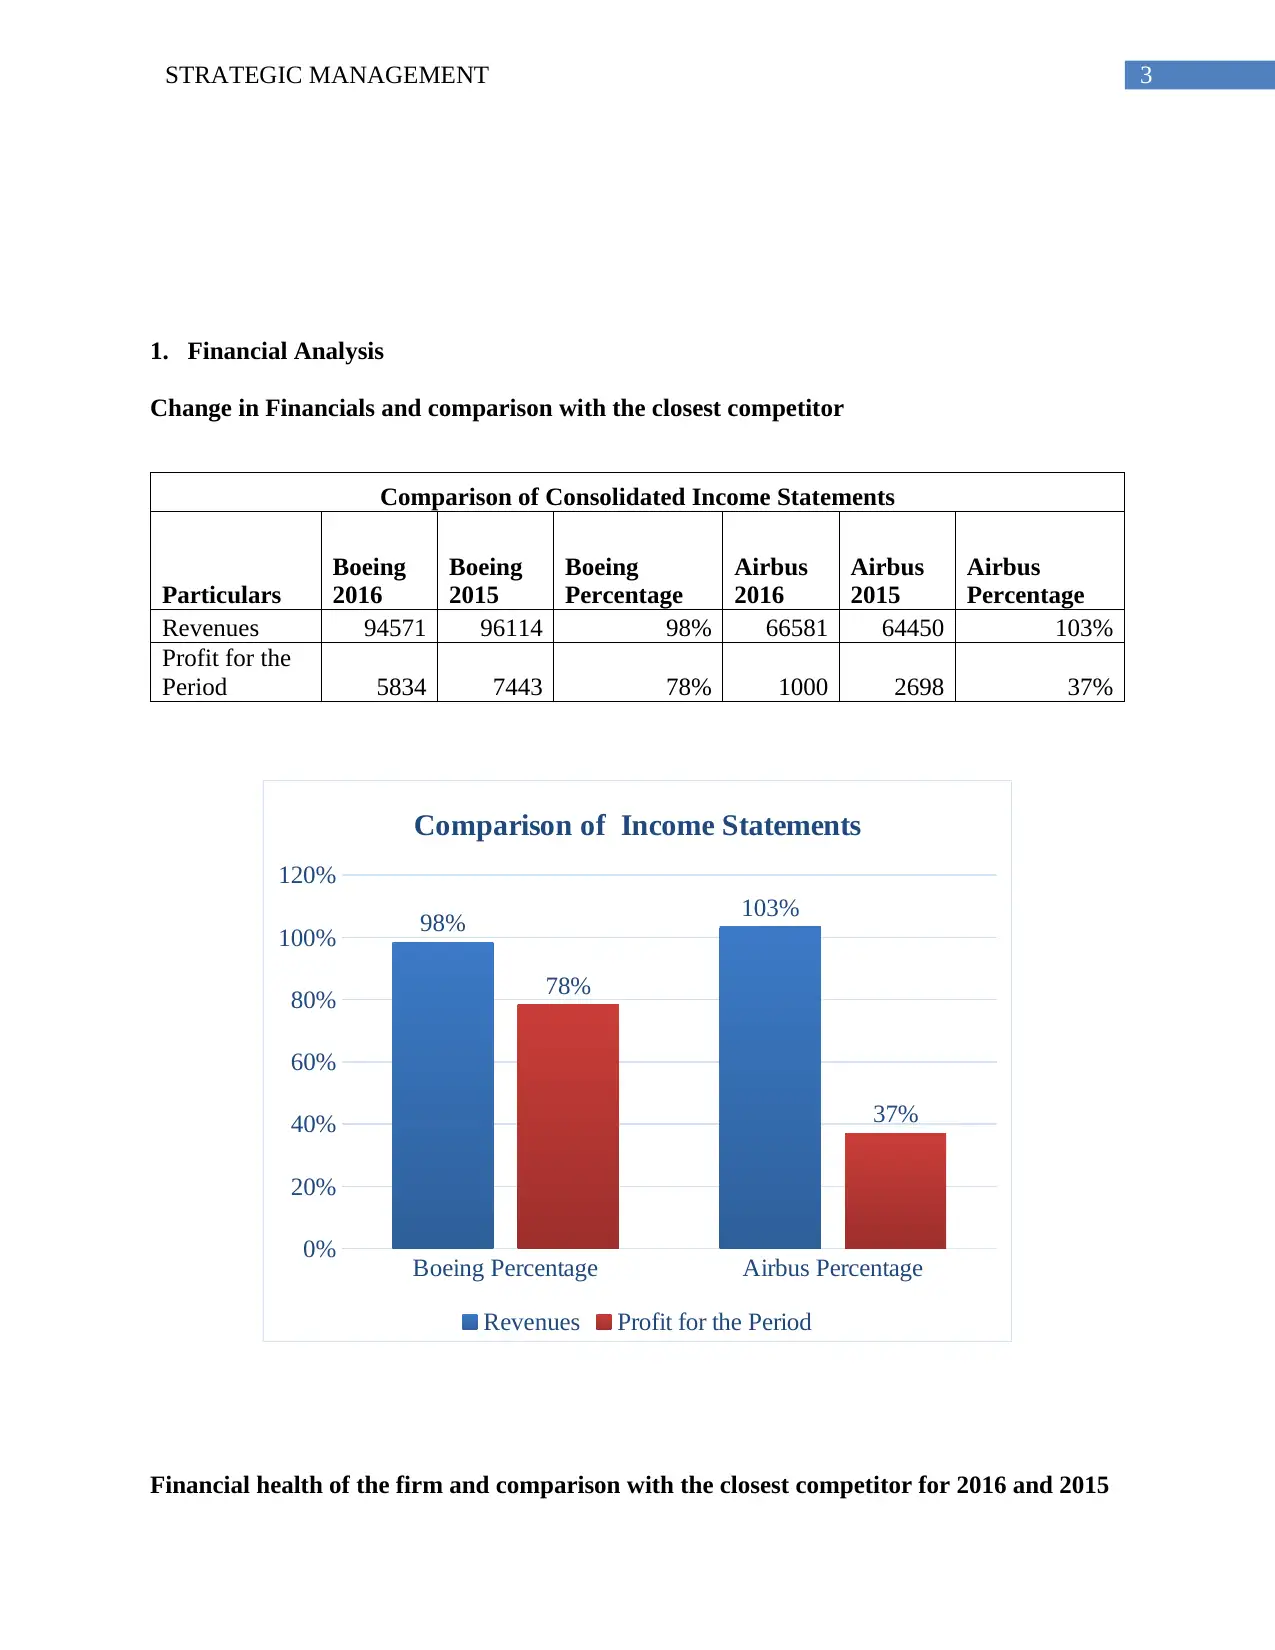
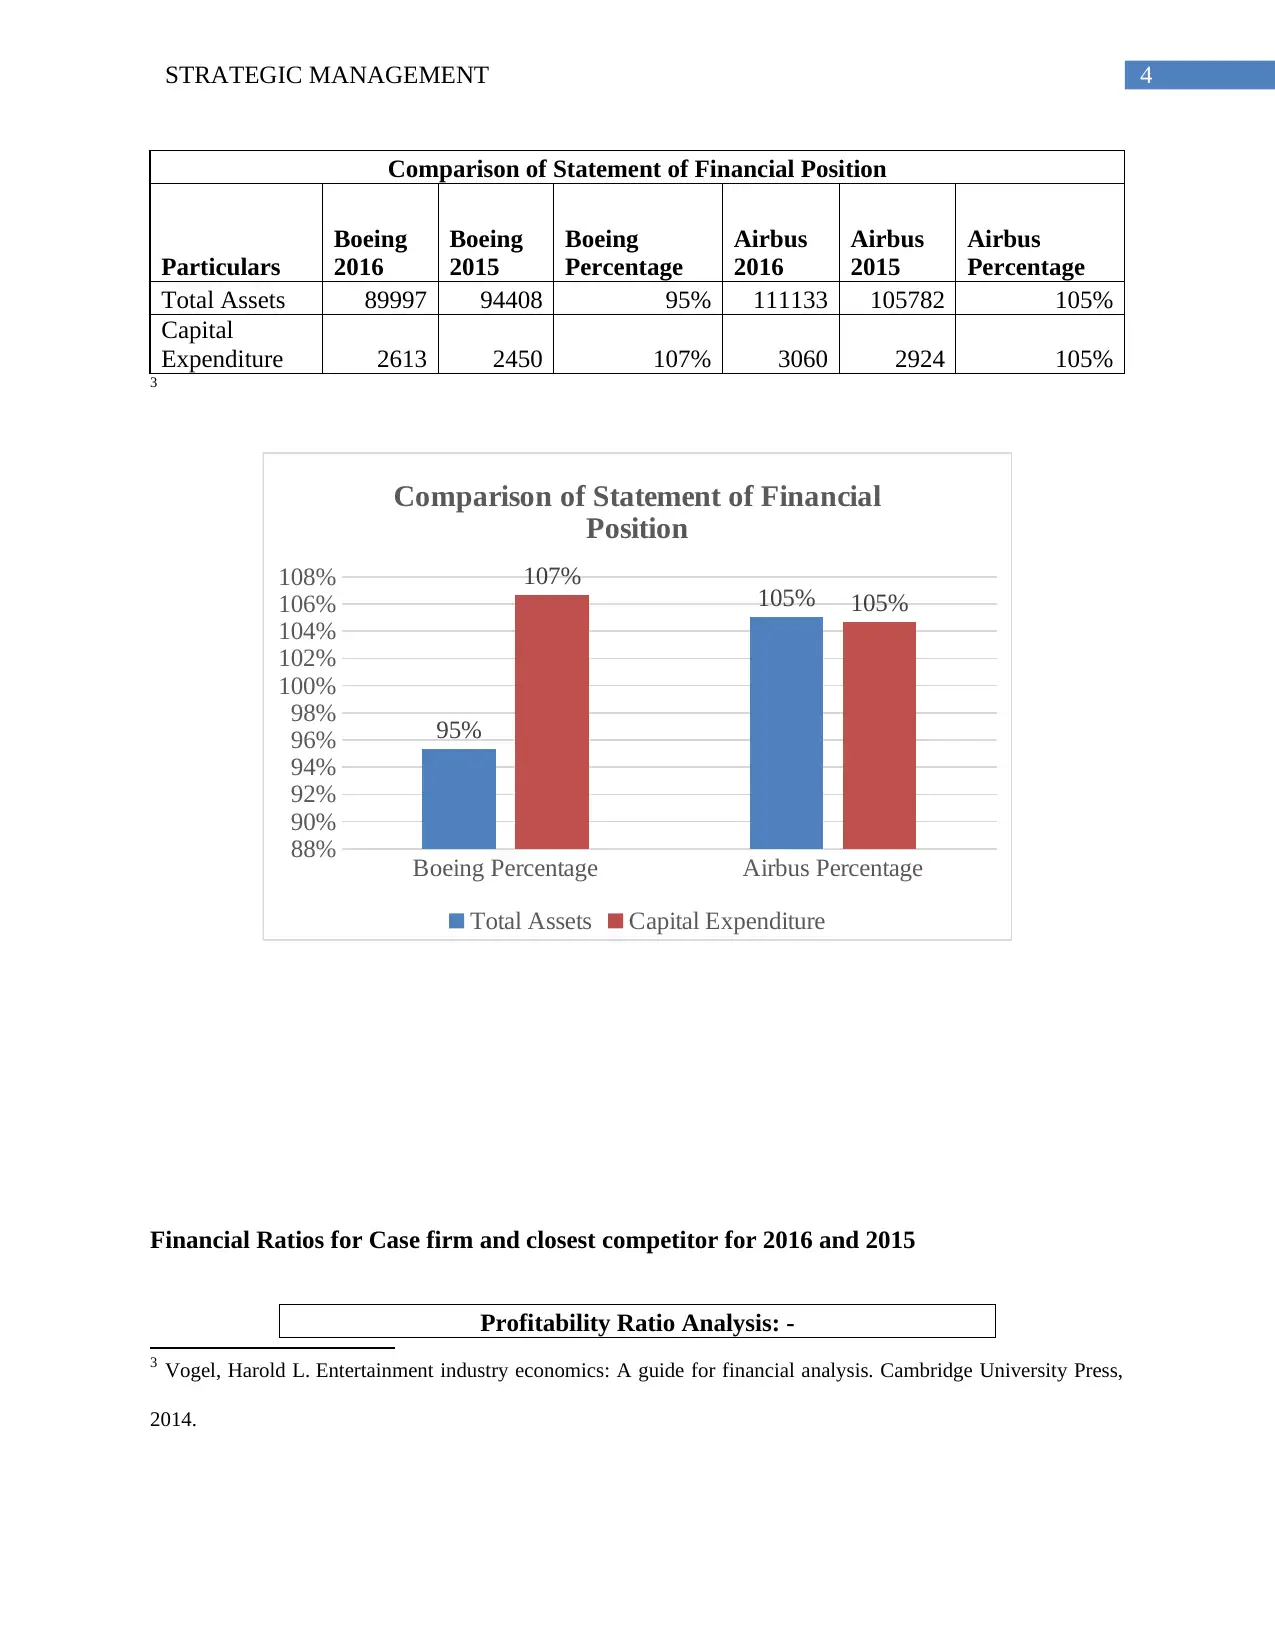
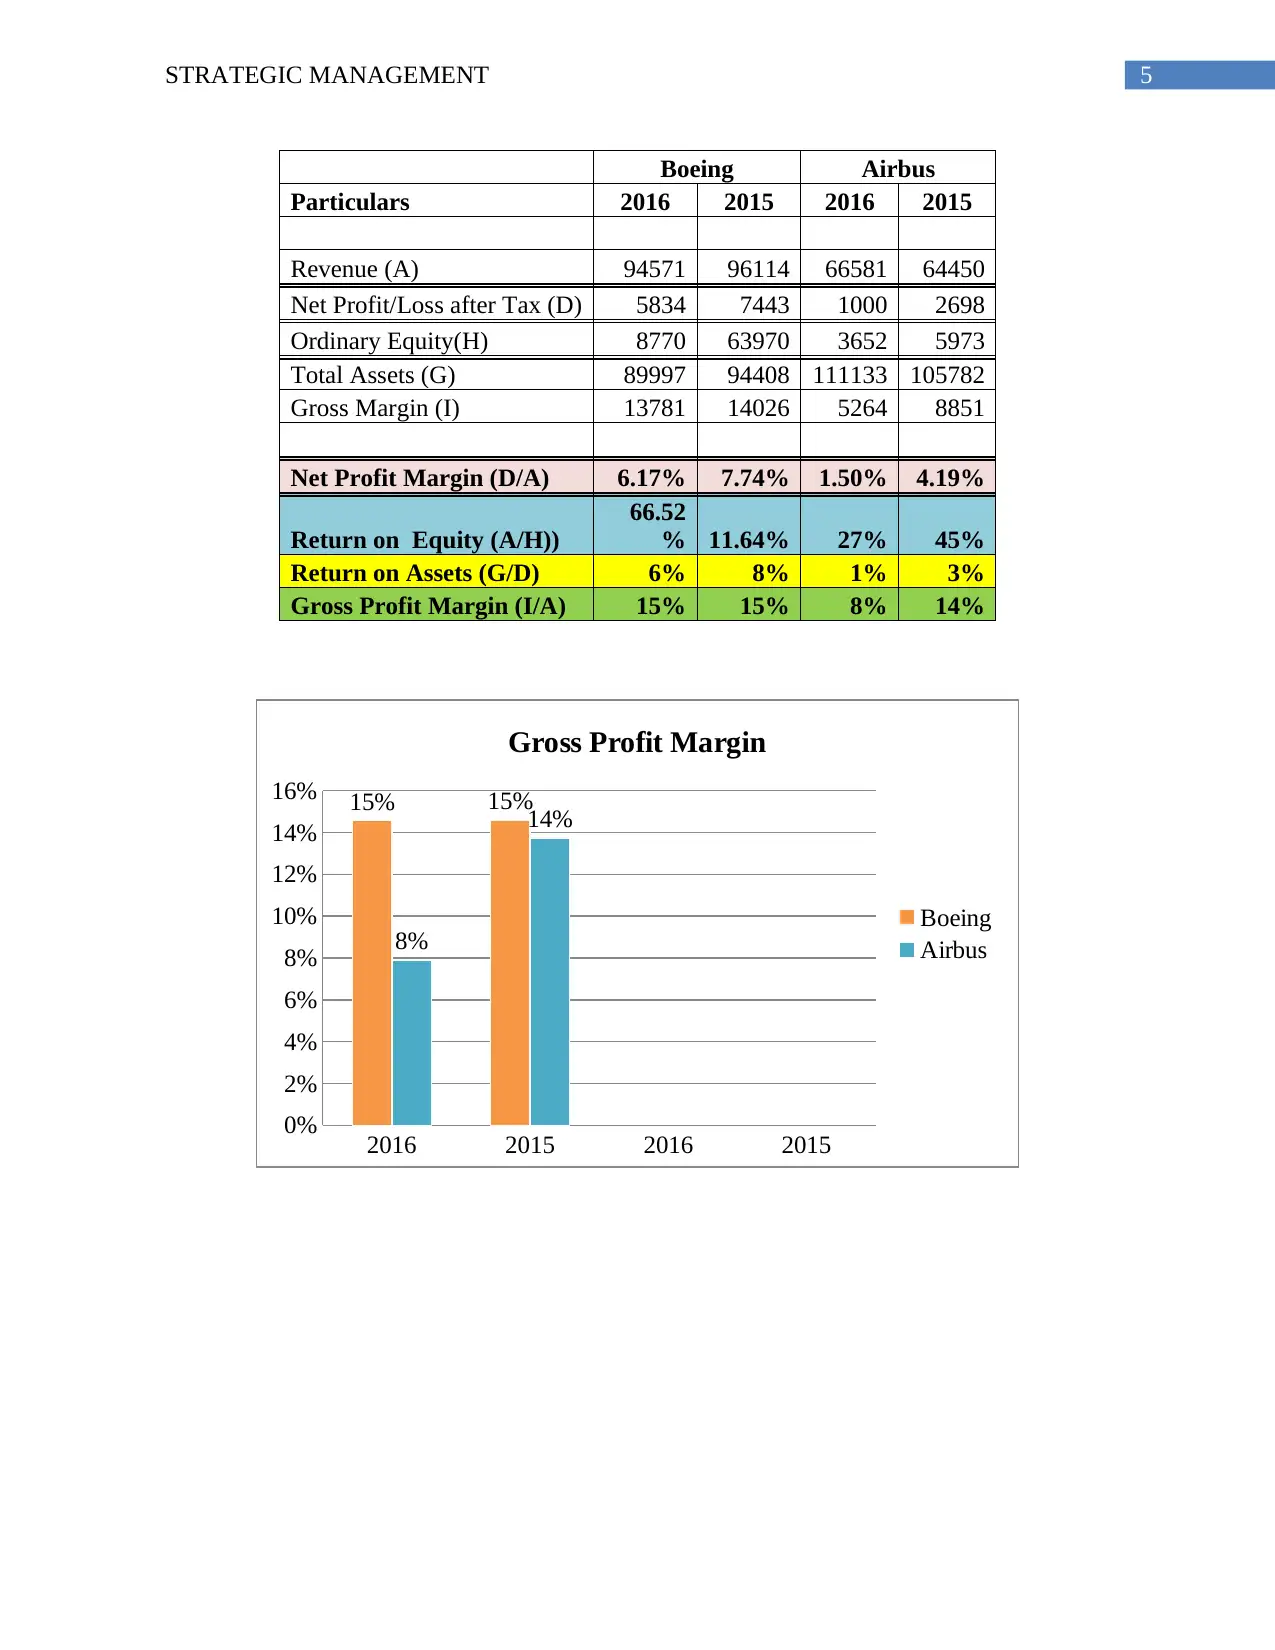
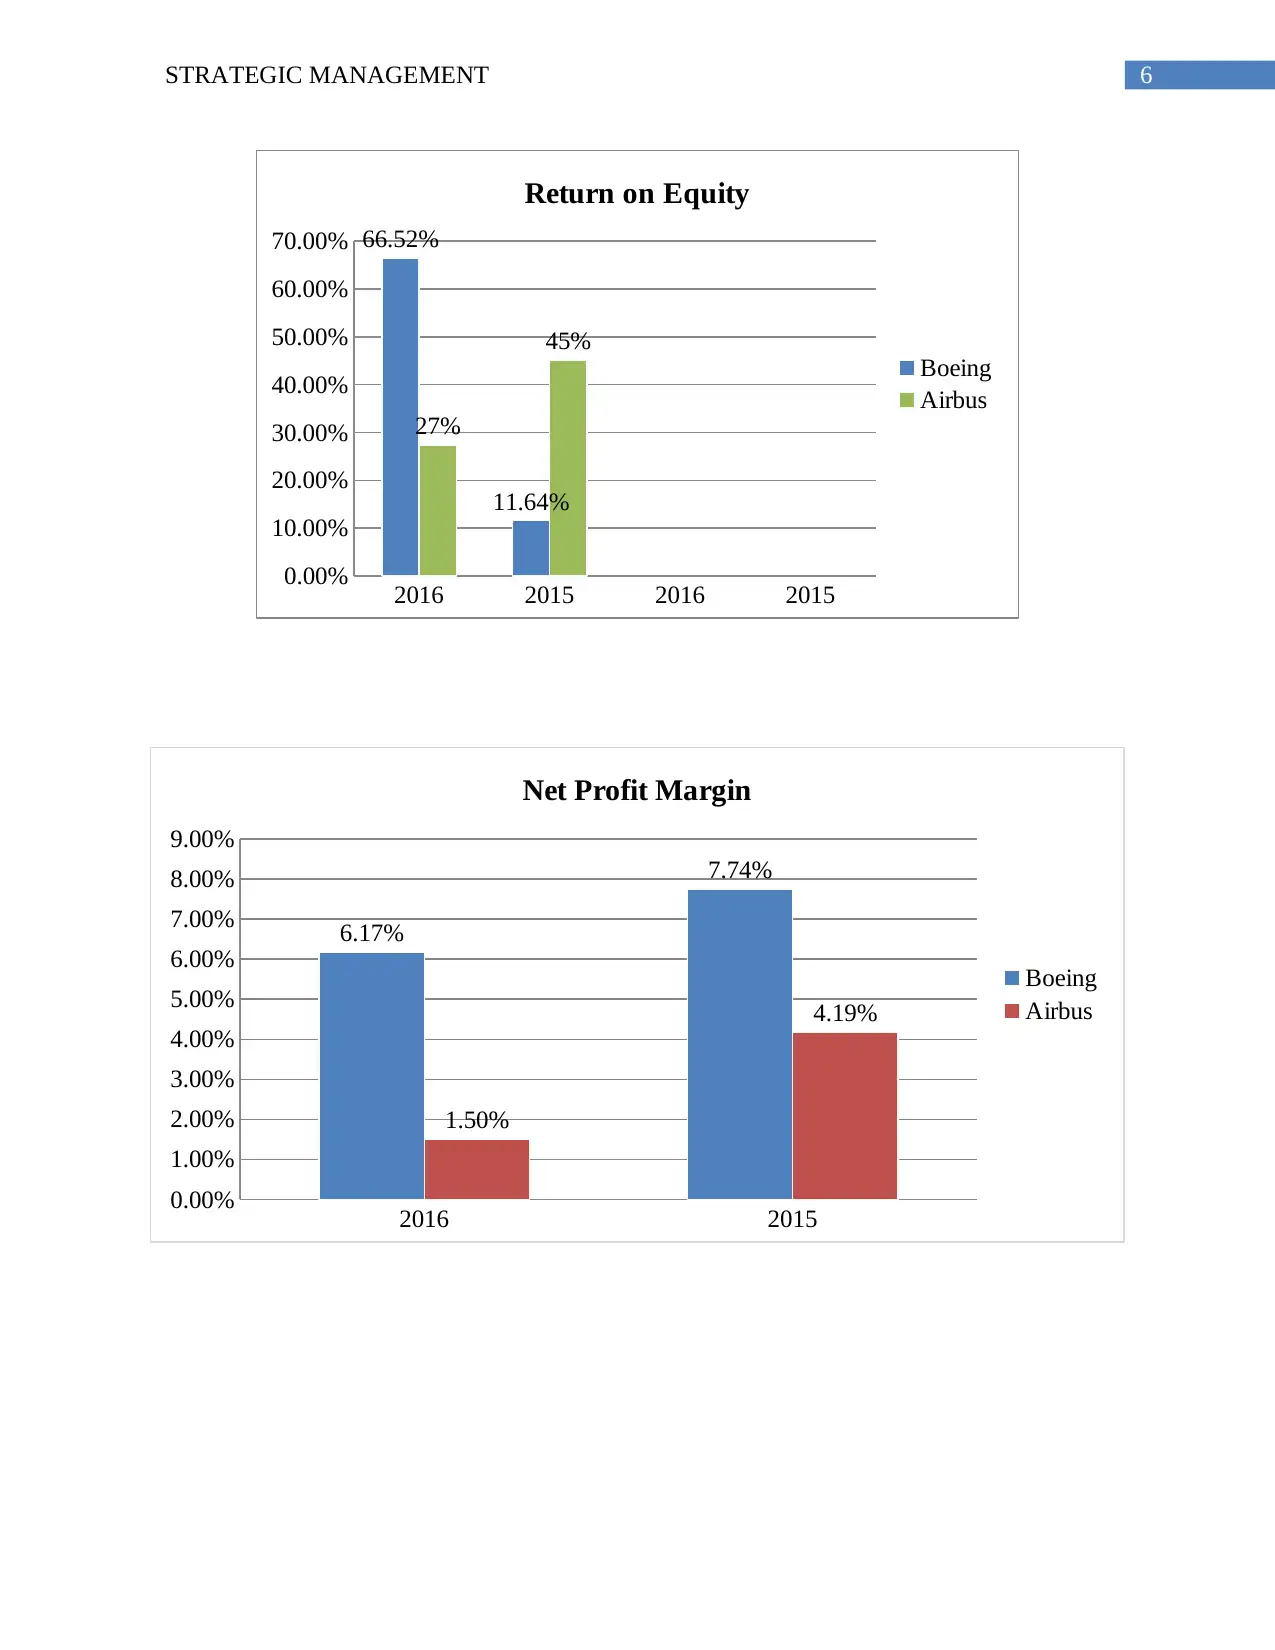
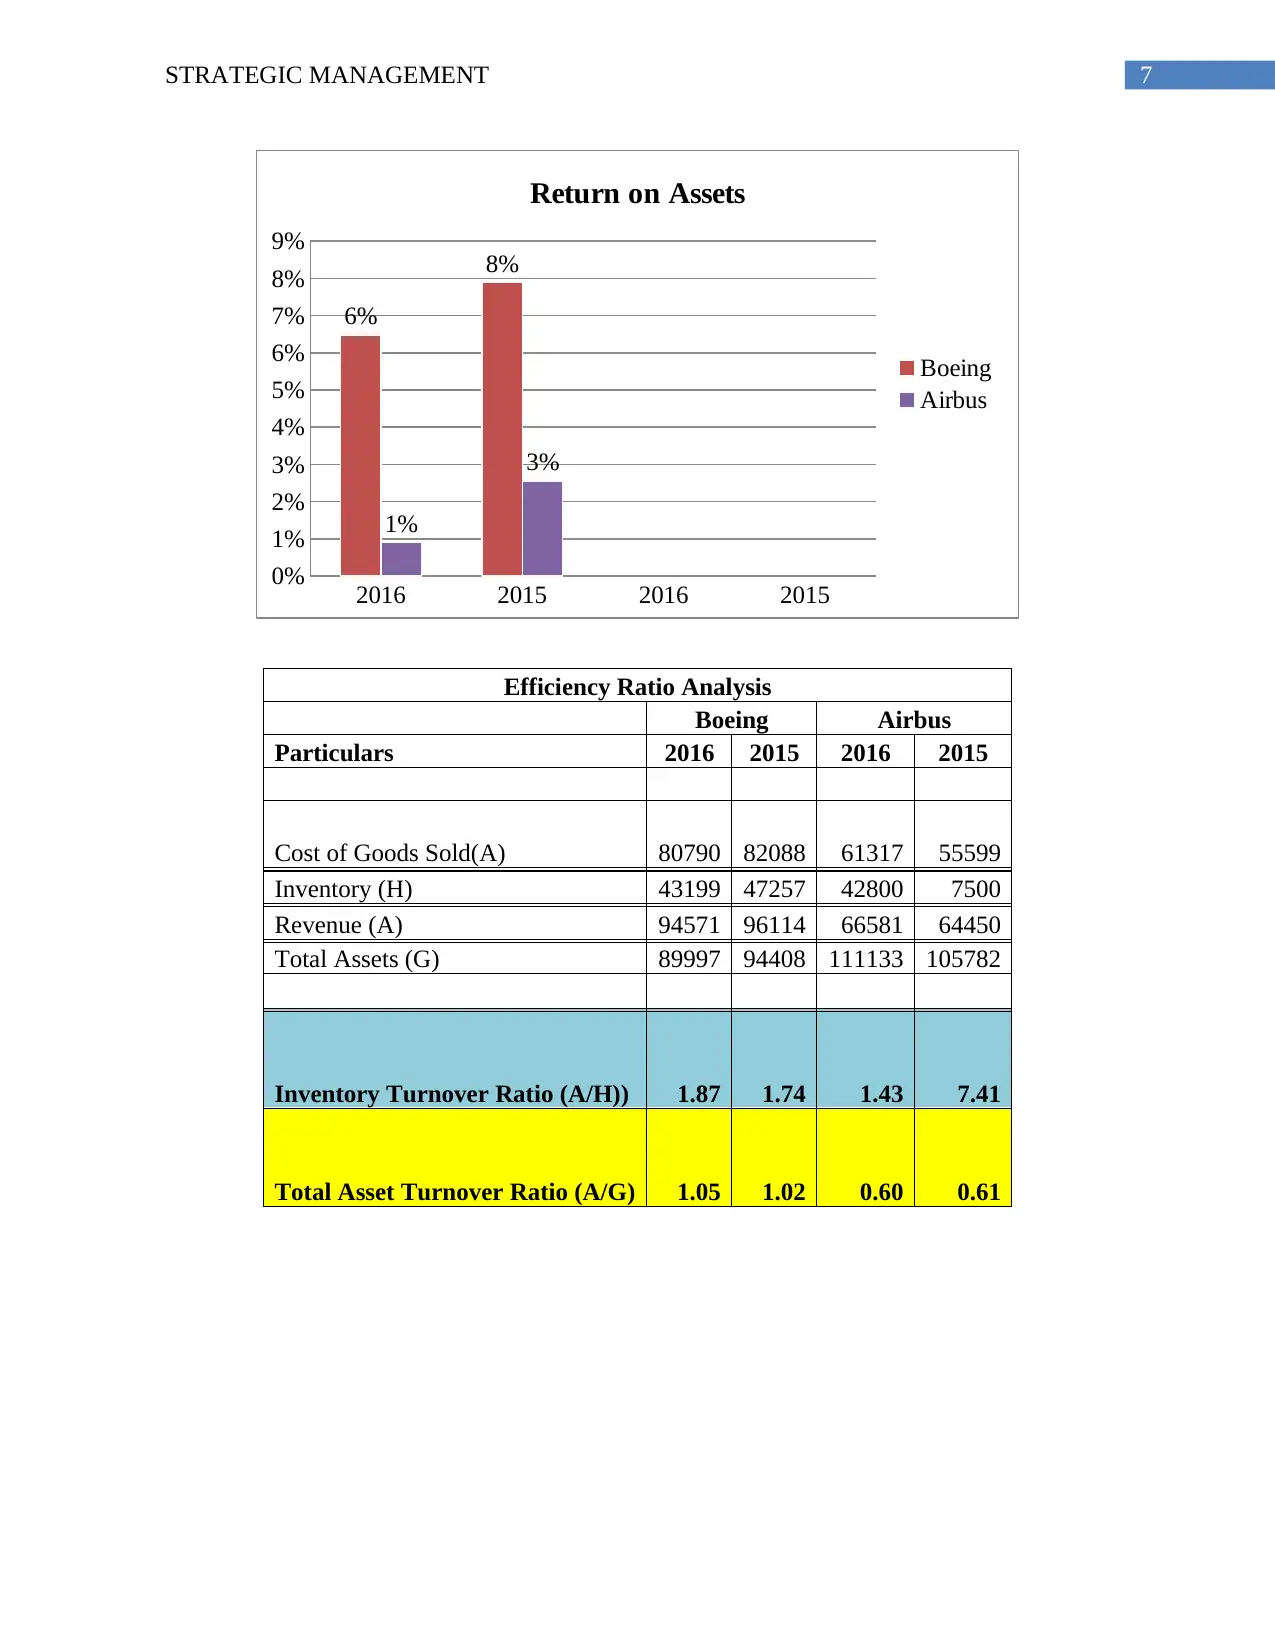
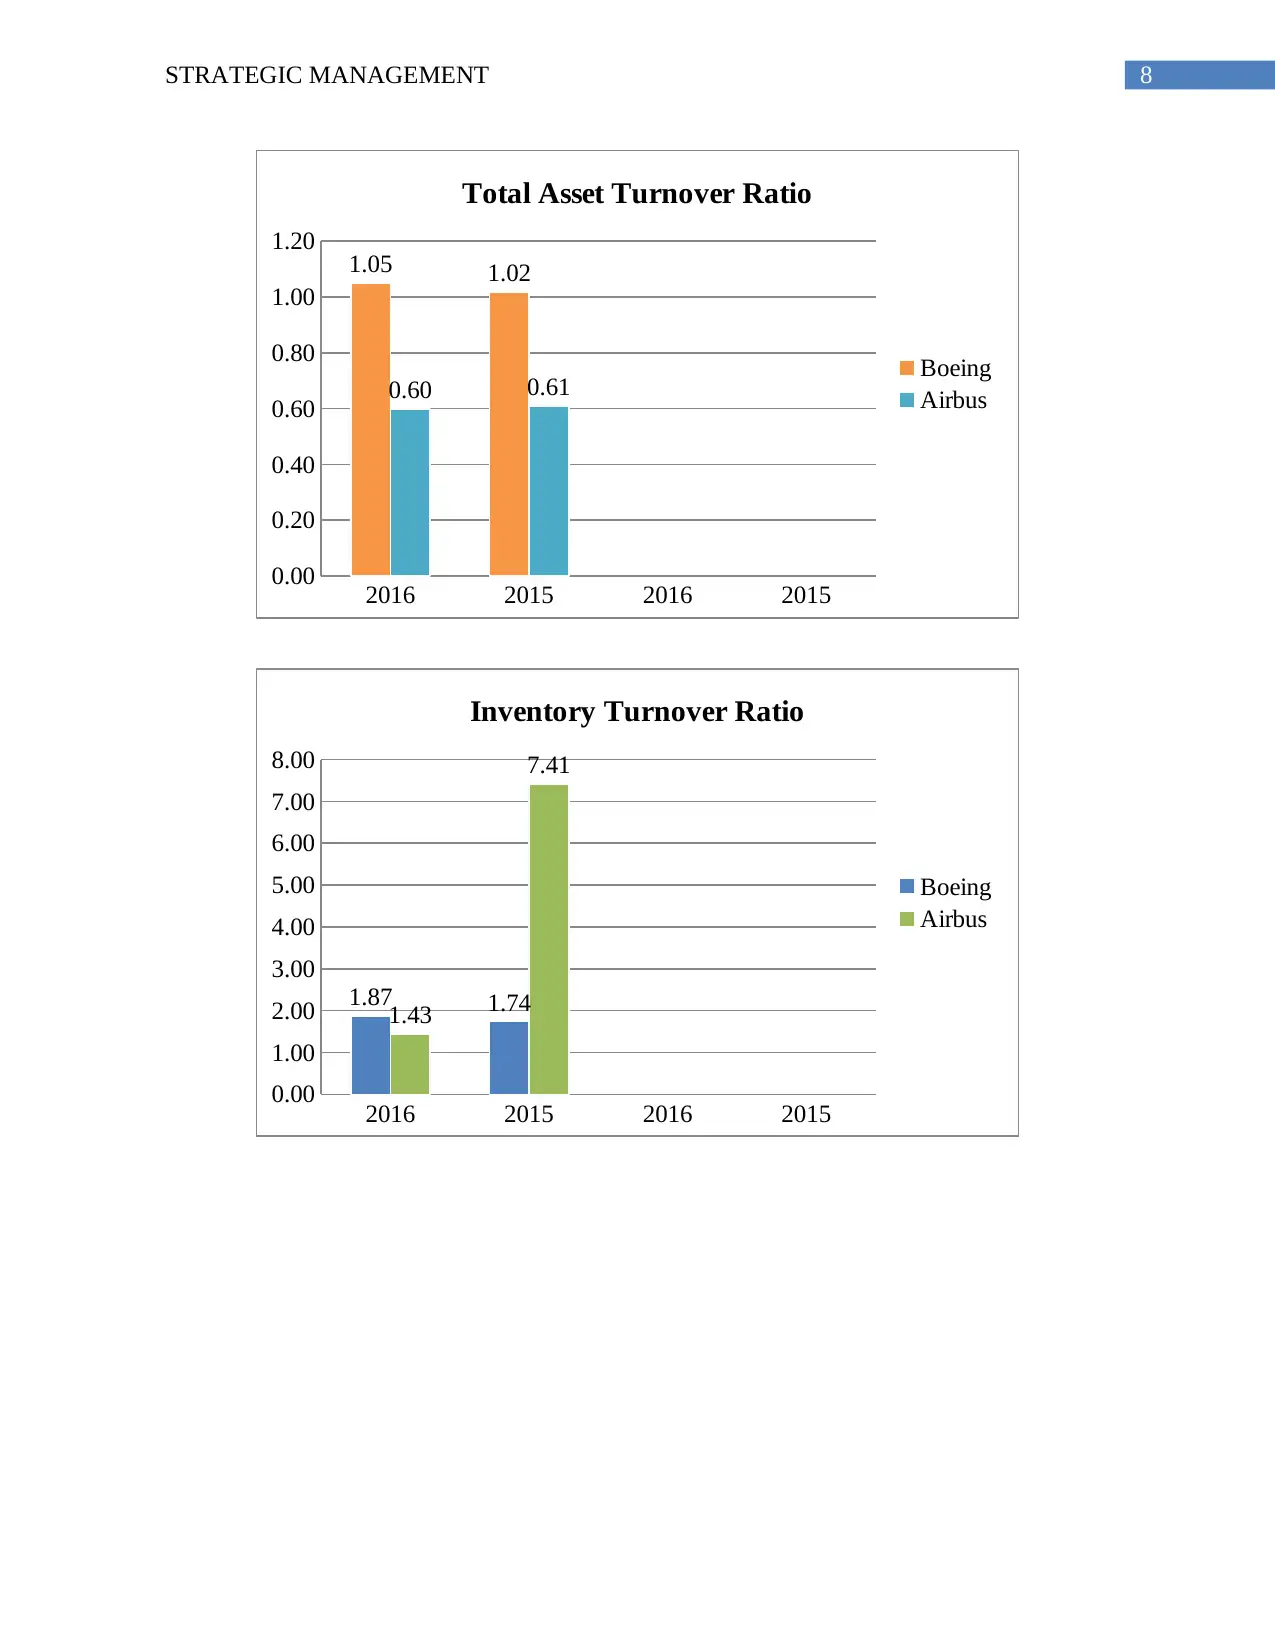
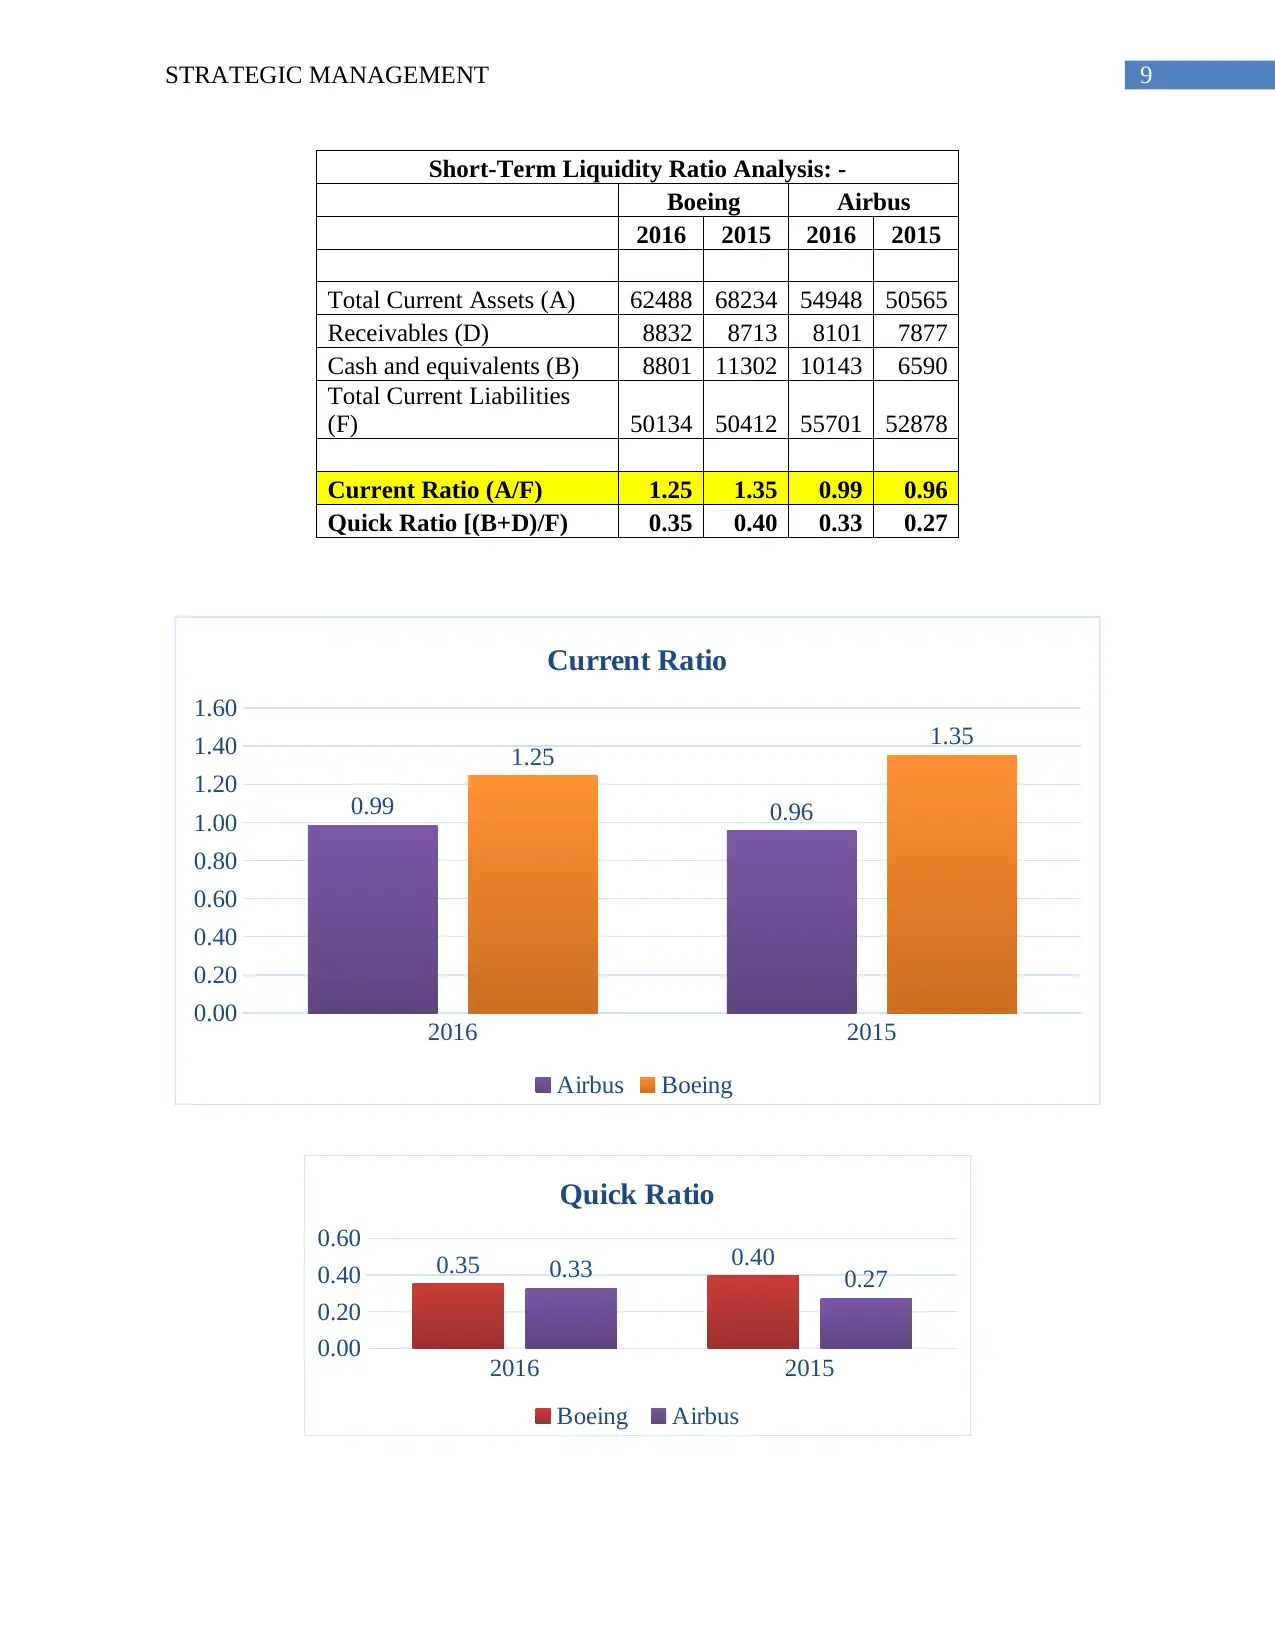
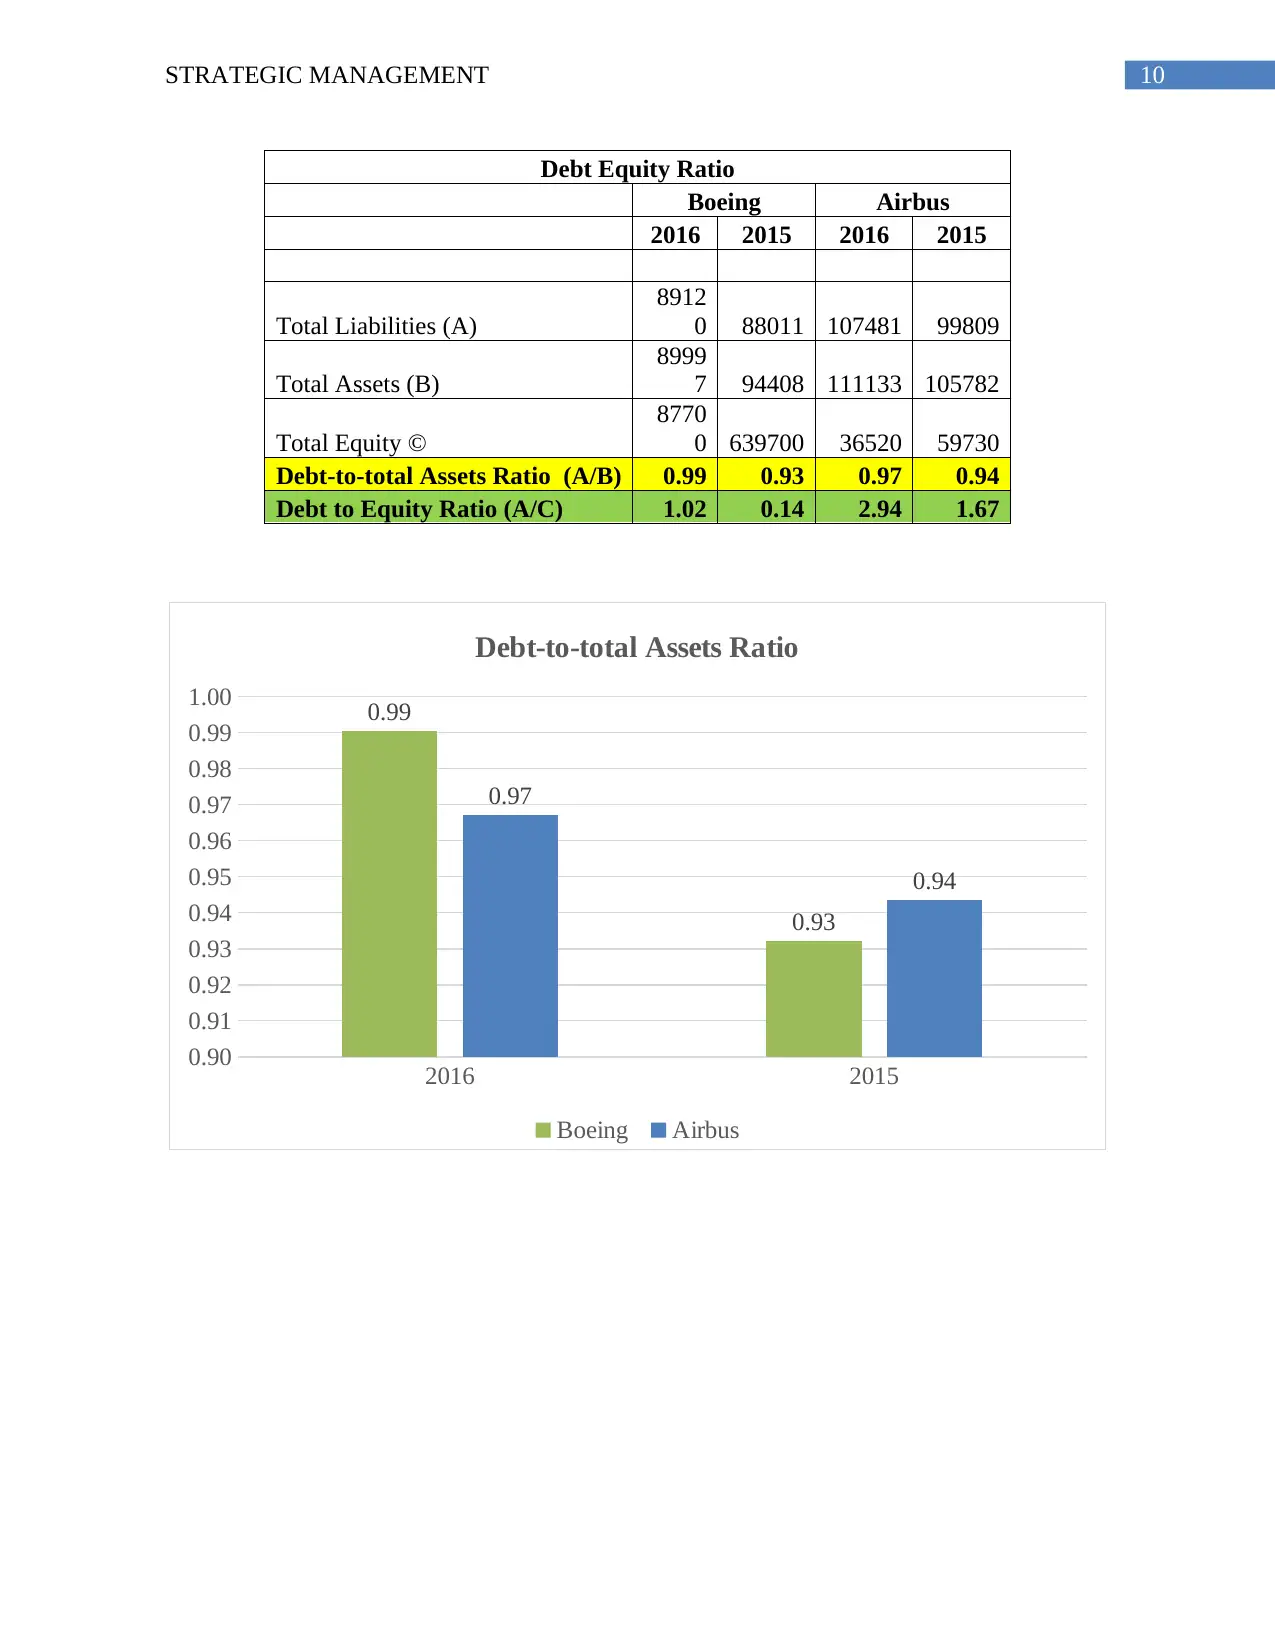
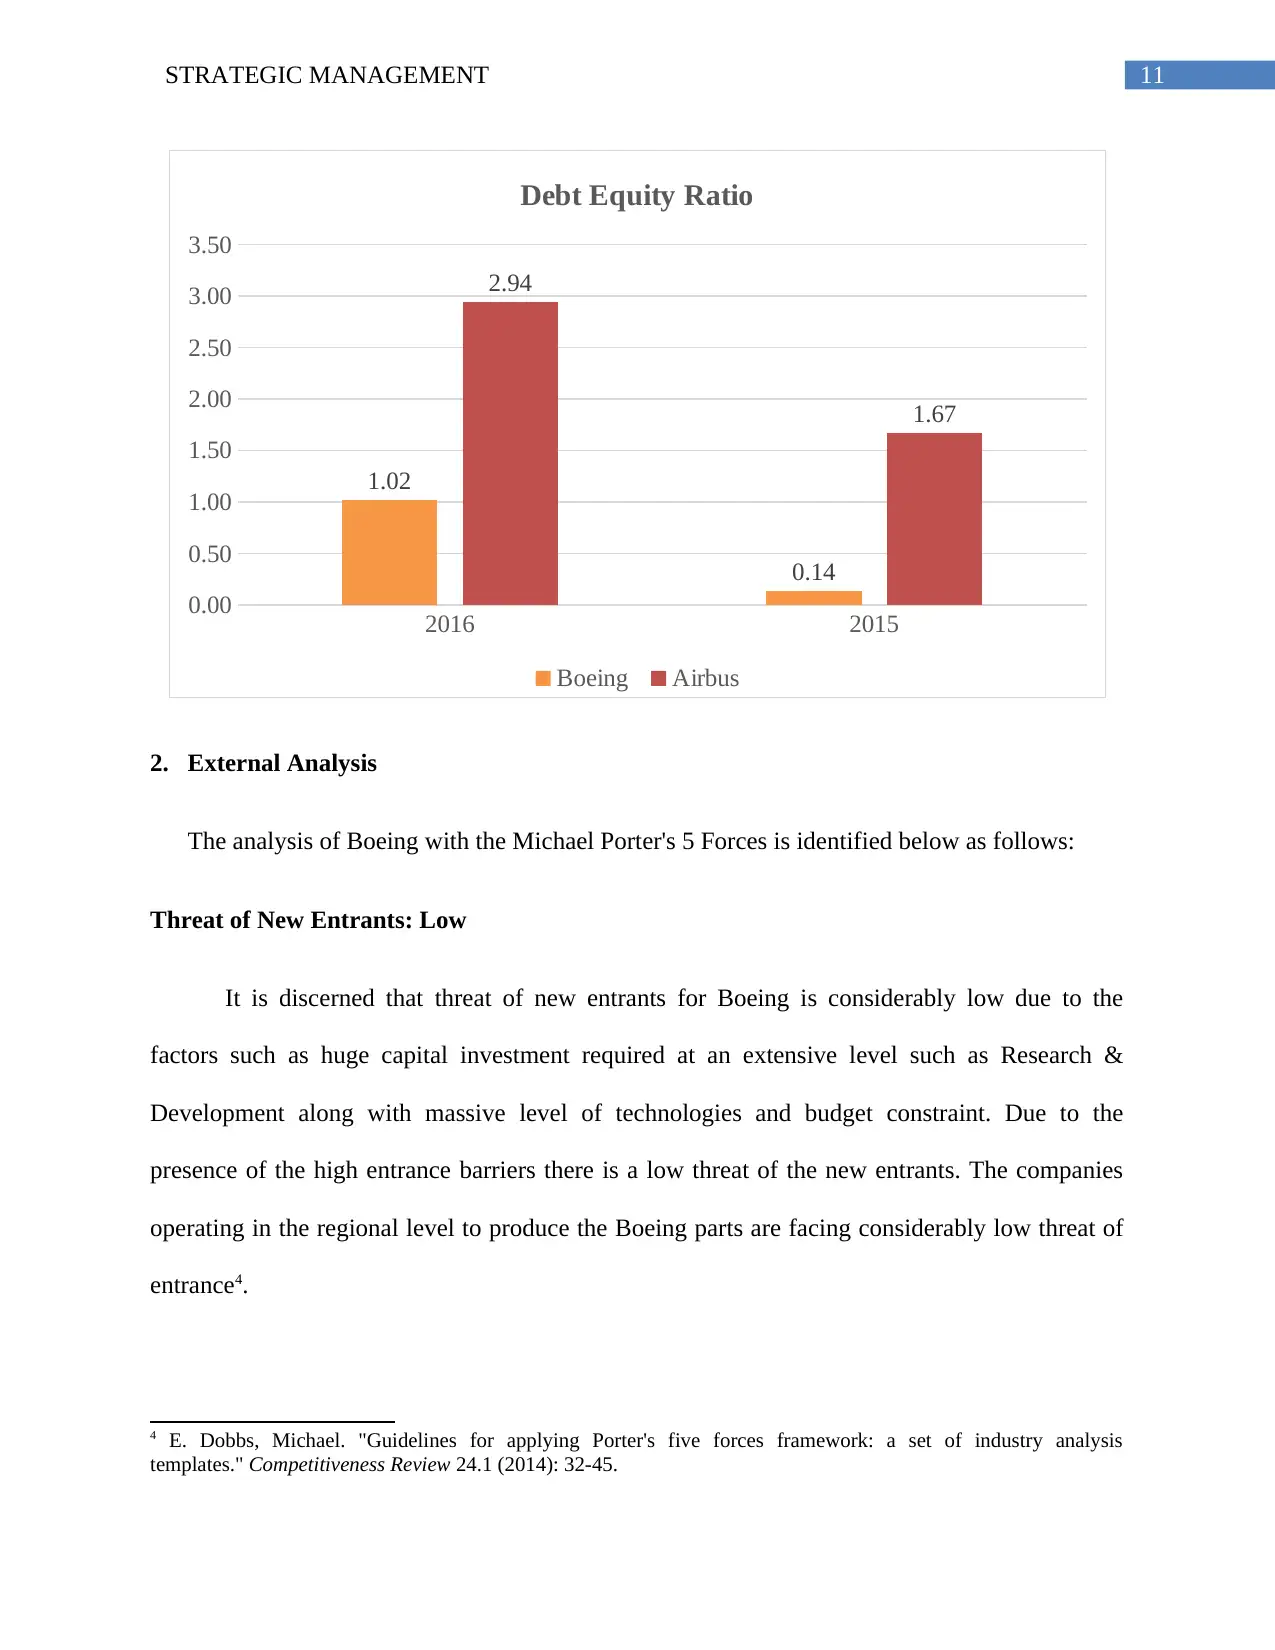
This report provides a comprehensive strategic management analysis of Boeing, a leading aerospace company. It begins with a financial analysis, comparing Boeing's performance to its main competitor, Airbus, using income statements, statements of financial position, and various financial ratios. The external environment is assessed using Porter's Five Forces model, identifying opportunities and threats through a SWOT analysis. An internal analysis examines Boeing's strengths and weaknesses, followed by a value chain analysis that dissects primary and support activities. The report also identifies strategic problems faced by the firm. The analysis covers aspects like financial health, competitive rivalry, and the impact of market dynamics. The report highlights Boeing's operational efficiency, marketing strategies, and technological innovations. The document provides a detailed overview of the aerospace industry, including the challenges posed by new entrants, substitutes, and supplier power. The report concludes with recommendations based on the strategic assessment.

Running head: STRATEGIC MANAGEMENT
Strategic Management
Name of Student:
Name of University:
Author’s Note:
Strategic Management
Name of Student:
Name of University:
Author’s Note:
Paraphrase This Document
Need a fresh take? Get an instant paraphrase of this document with our AI Paraphraser

1STRATEGIC MANAGEMENT
Table of Contents
Introduction......................................................................................................................................2
1. Financial Analysis...................................................................................................................3
3. Internal analysis of the firm...................................................................................................14
4. Identification of the strategic problems that the firm is facing..............................................18
5. Recommendation...................................................................................................................18
Conclusion.....................................................................................................................................19
Reference List................................................................................................................................20
1.

2STRATEGIC MANAGEMENT
Introduction
Boeing is considered as one of the largest aerospace organization and leader in terms of
manufacturing of commercial jetliners for defense, security systems and space. The company is
further identified as one of the top exporters in US for supporting airline and allied government
customers across 150 countries. The products of the airline company are seen to be tailored for
services including “military aircraft, satellites, weapons, electronic appliances, defense systems,
launch systems, advanced information and communication systems. The operations of the
company are based on performance-based logistics and training”1.
The report has aimed to discuss the financial analysis, which includes the variations in
the financials and comparison of the same with the closest competitor. The discourse of the study
has identified the financial health of the firm and compared the same with the closest competitor.
The external analysis of the study has been conducted with “Porter’s five forces model” and
identification of the opportunities and threats using the “SWOT analysis”. The “value chain
analysis” of the firm is able to depict the areas of operations which adds to the value of the firm.
This is done in terms of understanding the cost position and identification of the multiple means
that might be used to facilitate implementation of a chosen business-level strategy. The important
discussion in the value chain analysis has depicted the primary activities and support activities.
The competitor company for Boeing is Airbus. Airbus is considered as a “European
multinational corporation” which “designs, manufactures and sells civil and military aeronautical
products worldwide”2.
1 "Boeing: The Boeing Company: General Information." Boeing.com. N. p., 2018. Web. 30 Jan. 2018.
2 "About Airbus." Airbus. N. p., 2018. Web. 30 Jan. 2018.
⊘ This is a preview!⊘
Do you want full access?
Subscribe today to unlock all pages.

Trusted by 1+ million students worldwide

3STRATEGIC MANAGEMENT
1. Financial Analysis
Change in Financials and comparison with the closest competitor
Comparison of Consolidated Income Statements
Particulars
Boeing
2016
Boeing
2015
Boeing
Percentage
Airbus
2016
Airbus
2015
Airbus
Percentage
Revenues 94571 96114 98% 66581 64450 103%
Profit for the
Period 5834 7443 78% 1000 2698 37%
Boeing Percentage Airbus Percentage
0%
20%
40%
60%
80%
100%
120%
98% 103%
78%
37%
Comparison of Income Statements
Revenues Profit for the Period
Financial health of the firm and comparison with the closest competitor for 2016 and 2015
Paraphrase This Document
Need a fresh take? Get an instant paraphrase of this document with our AI Paraphraser

4STRATEGIC MANAGEMENT
Comparison of Statement of Financial Position
Particulars
Boeing
2016
Boeing
2015
Boeing
Percentage
Airbus
2016
Airbus
2015
Airbus
Percentage
Total Assets 89997 94408 95% 111133 105782 105%
Capital
Expenditure 2613 2450 107% 3060 2924 105%
3
Boeing Percentage Airbus Percentage
88%
90%
92%
94%
96%
98%
100%
102%
104%
106%
108%
95%
105%
107%
105%
Comparison of Statement of Financial
Position
Total Assets Capital Expenditure
Financial Ratios for Case firm and closest competitor for 2016 and 2015
Profitability Ratio Analysis: -
3 Vogel, Harold L. Entertainment industry economics: A guide for financial analysis. Cambridge University Press,
2014.

5STRATEGIC MANAGEMENT
Boeing Airbus
Particulars 2016 2015 2016 2015
Revenue (A) 94571 96114 66581 64450
Net Profit/Loss after Tax (D) 5834 7443 1000 2698
Ordinary Equity(H) 8770 63970 3652 5973
Total Assets (G) 89997 94408 111133 105782
Gross Margin (I) 13781 14026 5264 8851
Net Profit Margin (D/A) 6.17% 7.74% 1.50% 4.19%
Return on Equity (A/H))
66.52
% 11.64% 27% 45%
Return on Assets (G/D) 6% 8% 1% 3%
Gross Profit Margin (I/A) 15% 15% 8% 14%
2016 2015 2016 2015
0%
2%
4%
6%
8%
10%
12%
14%
16% 15% 15%
8%
14%
Gross Profit Margin
Boeing
Airbus
⊘ This is a preview!⊘
Do you want full access?
Subscribe today to unlock all pages.

Trusted by 1+ million students worldwide

6STRATEGIC MANAGEMENT
2016 2015 2016 2015
0.00%
10.00%
20.00%
30.00%
40.00%
50.00%
60.00%
70.00% 66.52%
11.64%
27%
45%
Return on Equity
Boeing
Airbus
2016 2015
0.00%
1.00%
2.00%
3.00%
4.00%
5.00%
6.00%
7.00%
8.00%
9.00%
6.17%
7.74%
1.50%
4.19%
Net Profit Margin
Boeing
Airbus
2016 2015 2016 2015
0.00%
10.00%
20.00%
30.00%
40.00%
50.00%
60.00%
70.00% 66.52%
11.64%
27%
45%
Return on Equity
Boeing
Airbus
2016 2015
0.00%
1.00%
2.00%
3.00%
4.00%
5.00%
6.00%
7.00%
8.00%
9.00%
6.17%
7.74%
1.50%
4.19%
Net Profit Margin
Boeing
Airbus
Paraphrase This Document
Need a fresh take? Get an instant paraphrase of this document with our AI Paraphraser

7STRATEGIC MANAGEMENT
2016 2015 2016 2015
0%
1%
2%
3%
4%
5%
6%
7%
8%
9%
6%
8%
1%
3%
Return on Assets
Boeing
Airbus
Efficiency Ratio Analysis
Boeing Airbus
Particulars 2016 2015 2016 2015
Cost of Goods Sold(A) 80790 82088 61317 55599
Inventory (H) 43199 47257 42800 7500
Revenue (A) 94571 96114 66581 64450
Total Assets (G) 89997 94408 111133 105782
Inventory Turnover Ratio (A/H)) 1.87 1.74 1.43 7.41
Total Asset Turnover Ratio (A/G) 1.05 1.02 0.60 0.61

8STRATEGIC MANAGEMENT
2016 2015 2016 2015
0.00
0.20
0.40
0.60
0.80
1.00
1.20 1.05 1.02
0.60 0.61
Total Asset Turnover Ratio
Boeing
Airbus
2016 2015 2016 2015
0.00
1.00
2.00
3.00
4.00
5.00
6.00
7.00
8.00
1.87 1.74
1.43
7.41
Inventory Turnover Ratio
Boeing
Airbus
2016 2015 2016 2015
0.00
0.20
0.40
0.60
0.80
1.00
1.20 1.05 1.02
0.60 0.61
Total Asset Turnover Ratio
Boeing
Airbus
2016 2015 2016 2015
0.00
1.00
2.00
3.00
4.00
5.00
6.00
7.00
8.00
1.87 1.74
1.43
7.41
Inventory Turnover Ratio
Boeing
Airbus
⊘ This is a preview!⊘
Do you want full access?
Subscribe today to unlock all pages.

Trusted by 1+ million students worldwide

9STRATEGIC MANAGEMENT
Short-Term Liquidity Ratio Analysis: -
Boeing Airbus
2016 2015 2016 2015
Total Current Assets (A) 62488 68234 54948 50565
Receivables (D) 8832 8713 8101 7877
Cash and equivalents (B) 8801 11302 10143 6590
Total Current Liabilities
(F) 50134 50412 55701 52878
Current Ratio (A/F) 1.25 1.35 0.99 0.96
Quick Ratio [(B+D)/F) 0.35 0.40 0.33 0.27
2016 2015
0.00
0.20
0.40
0.60
0.80
1.00
1.20
1.40
1.60
0.99 0.96
1.25 1.35
Current Ratio
Airbus Boeing
2016 2015
0.00
0.20
0.40
0.60
0.35 0.40
0.33 0.27
Quick Ratio
Boeing Airbus
Paraphrase This Document
Need a fresh take? Get an instant paraphrase of this document with our AI Paraphraser

10STRATEGIC MANAGEMENT
Debt Equity Ratio
Boeing Airbus
2016 2015 2016 2015
Total Liabilities (A)
8912
0 88011 107481 99809
Total Assets (B)
8999
7 94408 111133 105782
Total Equity ©
8770
0 639700 36520 59730
Debt-to-total Assets Ratio (A/B) 0.99 0.93 0.97 0.94
Debt to Equity Ratio (A/C) 1.02 0.14 2.94 1.67
2016 2015
0.90
0.91
0.92
0.93
0.94
0.95
0.96
0.97
0.98
0.99
1.00 0.99
0.93
0.97
0.94
Debt-to-total Assets Ratio
Boeing Airbus

11STRATEGIC MANAGEMENT
2016 2015
0.00
0.50
1.00
1.50
2.00
2.50
3.00
3.50
1.02
0.14
2.94
1.67
Debt Equity Ratio
Boeing Airbus
2. External Analysis
The analysis of Boeing with the Michael Porter's 5 Forces is identified below as follows:
Threat of New Entrants: Low
It is discerned that threat of new entrants for Boeing is considerably low due to the
factors such as huge capital investment required at an extensive level such as Research &
Development along with massive level of technologies and budget constraint. Due to the
presence of the high entrance barriers there is a low threat of the new entrants. The companies
operating in the regional level to produce the Boeing parts are facing considerably low threat of
entrance4.
4 E. Dobbs, Michael. "Guidelines for applying Porter's five forces framework: a set of industry analysis
templates." Competitiveness Review 24.1 (2014): 32-45.
⊘ This is a preview!⊘
Do you want full access?
Subscribe today to unlock all pages.

Trusted by 1+ million students worldwide
1 out of 22
Related Documents

Your All-in-One AI-Powered Toolkit for Academic Success.
+13062052269
info@desklib.com
Available 24*7 on WhatsApp / Email
Unlock your academic potential
Copyright © 2020–2025 A2Z Services. All Rights Reserved. Developed and managed by ZUCOL.