Investment Analysis and Portfolio Management: Bond Valuation Analysis

Verified

Added on Ā 2023/06/15

|13
|2119
|314
Report
AI Summary
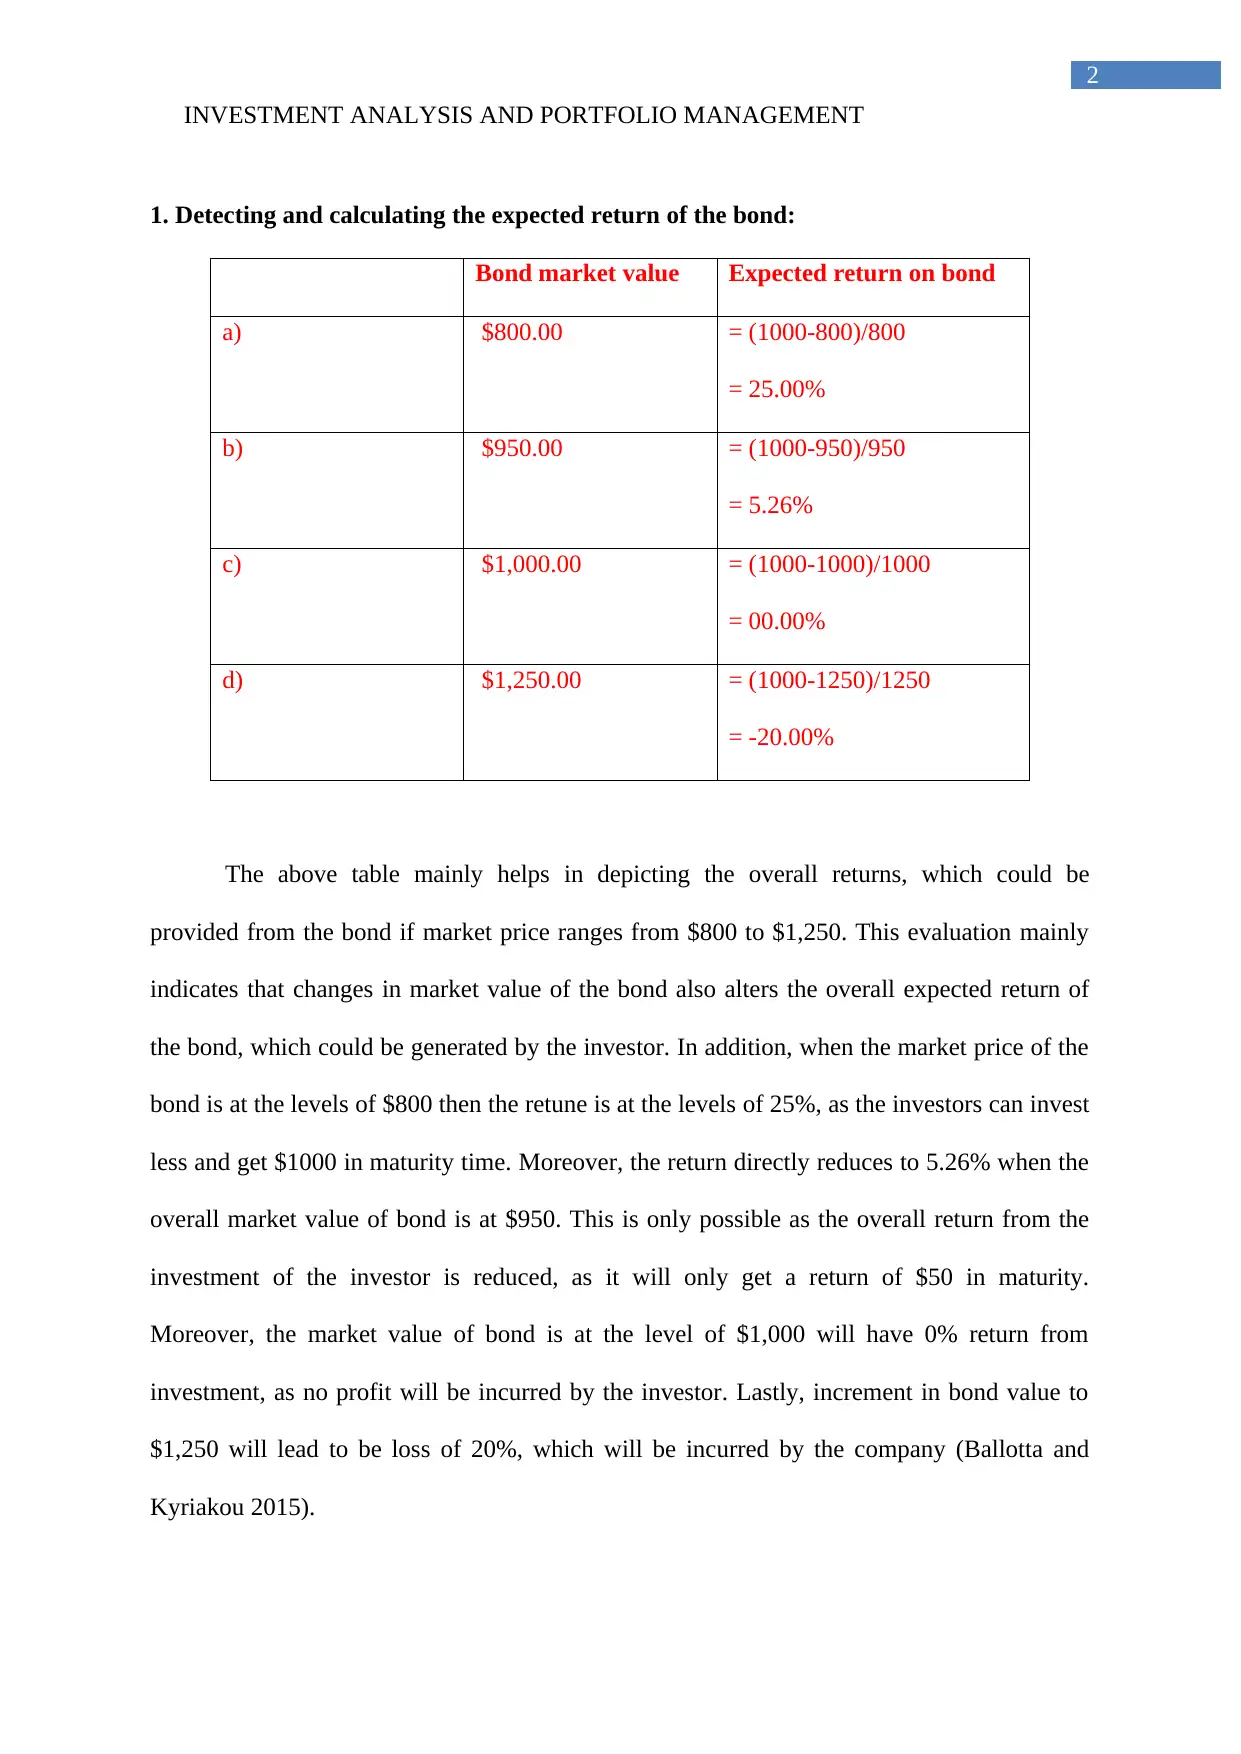
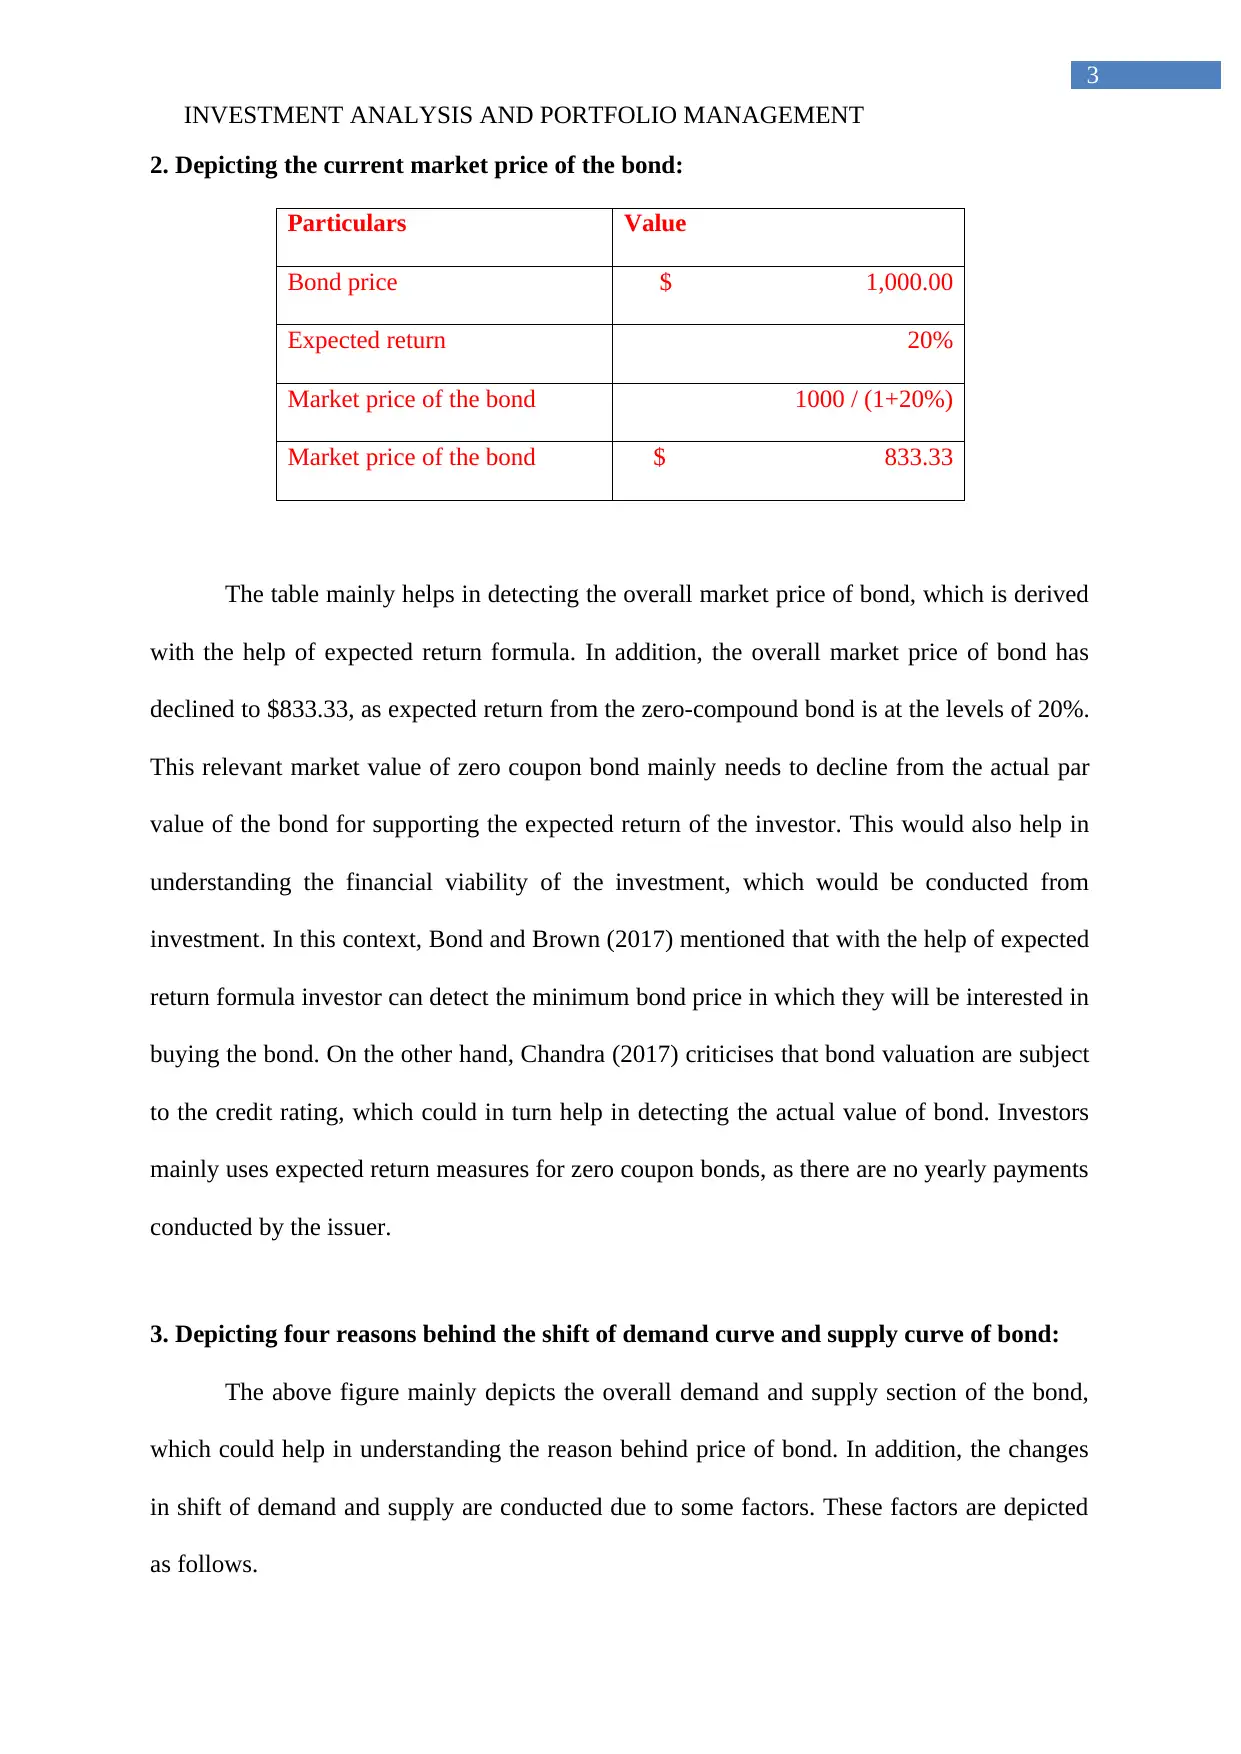
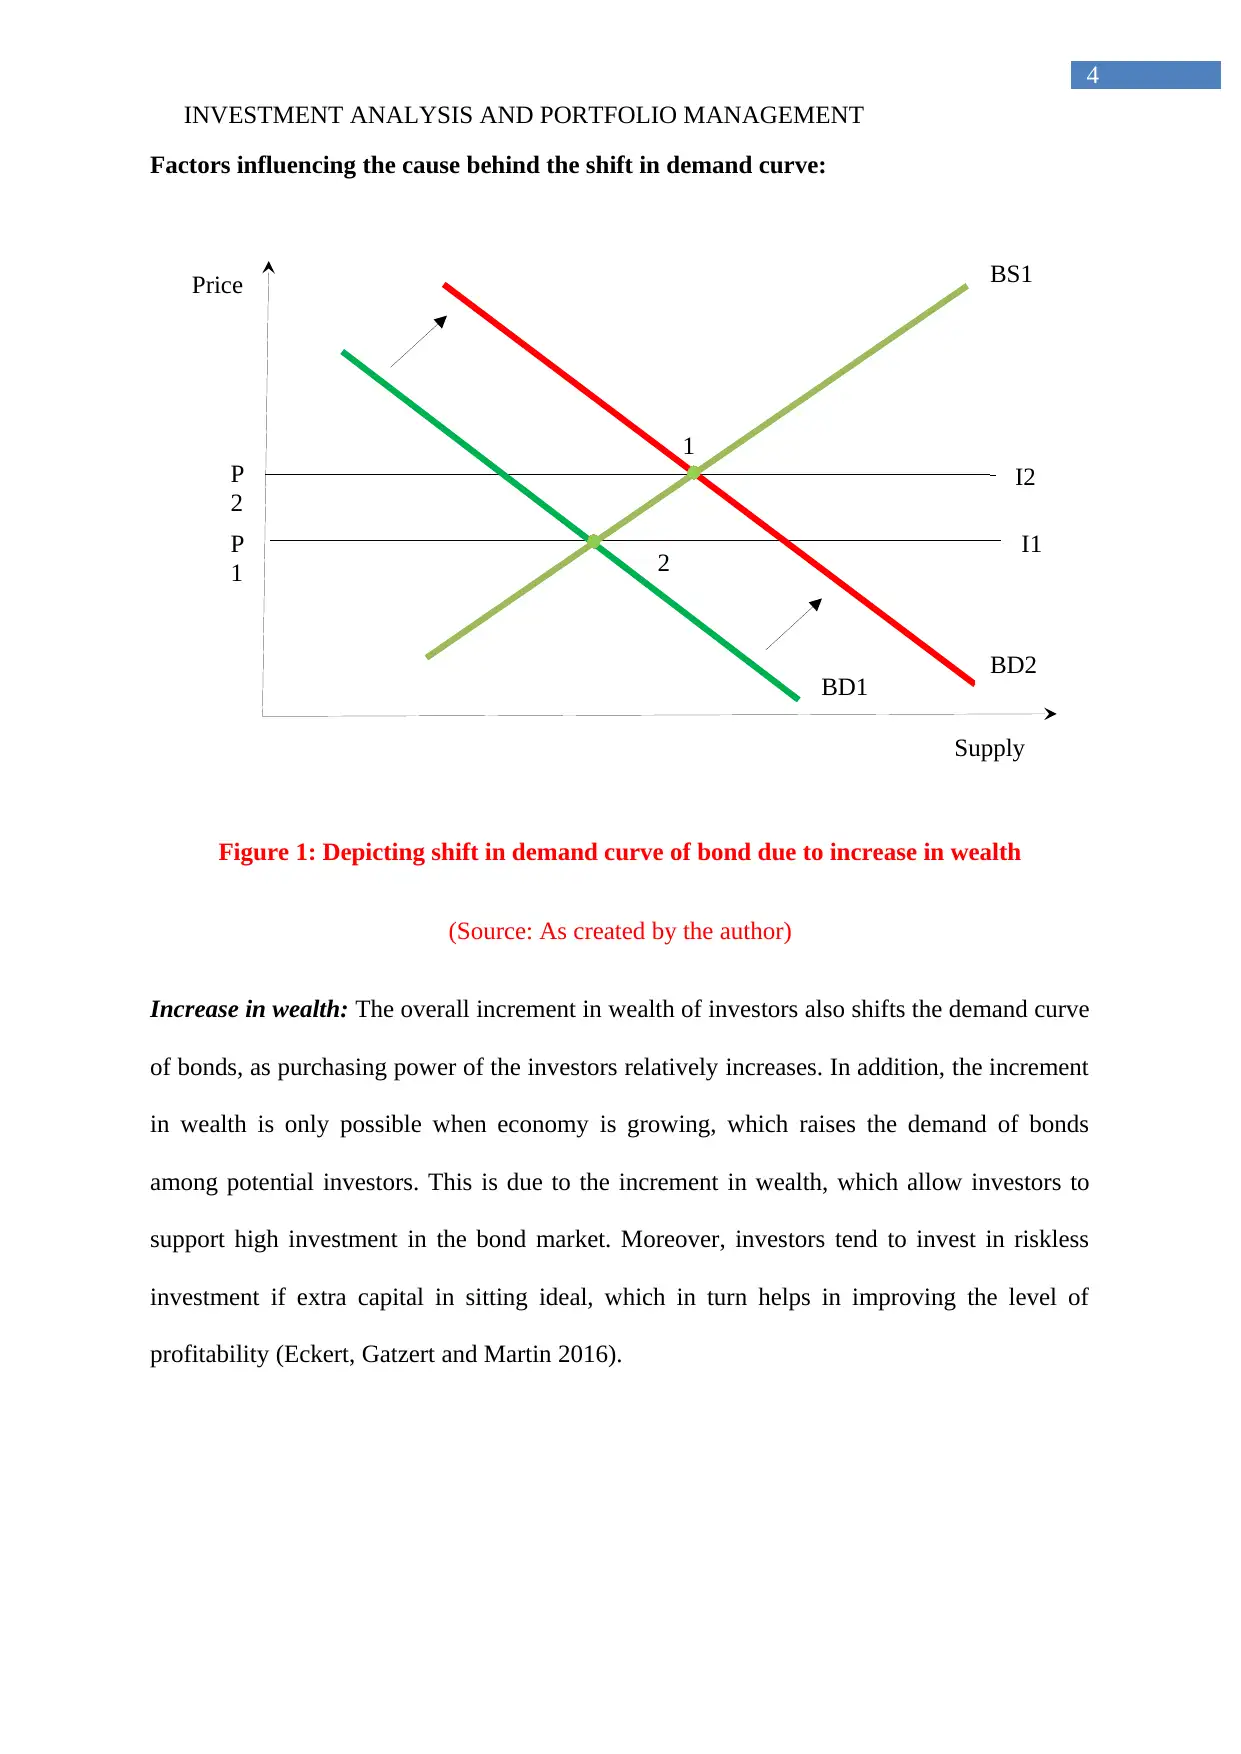
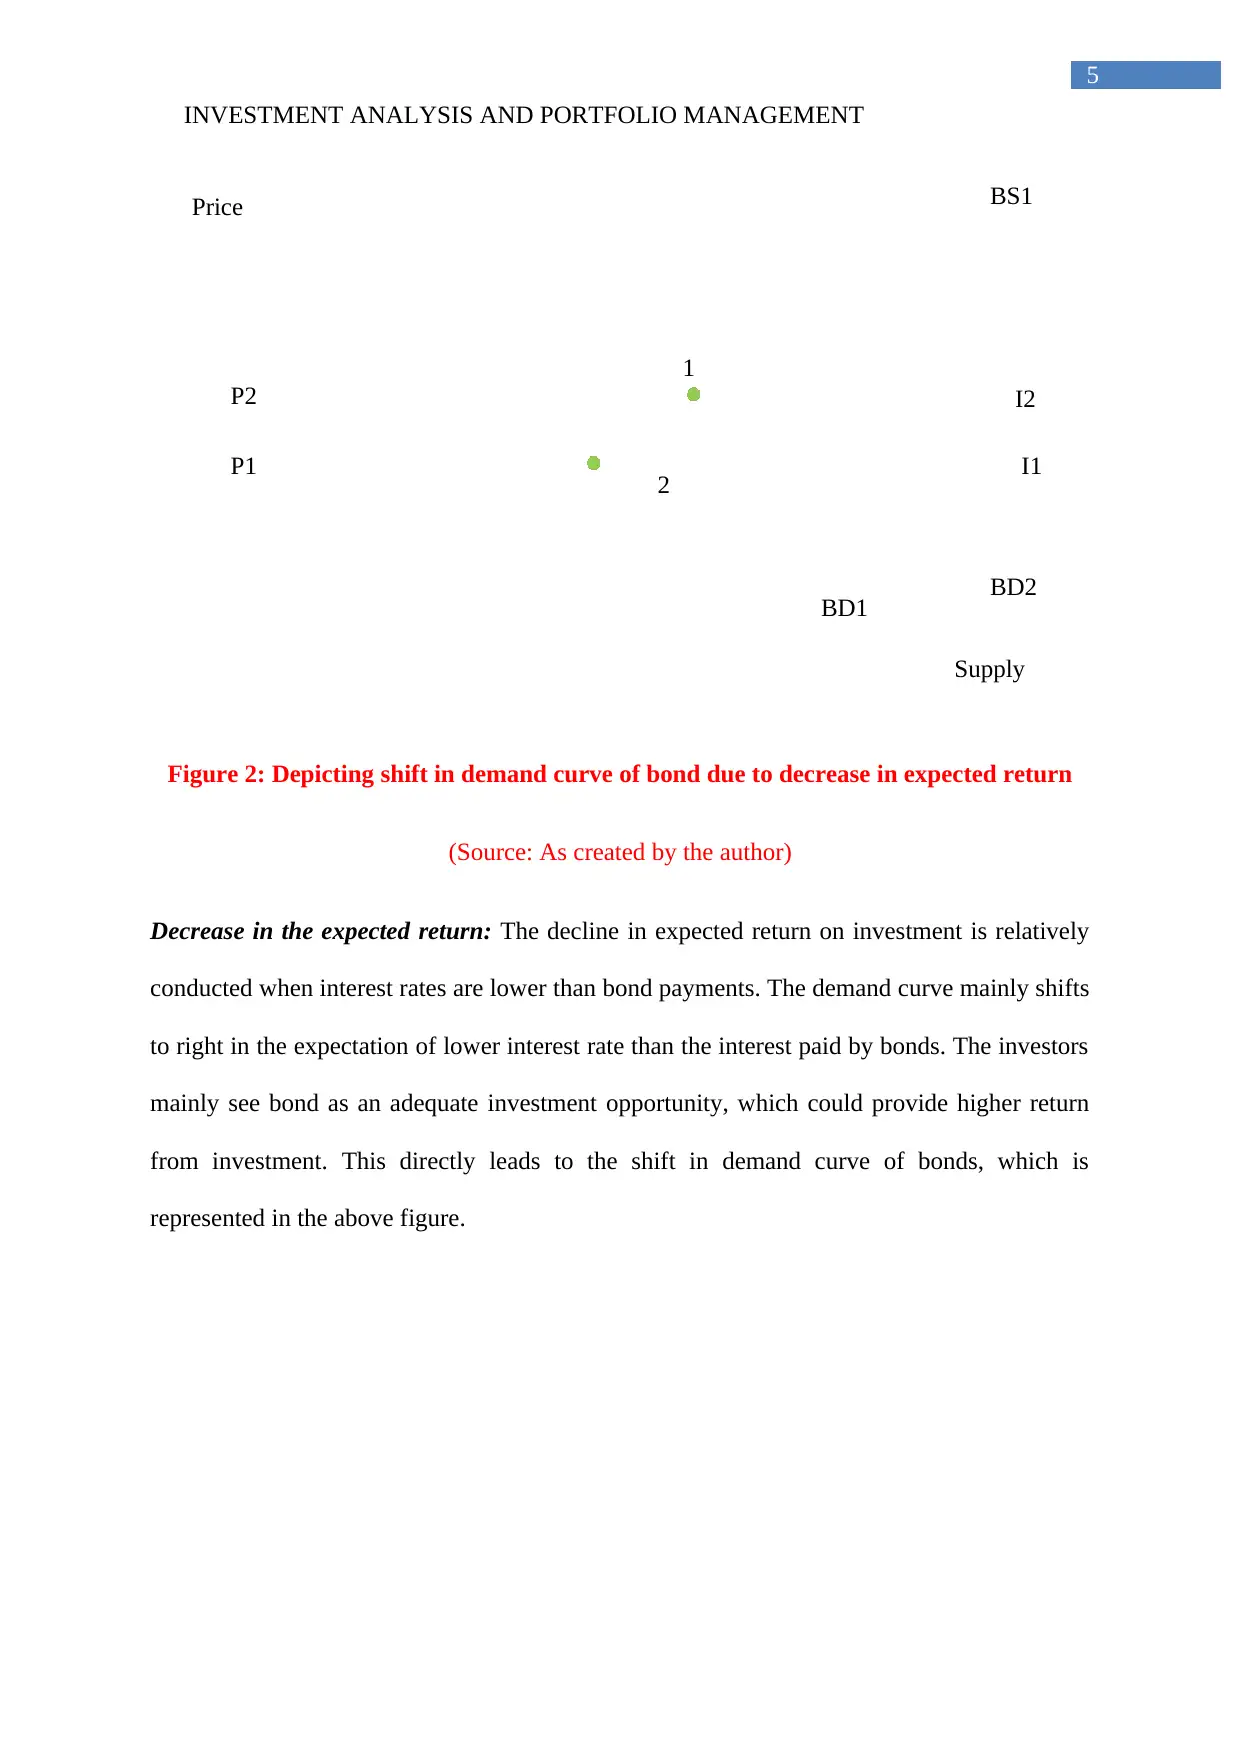
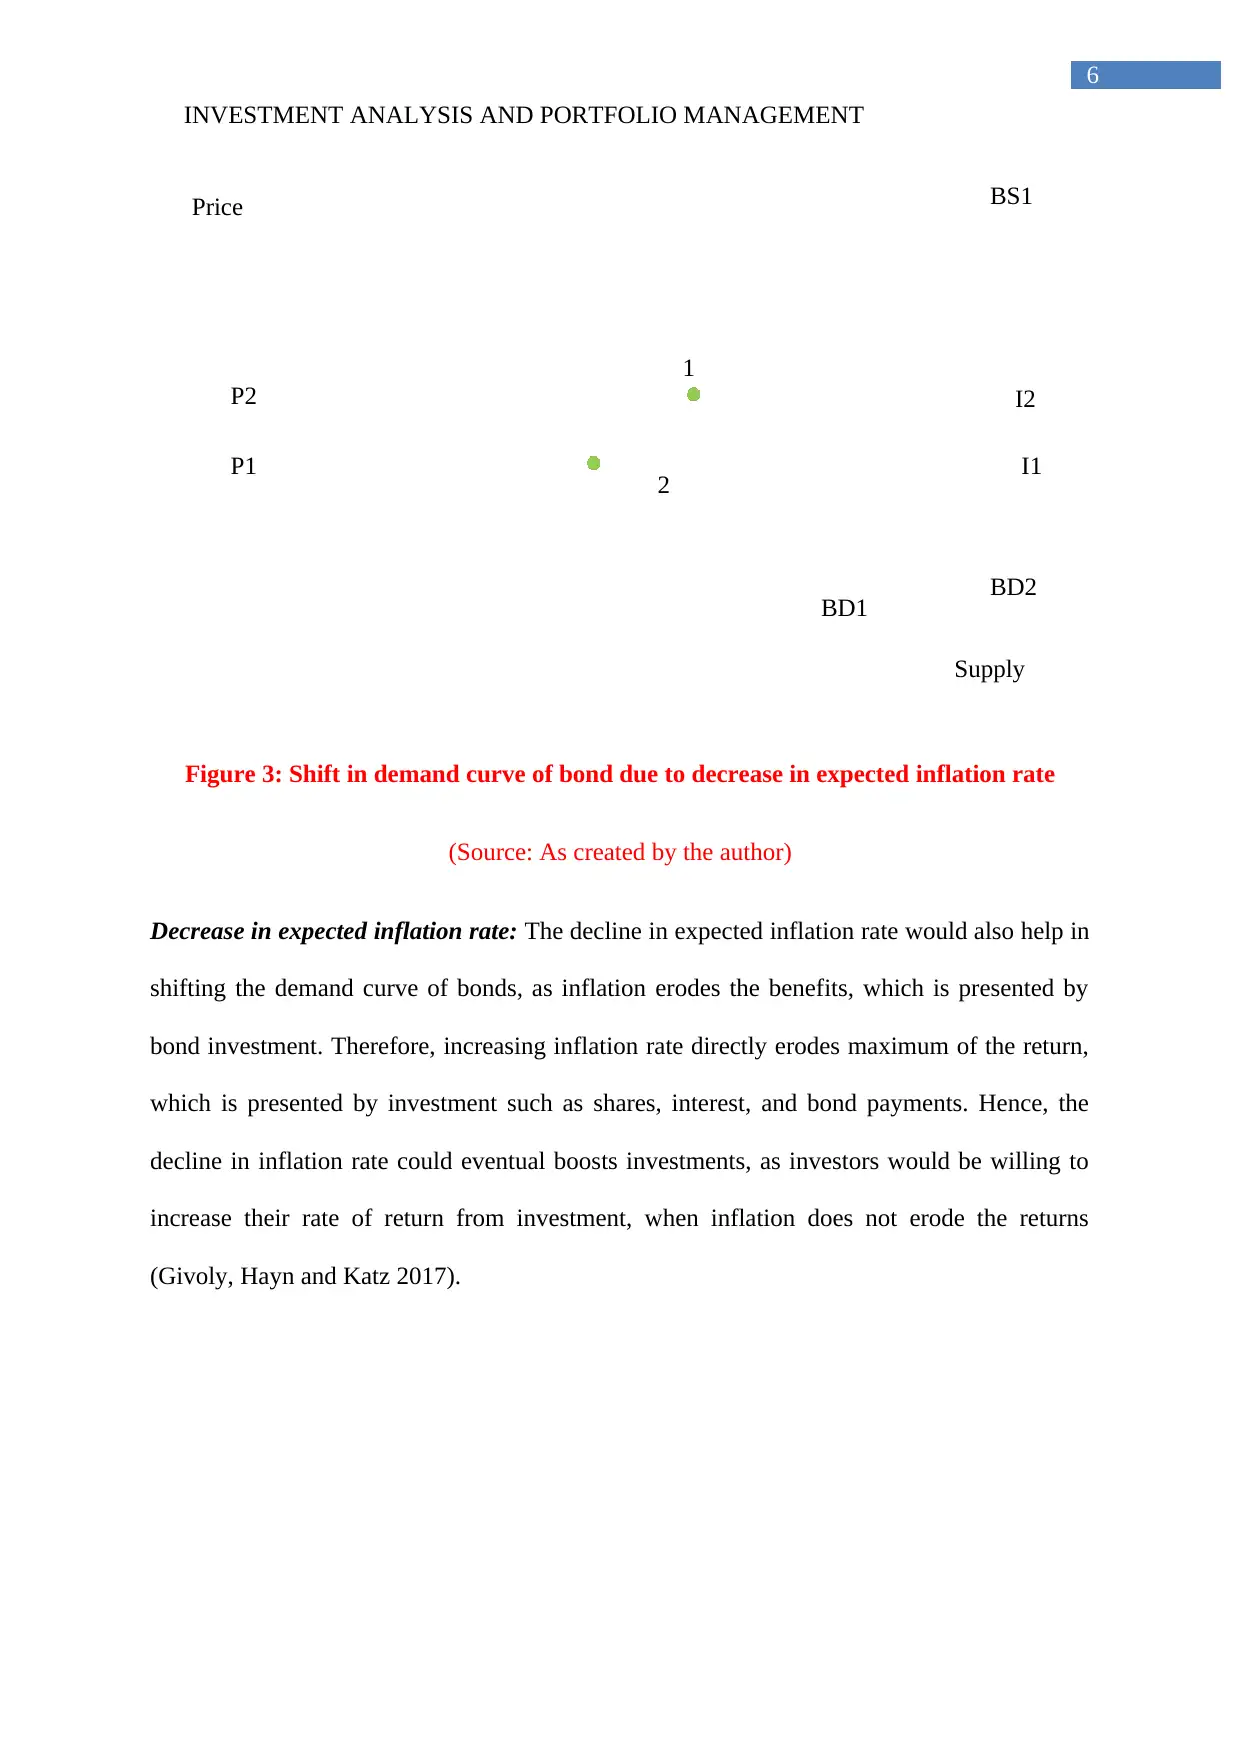
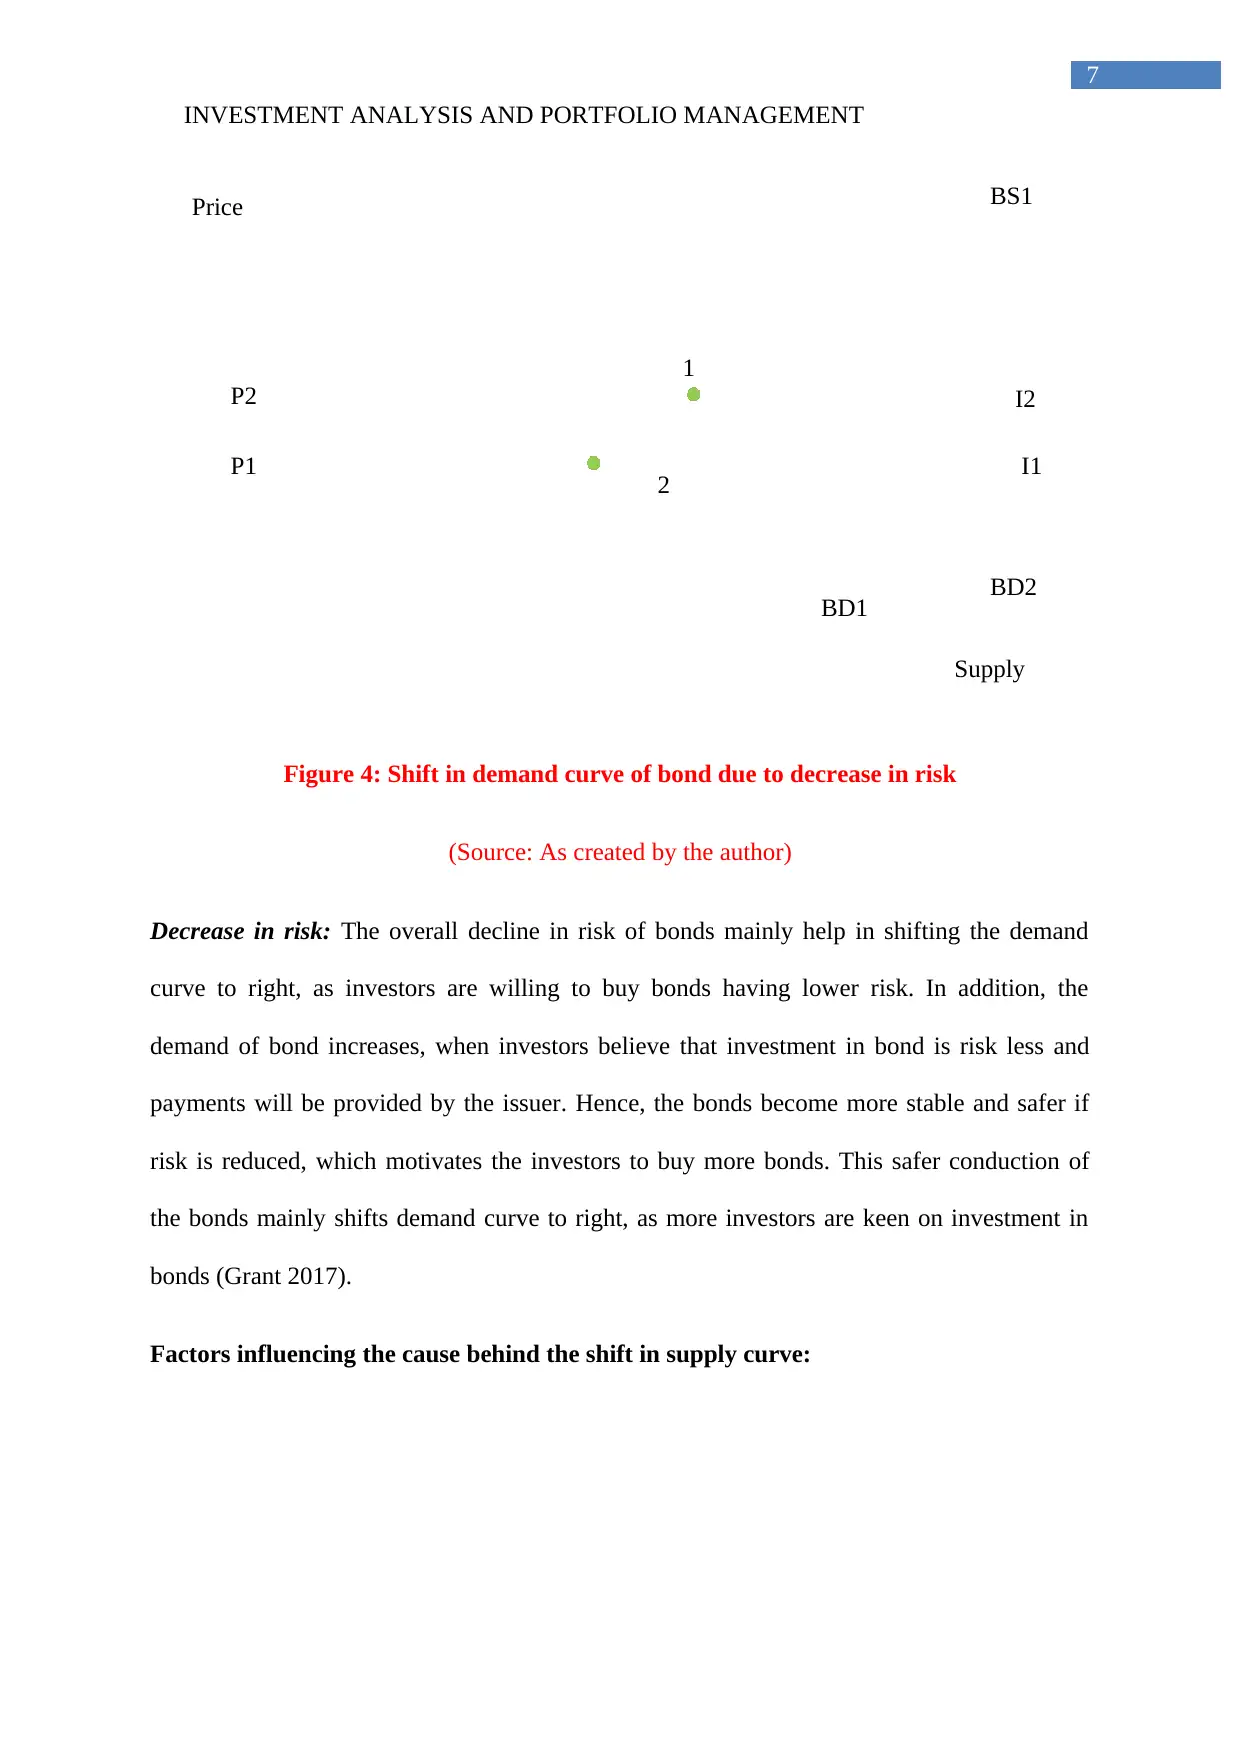
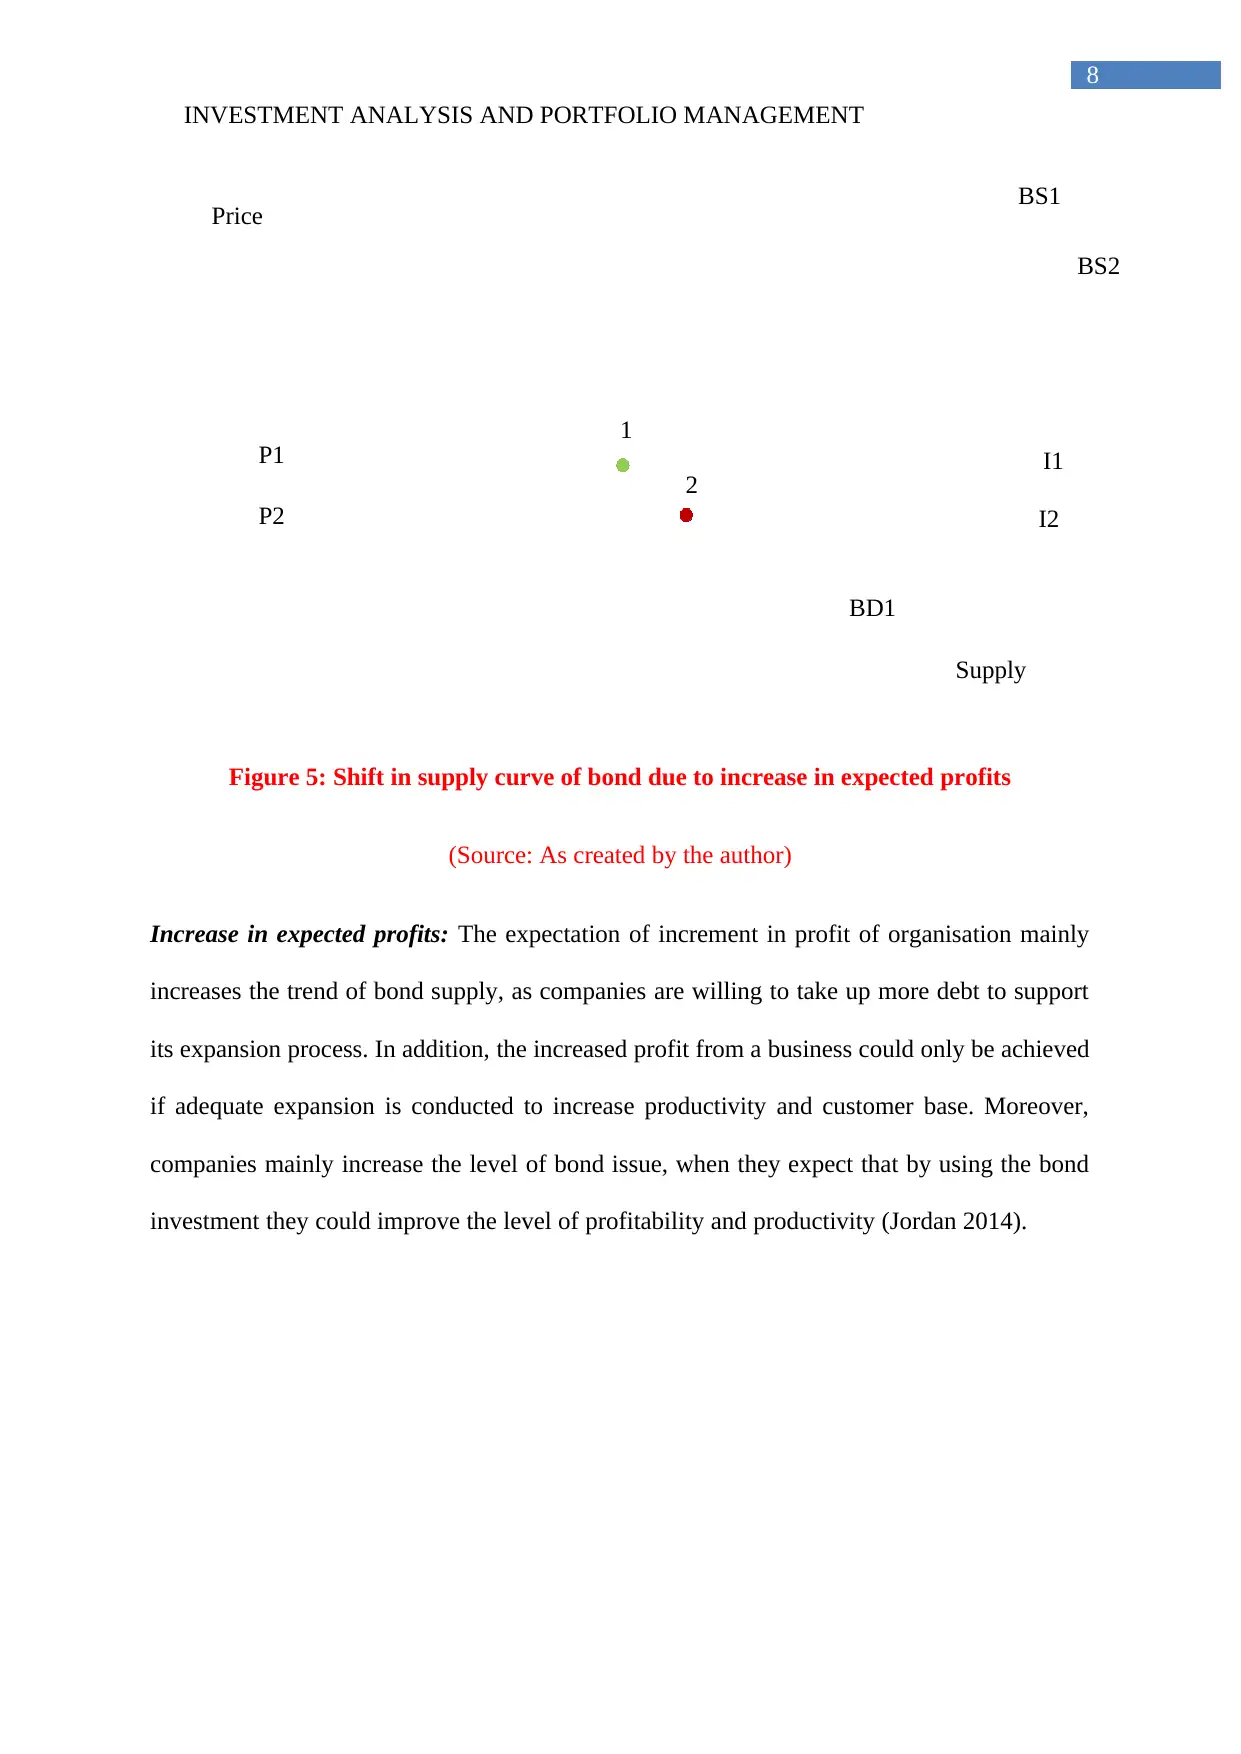
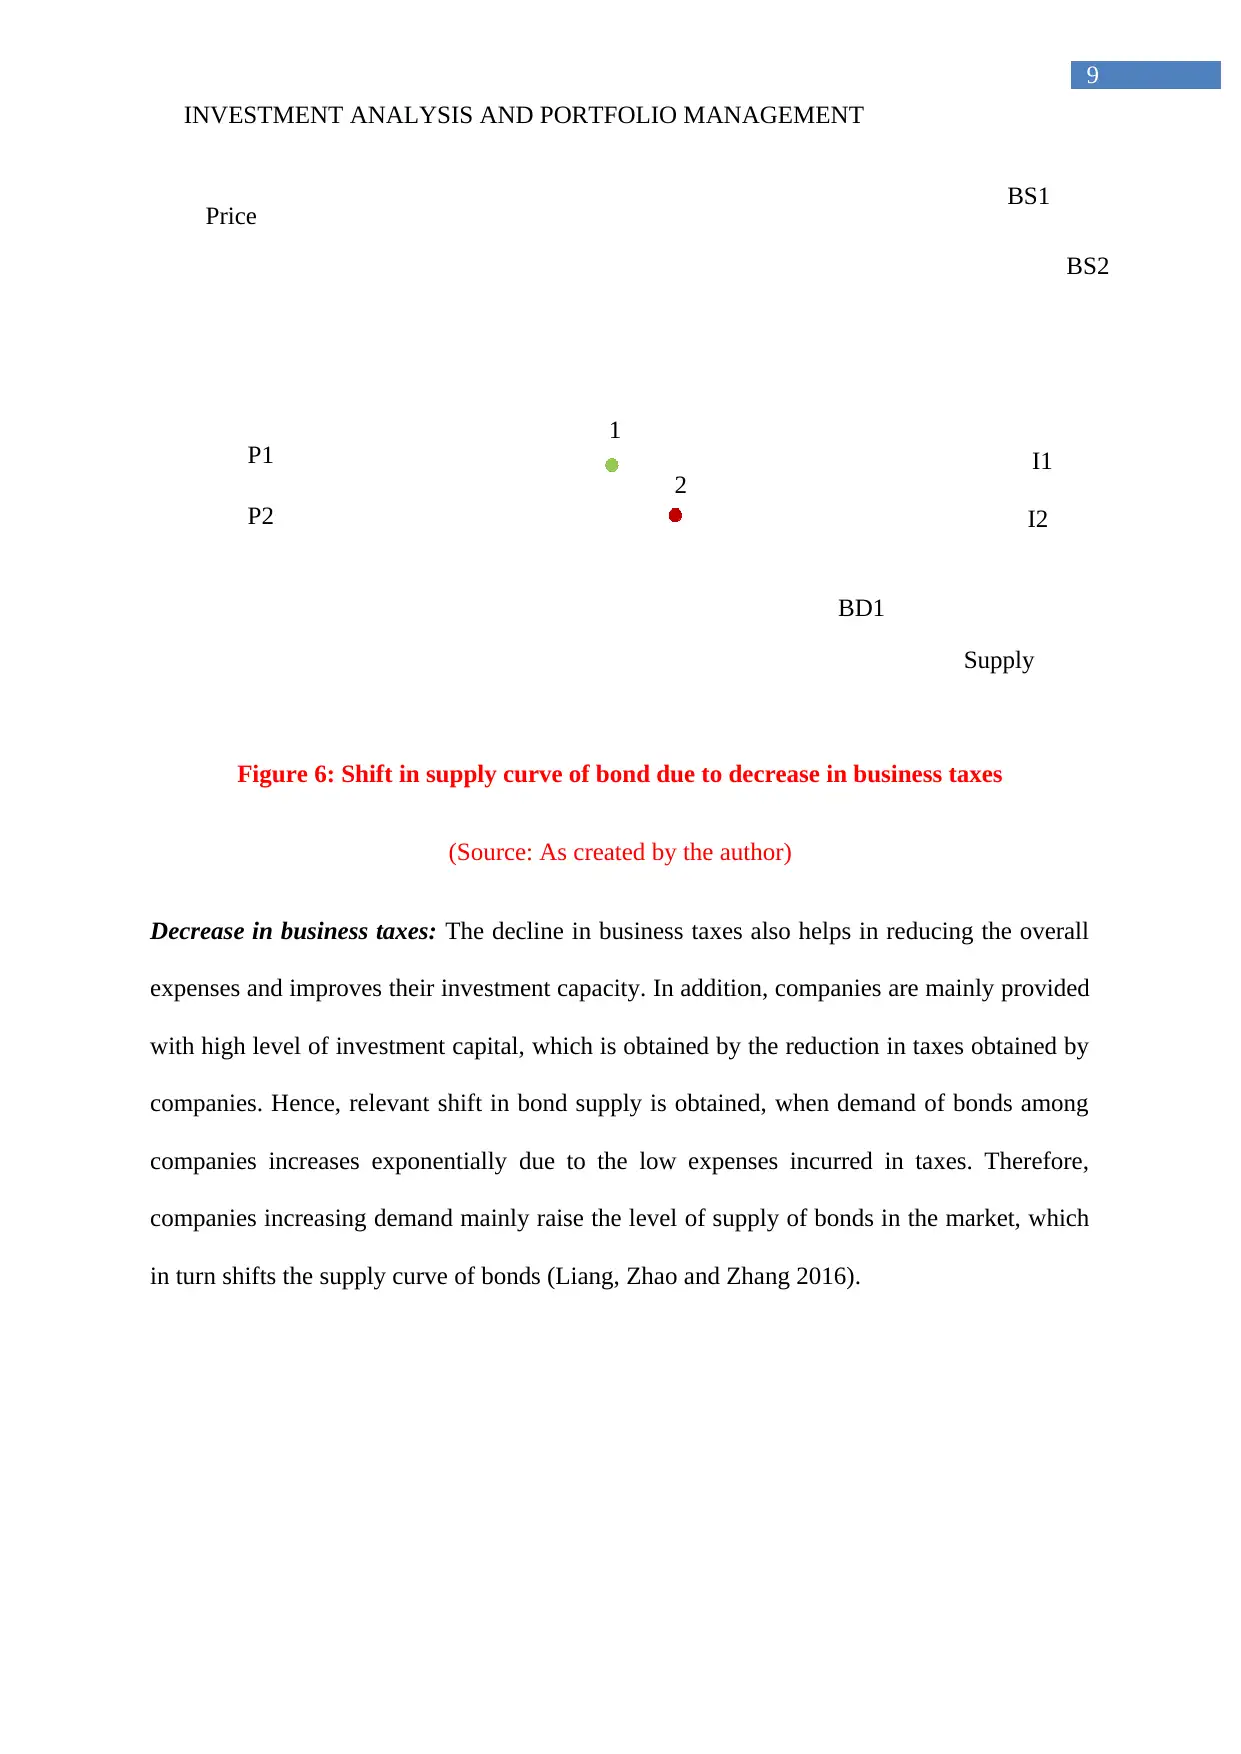
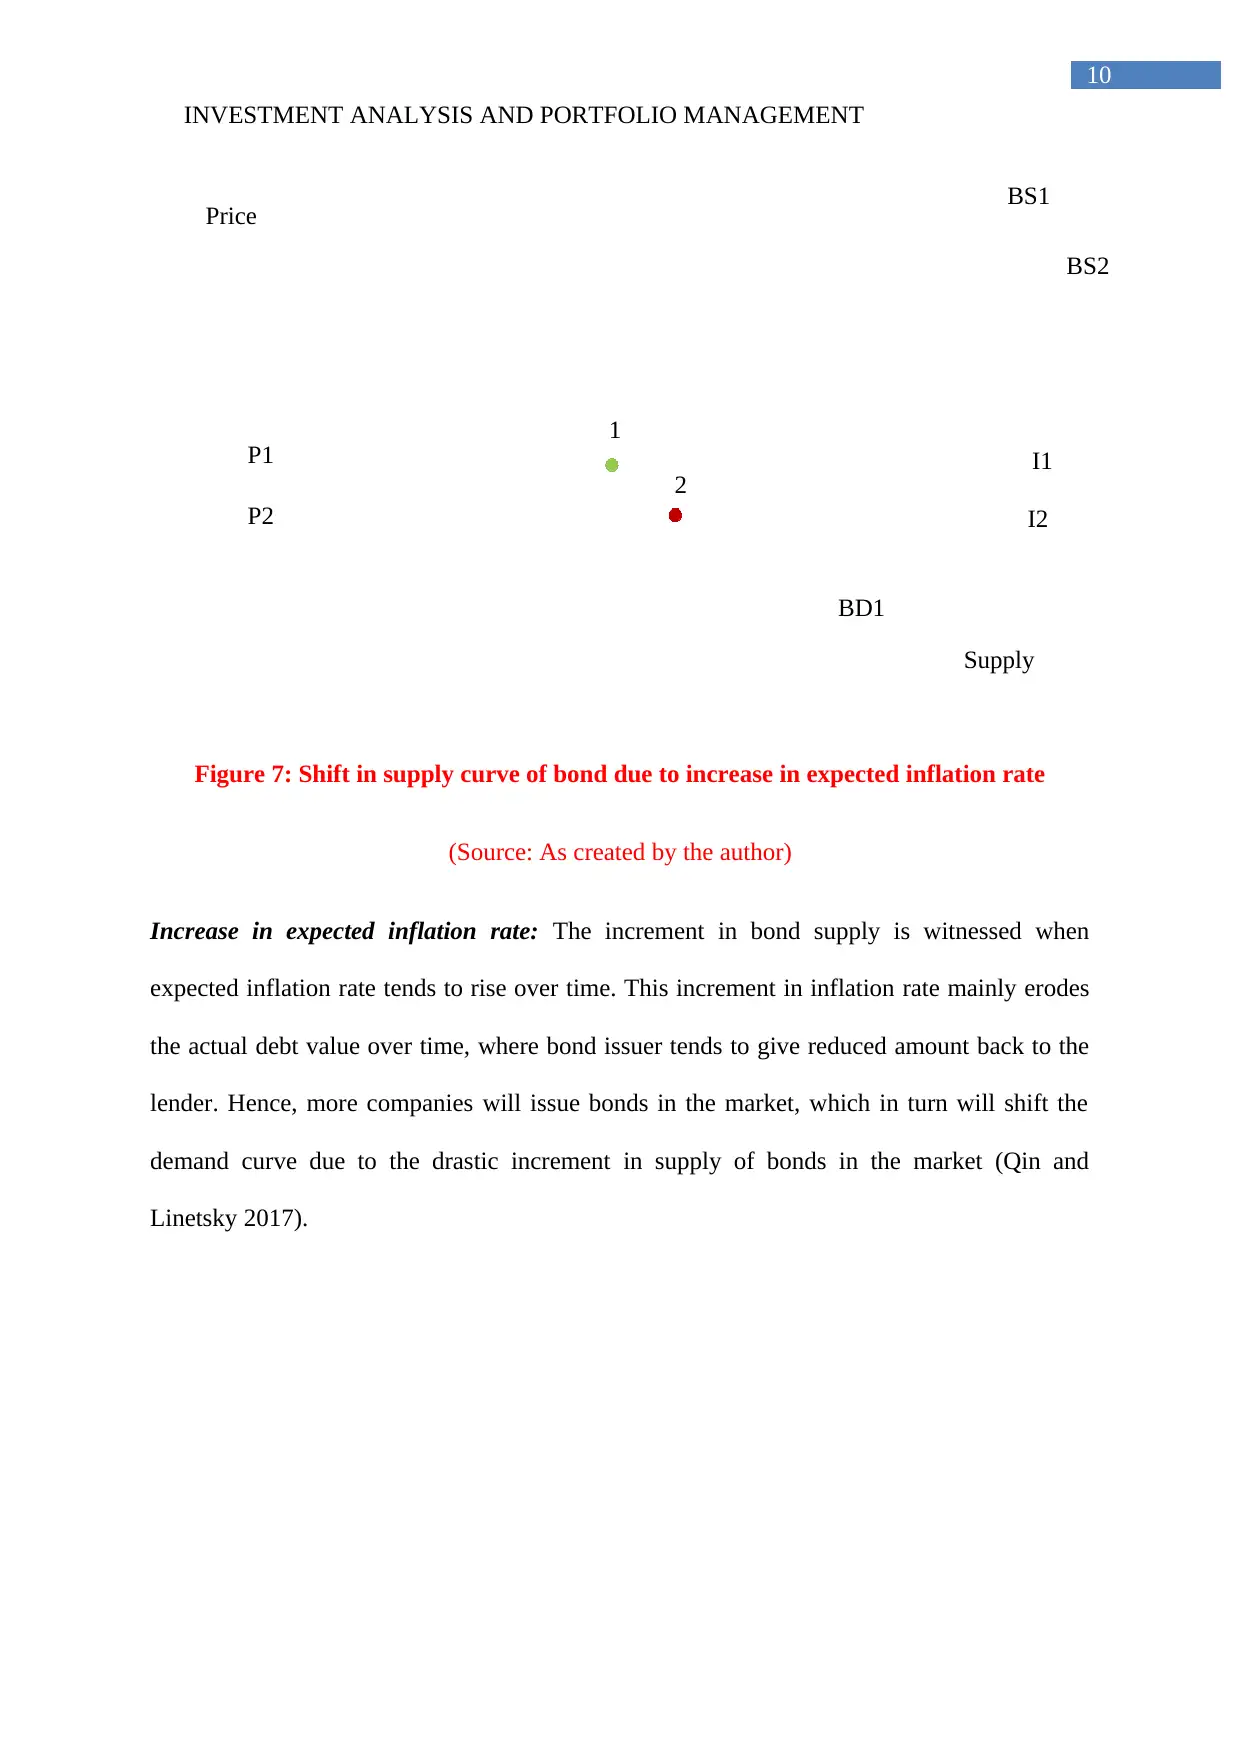
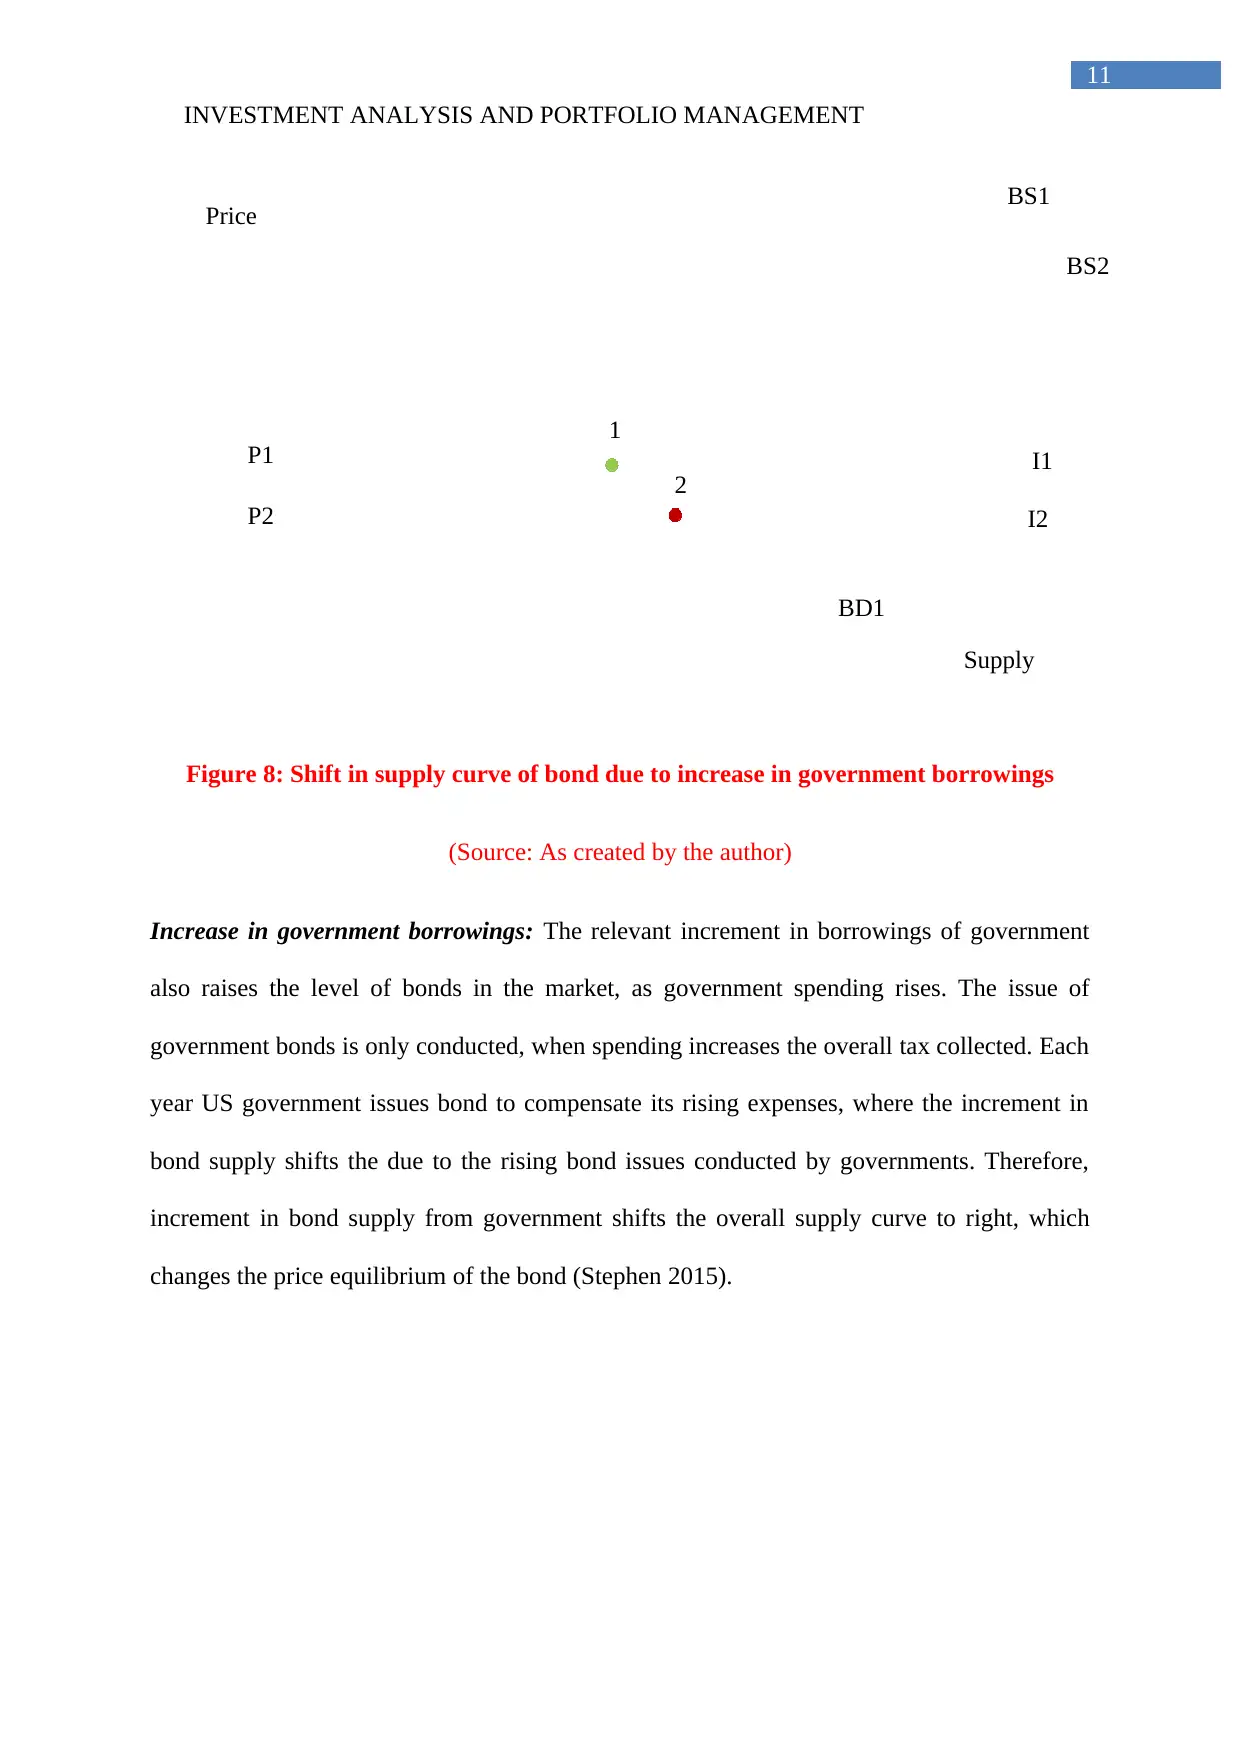
This report provides an in-depth investment analysis and portfolio management perspective on bond valuation. It begins by calculating the expected return of a bond under various market price scenarios, demonstrating the inverse relationship between market price and expected return. The report then determines the current market price of the bond based on a 20% expected return, highlighting the importance of aligning market value with investor expectations. A significant portion of the report is dedicated to explaining the factors that shift the demand and supply curves of bonds, including changes in investor wealth, expected returns, inflation rates, risk perceptions, company profits, business taxes, and government borrowings. Each factor is illustrated with a graphical representation, providing a comprehensive understanding of bond market dynamics. Desklib provides students access to similar solved assignments and past papers.
tabler-icon-diamond-filled.svg

Contribute Materials

Your contribution can guide someoneā€™s learning journey. Share your documents today.
Document Page
Running head: INVESTMENT ANALYSIS AND PORTFOLIO MANAGEMENT
Investment Analysis and Portfolio Management
Name of the Student:
Name of the University:
Authors Note:
tabler-icon-diamond-filled.svg

Secure Best Marks with AI Grader

Need help grading? Try our AI Grader for instant feedback on your assignments.
Document Page
INVESTMENT ANALYSIS AND PORTFOLIO MANAGEMENT
1
Table of Contents
1. Detecting and calculating the expected return of the bond:...................................................2
2. Depicting the current market price of the bond:....................................................................3
3. Depicting four reasons behind the shift of demand curve and supply curve of bond:...........3
Reference:................................................................................................................................12
Document Page
INVESTMENT ANALYSIS AND PORTFOLIO MANAGEMENT
2
1. Detecting and calculating the expected return of the bond:
Bond market value Expected return on bond
a) $800.00 = (1000-800)/800
= 25.00%
b) $950.00 = (1000-950)/950
= 5.26%
c) $1,000.00 = (1000-1000)/1000
= 00.00%
d) $1,250.00 = (1000-1250)/1250
= -20.00%
The above table mainly helps in depicting the overall returns, which could be
provided from the bond if market price ranges from $800 to $1,250. This evaluation mainly
indicates that changes in market value of the bond also alters the overall expected return of
the bond, which could be generated by the investor. In addition, when the market price of the
bond is at the levels of $800 then the retune is at the levels of 25%, as the investors can invest
less and get $1000 in maturity time. Moreover, the return directly reduces to 5.26% when the
overall market value of bond is at $950. This is only possible as the overall return from the
investment of the investor is reduced, as it will only get a return of $50 in maturity.
Moreover, the market value of bond is at the level of $1,000 will have 0% return from
investment, as no profit will be incurred by the investor. Lastly, increment in bond value to
$1,250 will lead to be loss of 20%, which will be incurred by the company (Ballotta and
Kyriakou 2015).
Document Page
INVESTMENT ANALYSIS AND PORTFOLIO MANAGEMENT
3
2. Depicting the current market price of the bond:
Particulars Value
Bond price $ 1,000.00
Expected return 20%
Market price of the bond 1000 / (1+20%)
Market price of the bond $ 833.33
The table mainly helps in detecting the overall market price of bond, which is derived
with the help of expected return formula. In addition, the overall market price of bond has
declined to $833.33, as expected return from the zero-compound bond is at the levels of 20%.
This relevant market value of zero coupon bond mainly needs to decline from the actual par
value of the bond for supporting the expected return of the investor. This would also help in
understanding the financial viability of the investment, which would be conducted from
investment. In this context, Bond and Brown (2017) mentioned that with the help of expected
return formula investor can detect the minimum bond price in which they will be interested in
buying the bond. On the other hand, Chandra (2017) criticises that bond valuation are subject
to the credit rating, which could in turn help in detecting the actual value of bond. Investors
mainly uses expected return measures for zero coupon bonds, as there are no yearly payments
conducted by the issuer.
3. Depicting four reasons behind the shift of demand curve and supply curve of bond:
The above figure mainly depicts the overall demand and supply section of the bond,
which could help in understanding the reason behind price of bond. In addition, the changes
in shift of demand and supply are conducted due to some factors. These factors are depicted
as follows.
tabler-icon-diamond-filled.svg

Secure Best Marks with AI Grader

Need help grading? Try our AI Grader for instant feedback on your assignments.
Document Page
INVESTMENT ANALYSIS AND PORTFOLIO MANAGEMENT
4
Supply
Price
P
1
P
2
BS1
2
1
BD1 BD2
I2
I1
Factors influencing the cause behind the shift in demand curve:
Figure 1: Depicting shift in demand curve of bond due to increase in wealth
(Source: As created by the author)
Increase in wealth: The overall increment in wealth of investors also shifts the demand curve
of bonds, as purchasing power of the investors relatively increases. In addition, the increment
in wealth is only possible when economy is growing, which raises the demand of bonds
among potential investors. This is due to the increment in wealth, which allow investors to
support high investment in the bond market. Moreover, investors tend to invest in riskless
investment if extra capital in sitting ideal, which in turn helps in improving the level of
profitability (Eckert, Gatzert and Martin 2016).
Document Page
INVESTMENT ANALYSIS AND PORTFOLIO MANAGEMENT
5
Supply
Price
P1
P2
BS1
2
1
BD1 BD2
I2
I1
Figure 2: Depicting shift in demand curve of bond due to decrease in expected return
(Source: As created by the author)
Decrease in the expected return: The decline in expected return on investment is relatively
conducted when interest rates are lower than bond payments. The demand curve mainly shifts
to right in the expectation of lower interest rate than the interest paid by bonds. The investors
mainly see bond as an adequate investment opportunity, which could provide higher return
from investment. This directly leads to the shift in demand curve of bonds, which is
represented in the above figure.
Document Page
INVESTMENT ANALYSIS AND PORTFOLIO MANAGEMENT
6
Supply
Price
P1
P2
BS1
2
1
BD1 BD2
I2
I1
Figure 3: Shift in demand curve of bond due to decrease in expected inflation rate
(Source: As created by the author)
Decrease in expected inflation rate: The decline in expected inflation rate would also help in
shifting the demand curve of bonds, as inflation erodes the benefits, which is presented by
bond investment. Therefore, increasing inflation rate directly erodes maximum of the return,
which is presented by investment such as shares, interest, and bond payments. Hence, the
decline in inflation rate could eventual boosts investments, as investors would be willing to
increase their rate of return from investment, when inflation does not erode the returns
(Givoly, Hayn and Katz 2017).
tabler-icon-diamond-filled.svg

Paraphrase This Document

Need a fresh take? Get an instant paraphrase of this document with our AI Paraphraser
Document Page
INVESTMENT ANALYSIS AND PORTFOLIO MANAGEMENT
7
Supply
Price
P1
P2
BS1
2
1
BD1 BD2
I2
I1
Figure 4: Shift in demand curve of bond due to decrease in risk
(Source: As created by the author)
Decrease in risk: The overall decline in risk of bonds mainly help in shifting the demand
curve to right, as investors are willing to buy bonds having lower risk. In addition, the
demand of bond increases, when investors believe that investment in bond is risk less and
payments will be provided by the issuer. Hence, the bonds become more stable and safer if
risk is reduced, which motivates the investors to buy more bonds. This safer conduction of
the bonds mainly shifts demand curve to right, as more investors are keen on investment in
bonds (Grant 2017).
Factors influencing the cause behind the shift in supply curve:
Document Page
INVESTMENT ANALYSIS AND PORTFOLIO MANAGEMENT
8
P2
P1
BS2
BS1
2
1
BD1
I1
I2
Price
Supply
Figure 5: Shift in supply curve of bond due to increase in expected profits
(Source: As created by the author)
Increase in expected profits: The expectation of increment in profit of organisation mainly
increases the trend of bond supply, as companies are willing to take up more debt to support
its expansion process. In addition, the increased profit from a business could only be achieved
if adequate expansion is conducted to increase productivity and customer base. Moreover,
companies mainly increase the level of bond issue, when they expect that by using the bond
investment they could improve the level of profitability and productivity (Jordan 2014).
Document Page
INVESTMENT ANALYSIS AND PORTFOLIO MANAGEMENT
9
P2
P1
BS2
BS1
2
1
BD1
I1
I2
Price
Supply
Figure 6: Shift in supply curve of bond due to decrease in business taxes
(Source: As created by the author)
Decrease in business taxes: The decline in business taxes also helps in reducing the overall
expenses and improves their investment capacity. In addition, companies are mainly provided
with high level of investment capital, which is obtained by the reduction in taxes obtained by
companies. Hence, relevant shift in bond supply is obtained, when demand of bonds among
companies increases exponentially due to the low expenses incurred in taxes. Therefore,
companies increasing demand mainly raise the level of supply of bonds in the market, which
in turn shifts the supply curve of bonds (Liang, Zhao and Zhang 2016).
tabler-icon-diamond-filled.svg

Secure Best Marks with AI Grader

Need help grading? Try our AI Grader for instant feedback on your assignments.
Document Page
INVESTMENT ANALYSIS AND PORTFOLIO MANAGEMENT
10
P2
P1
BS2
BS1
2
1
BD1
I1
I2
Price
Supply
Figure 7: Shift in supply curve of bond due to increase in expected inflation rate
(Source: As created by the author)
Increase in expected inflation rate: The increment in bond supply is witnessed when
expected inflation rate tends to rise over time. This increment in inflation rate mainly erodes
the actual debt value over time, where bond issuer tends to give reduced amount back to the
lender. Hence, more companies will issue bonds in the market, which in turn will shift the
demand curve due to the drastic increment in supply of bonds in the market (Qin and
Linetsky 2017).
Document Page
INVESTMENT ANALYSIS AND PORTFOLIO MANAGEMENT
11
P2
P1
BS2
BS1
2
1
BD1
I1
I2
Price
Supply
Figure 8: Shift in supply curve of bond due to increase in government borrowings
(Source: As created by the author)
Increase in government borrowings: The relevant increment in borrowings of government
also raises the level of bonds in the market, as government spending rises. The issue of
government bonds is only conducted, when spending increases the overall tax collected. Each
year US government issues bond to compensate its rising expenses, where the increment in
bond supply shifts the due to the rising bond issues conducted by governments. Therefore,
increment in bond supply from government shifts the overall supply curve to right, which
changes the price equilibrium of the bond (Stephen 2015).
Document Page
INVESTMENT ANALYSIS AND PORTFOLIO MANAGEMENT
12
Reference:
Ballotta, L. and Kyriakou, I., 2015. Convertible bond valuation in a jump diffusion setting
with stochastic interest rates. Quantitative Finance, 15(1), pp.115-129.
Bond, P.H. and Brown, P.K., 2017. Rating valuation: principles and practice. Routledge.
Chandra, P., 2017. Investment analysis and portfolio management. McGraw-Hill Education.
Eckert, J., Gatzert, N. and Martin, M., 2016. Valuation and risk assessment of participating
life insurance in the presence of credit risk. Insurance: Mathematics and Economics, 71,
pp.382-393.
Givoly, D., Hayn, C. and Katz, S., 2017. The changing relevance of accounting information
to debt holders over time. Review of Accounting Studies, 22(1), pp.64-108.
Grant, D., 2017. Comparing Three Convertible Debt Valuation Models. Business Valuation
Review, 36(1), pp.32-41.
Jordan, B., 2014. Fundamentals of investments. McGraw-Hill Higher Education.
Liang, J., Zhao, Y. and Zhang, X., 2016. Utility indifference valuation of corporate bond with
credit rating migration by structure approach. Economic Modelling, 54, pp.339-346.
Qin, L. and Linetsky, V., 2017. Longā€Term Risk: A Martingale
Approach. Econometrica, 85(1), pp.299-312.
Stephen, S.A., 2015. Enhancing the Learning Experience in Finance Using Online Video
Clips. Journal of Financial Education, pp.103-116.
chevron_up_icon
1 out of 13
circle_padding
hide_on_mobile
zoom_out_icon
logo.png

Your All-in-One AI-Powered Toolkit for Academic Success.

Available 24*7 on WhatsApp / Email

[object Object]