Accounting Report: Bonza Handtools Ltd. Profit Analysis and Costing
VerifiedAdded on 2020/06/03
|12
|2205
|69
Report
AI Summary
This accounting report analyzes various financial aspects for Bonza Handtools Ltd. It begins by evaluating different proposals to increase profitability, considering factors like pricing, advertising, and sales volume. The report then assesses the impact of different production capacities on profits, followed by a discussion on treating salaries and depreciation as assets. Further, the report delves into overhead allocation rates, the costing of a special order, and the determination of the minimum price per trailer. The conclusion emphasizes the importance of accurate cost and profit analysis for optimal financial outcomes, including the impact of advertising budgets and the treatment of salaries and depreciation in financial statements. The report utilizes tables and illustrations to present financial data and analysis.
ACCOUNTING
Paraphrase This Document
Need a fresh take? Get an instant paraphrase of this document with our AI Paraphraser
Table of Contents
INTRODUCTION...........................................................................................................................1
Question 1: Financial suggestions to the senior staff..................................................................1
Question 2: Opinion on level of the bid......................................................................................4
Question 3 Salaries and depreciation considered as assets in the balance sheet.........................5
Question 4...................................................................................................................................6
CONCLUSION................................................................................................................................7
REFERENCES................................................................................................................................8
Illustration Index
Illustration 1: Comparison of profits................................................................................................4
Index of Tables
Table 1: Actual profits in previous year..........................................................................................1
Table 2: Estimated profits from Proposal 1.....................................................................................1
Table 3: Estimated profits from Proposal 2.....................................................................................2
Table 4: Estimated profits from Proposal 3.....................................................................................2
Table 5: Profits for Tassie Company...............................................................................................4
Table 6: Profits from Case 1............................................................................................................4
Table 7: Profits from Case 2............................................................................................................5
Table 8: Overhead Allocation Rate..................................................................................................6
Table 9: Total Cost of Special order................................................................................................6
Table 10: Total cost with Machine Hours........................................................................................6
Table 11: Minimum Price per Trailer..............................................................................................7
⊘ This is a preview!⊘
Do you want full access?
Subscribe today to unlock all pages.
Trusted by 1+ million students worldwide
INTRODUCTION
Accounting is a systematic and comprehensive way to record the transactions which
helps to analyse, interpret and compare data which further, contributes in decision making
(Romney, & Steinbart, 2012). The report discusses various cases through which effect on profits
can be analysed by the entity. Further, it focusses on considering salaries and depreciation as
assets of the enterprise. In the end, it ponders on allocation rates, total cost of the order and
minimum price per trailer for ABC Ltd.
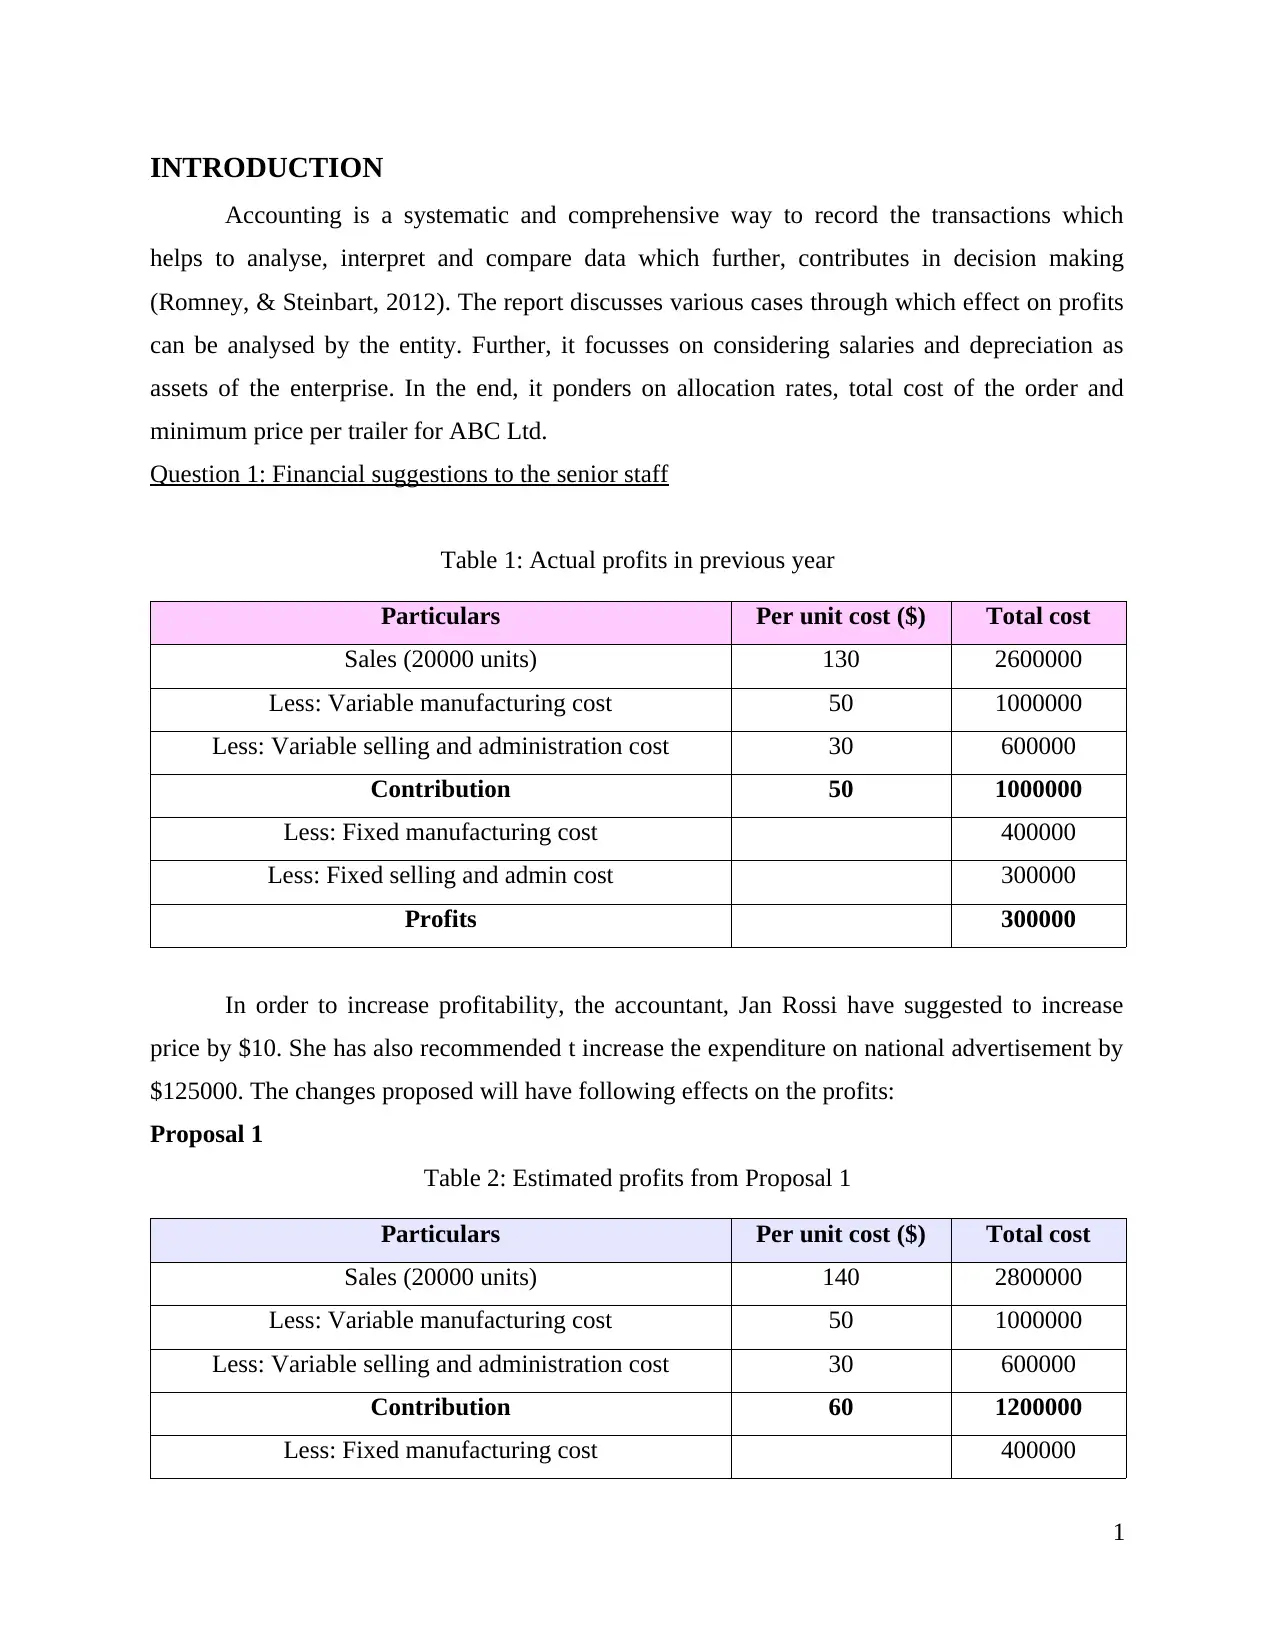
Question 1: Financial suggestions to the senior staff
Table 1: Actual profits in previous year
Particulars Per unit cost ($) Total cost
Sales (20000 units) 130 2600000
Less: Variable manufacturing cost 50 1000000
Less: Variable selling and administration cost 30 600000
Contribution 50 1000000
Less: Fixed manufacturing cost 400000
Less: Fixed selling and admin cost 300000
Profits 300000
In order to increase profitability, the accountant, Jan Rossi have suggested to increase
price by $10. She has also recommended t increase the expenditure on national advertisement by
$125000. The changes proposed will have following effects on the profits:
Proposal 1
Table 2: Estimated profits from Proposal 1
Particulars Per unit cost ($) Total cost
Sales (20000 units) 140 2800000
Less: Variable manufacturing cost 50 1000000
Less: Variable selling and administration cost 30 600000
Contribution 60 1200000
Less: Fixed manufacturing cost 400000
1
Accounting is a systematic and comprehensive way to record the transactions which
helps to analyse, interpret and compare data which further, contributes in decision making
(Romney, & Steinbart, 2012). The report discusses various cases through which effect on profits
can be analysed by the entity. Further, it focusses on considering salaries and depreciation as
assets of the enterprise. In the end, it ponders on allocation rates, total cost of the order and
minimum price per trailer for ABC Ltd.
Question 1: Financial suggestions to the senior staff
Table 1: Actual profits in previous year
Particulars Per unit cost ($) Total cost
Sales (20000 units) 130 2600000
Less: Variable manufacturing cost 50 1000000
Less: Variable selling and administration cost 30 600000
Contribution 50 1000000
Less: Fixed manufacturing cost 400000
Less: Fixed selling and admin cost 300000
Profits 300000
In order to increase profitability, the accountant, Jan Rossi have suggested to increase
price by $10. She has also recommended t increase the expenditure on national advertisement by
$125000. The changes proposed will have following effects on the profits:
Proposal 1
Table 2: Estimated profits from Proposal 1
Particulars Per unit cost ($) Total cost
Sales (20000 units) 140 2800000
Less: Variable manufacturing cost 50 1000000
Less: Variable selling and administration cost 30 600000
Contribution 60 1200000
Less: Fixed manufacturing cost 400000
1
Paraphrase This Document
Need a fresh take? Get an instant paraphrase of this document with our AI Paraphraser
Less: Fixed selling and admin cost 300000
Less: Advertising cost 125000
Profits 375000
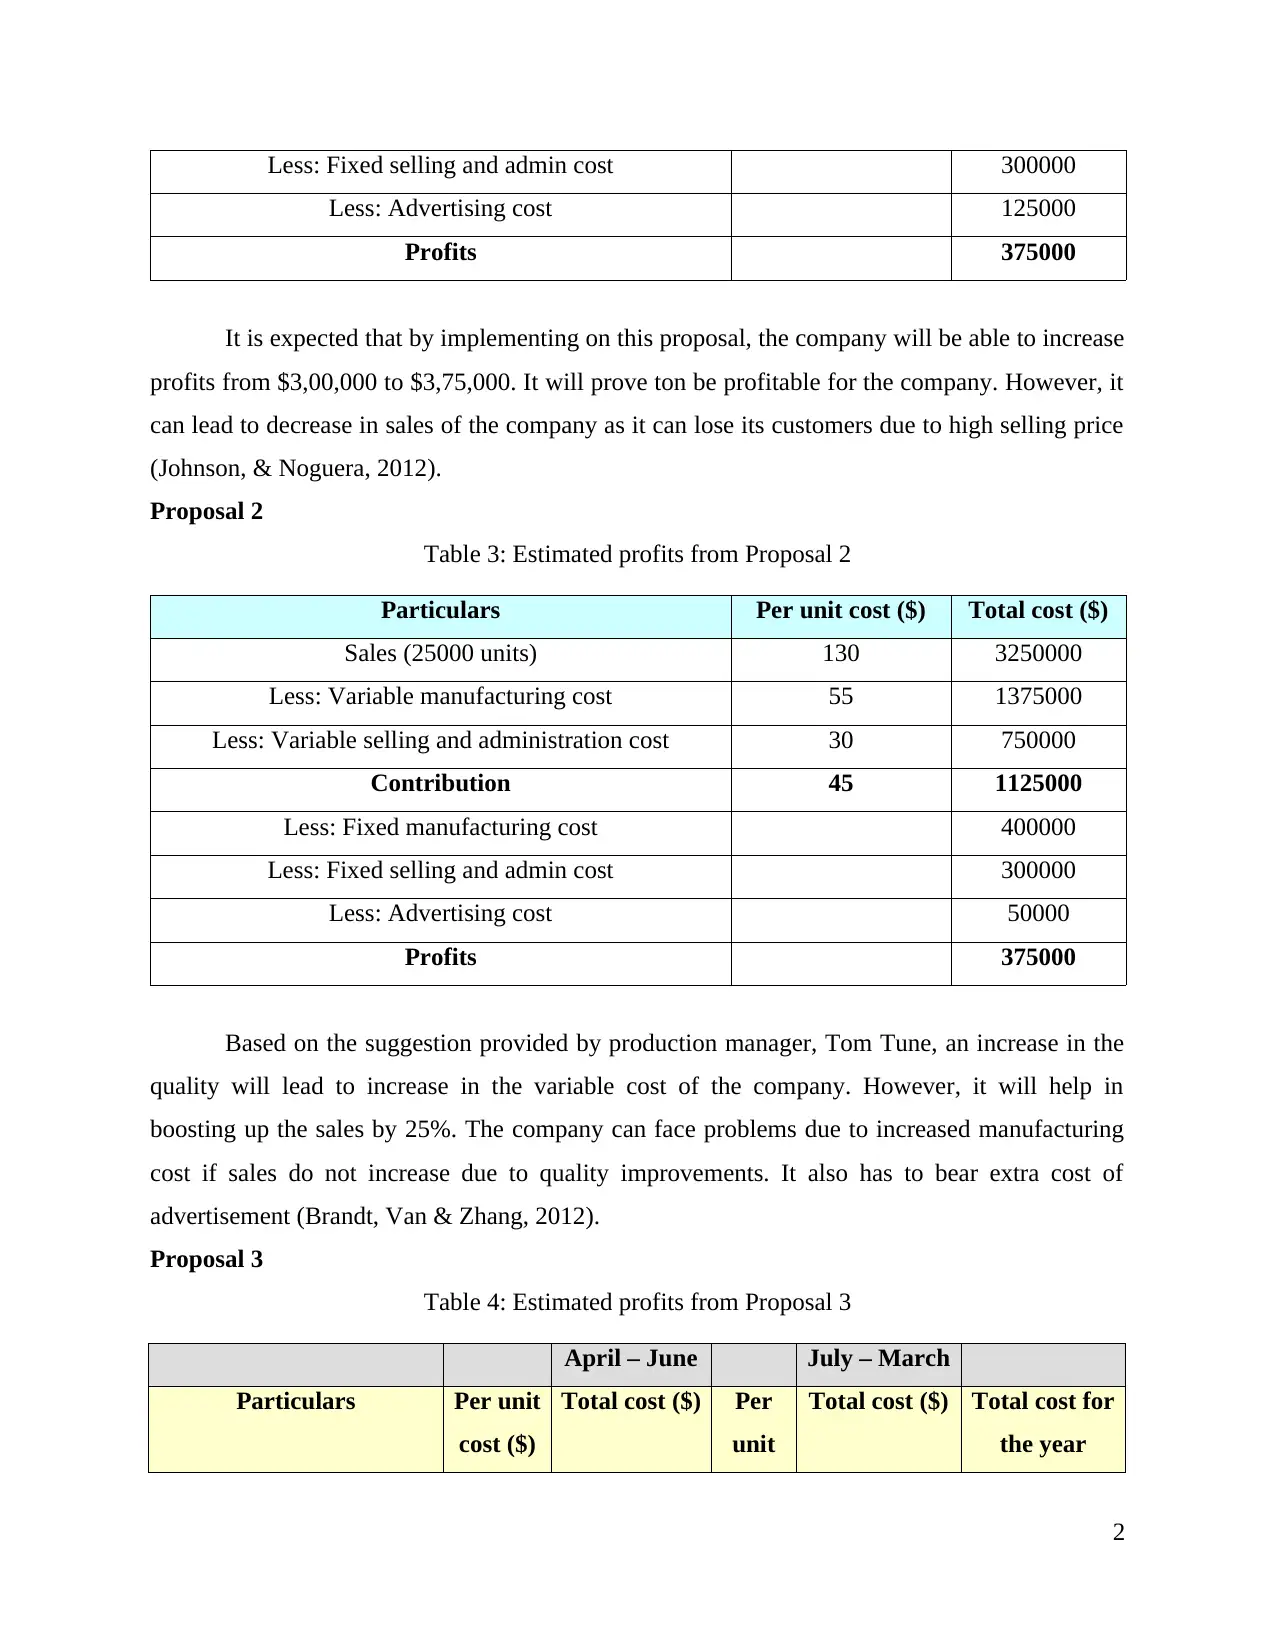
It is expected that by implementing on this proposal, the company will be able to increase
profits from $3,00,000 to $3,75,000. It will prove ton be profitable for the company. However, it
can lead to decrease in sales of the company as it can lose its customers due to high selling price
(Johnson, & Noguera, 2012).
Proposal 2
Table 3: Estimated profits from Proposal 2
Particulars Per unit cost ($) Total cost ($)
Sales (25000 units) 130 3250000
Less: Variable manufacturing cost 55 1375000
Less: Variable selling and administration cost 30 750000
Contribution 45 1125000
Less: Fixed manufacturing cost 400000
Less: Fixed selling and admin cost 300000
Less: Advertising cost 50000
Profits 375000
Based on the suggestion provided by production manager, Tom Tune, an increase in the
quality will lead to increase in the variable cost of the company. However, it will help in
boosting up the sales by 25%. The company can face problems due to increased manufacturing
cost if sales do not increase due to quality improvements. It also has to bear extra cost of
advertisement (Brandt, Van & Zhang, 2012).
Proposal 3
Table 4: Estimated profits from Proposal 3
April – June July – March
Particulars Per unit
cost ($)
Total cost ($) Per
unit
Total cost ($) Total cost for
the year
2
Less: Advertising cost 125000
Profits 375000
It is expected that by implementing on this proposal, the company will be able to increase
profits from $3,00,000 to $3,75,000. It will prove ton be profitable for the company. However, it
can lead to decrease in sales of the company as it can lose its customers due to high selling price
(Johnson, & Noguera, 2012).
Proposal 2
Table 3: Estimated profits from Proposal 2
Particulars Per unit cost ($) Total cost ($)
Sales (25000 units) 130 3250000
Less: Variable manufacturing cost 55 1375000
Less: Variable selling and administration cost 30 750000
Contribution 45 1125000
Less: Fixed manufacturing cost 400000
Less: Fixed selling and admin cost 300000
Less: Advertising cost 50000
Profits 375000
Based on the suggestion provided by production manager, Tom Tune, an increase in the
quality will lead to increase in the variable cost of the company. However, it will help in
boosting up the sales by 25%. The company can face problems due to increased manufacturing
cost if sales do not increase due to quality improvements. It also has to bear extra cost of
advertisement (Brandt, Van & Zhang, 2012).
Proposal 3
Table 4: Estimated profits from Proposal 3
April – June July – March
Particulars Per unit
cost ($)
Total cost ($) Per
unit
Total cost ($) Total cost for
the year
2
cost ($)
Sales (10000 units in April –
June) (14000 units in July –
March)
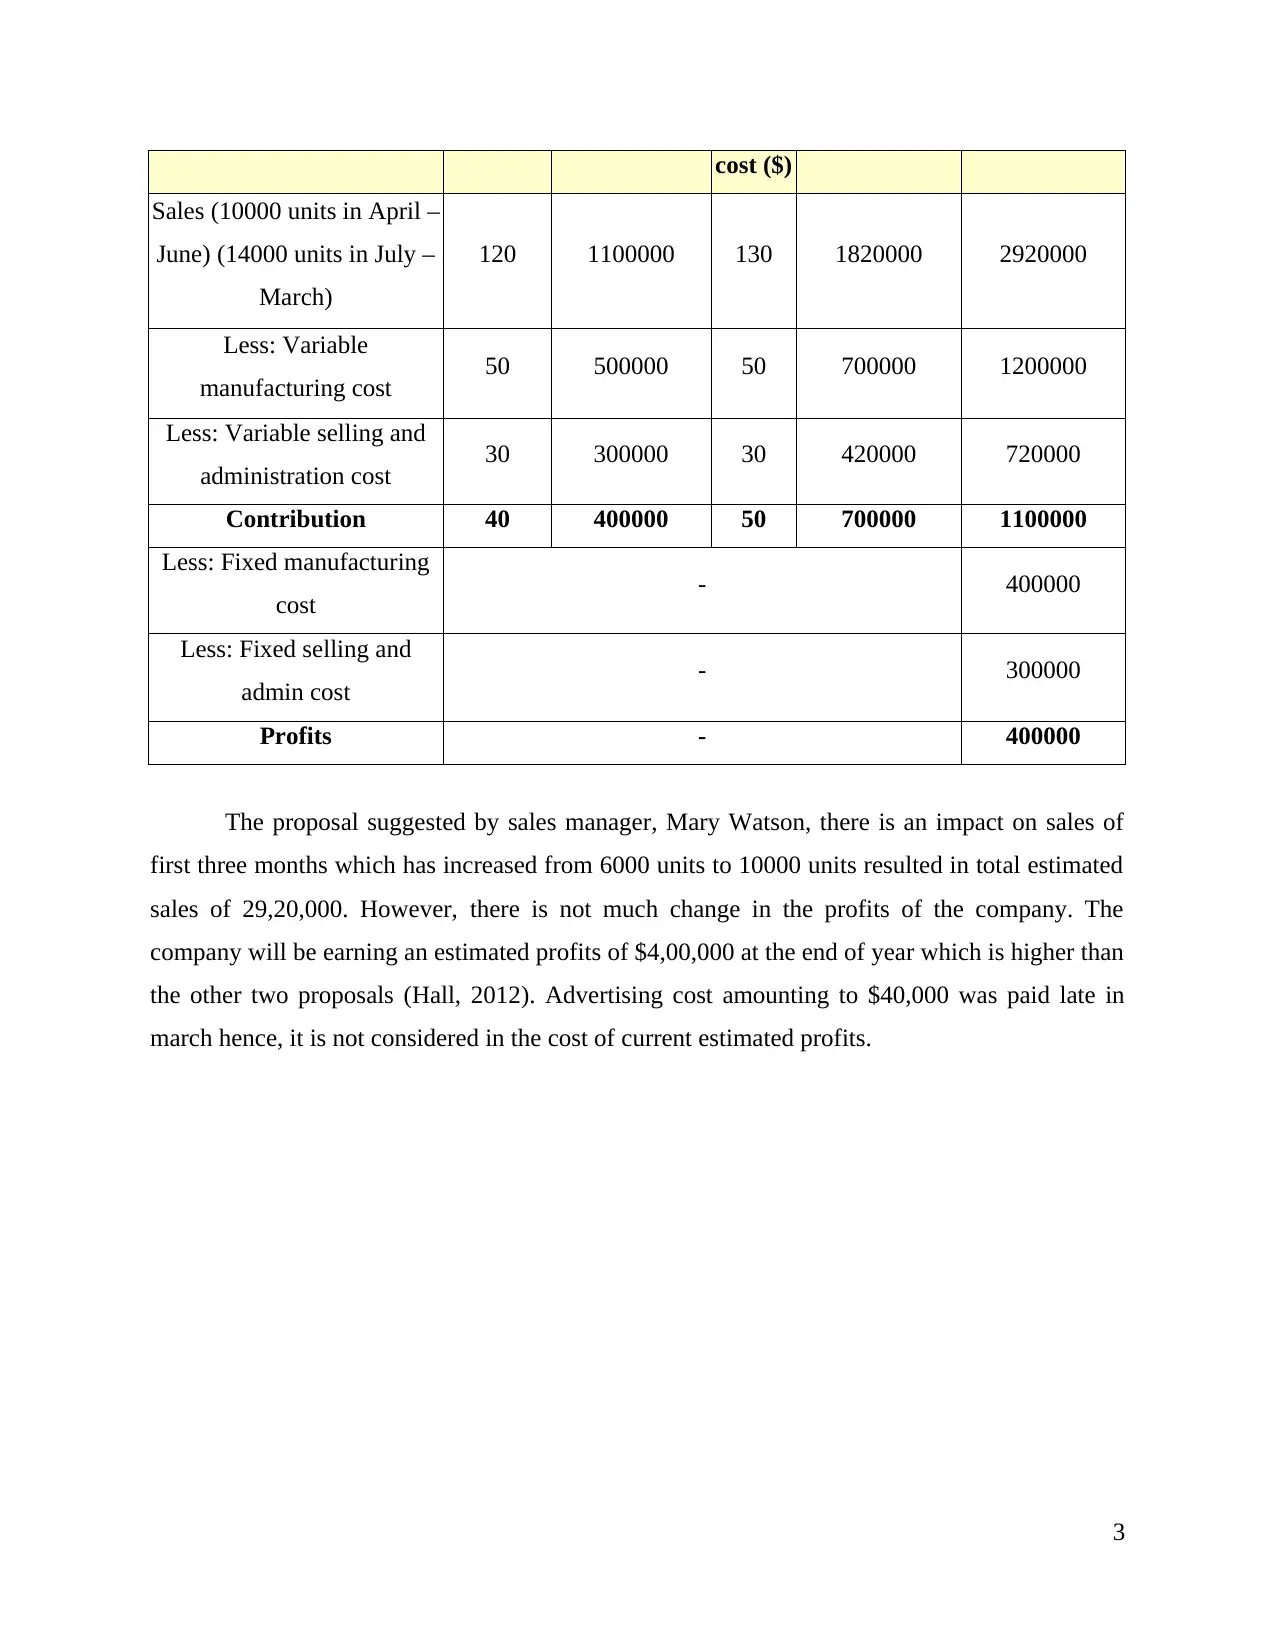
120 1100000 130 1820000 2920000
Less: Variable
manufacturing cost 50 500000 50 700000 1200000
Less: Variable selling and
administration cost 30 300000 30 420000 720000
Contribution 40 400000 50 700000 1100000
Less: Fixed manufacturing
cost - 400000
Less: Fixed selling and
admin cost - 300000
Profits - 400000
The proposal suggested by sales manager, Mary Watson, there is an impact on sales of
first three months which has increased from 6000 units to 10000 units resulted in total estimated
sales of 29,20,000. However, there is not much change in the profits of the company. The
company will be earning an estimated profits of $4,00,000 at the end of year which is higher than
the other two proposals (Hall, 2012). Advertising cost amounting to $40,000 was paid late in
march hence, it is not considered in the cost of current estimated profits.
3
Sales (10000 units in April –
June) (14000 units in July –
March)
120 1100000 130 1820000 2920000
Less: Variable
manufacturing cost 50 500000 50 700000 1200000
Less: Variable selling and
administration cost 30 300000 30 420000 720000
Contribution 40 400000 50 700000 1100000
Less: Fixed manufacturing
cost - 400000
Less: Fixed selling and
admin cost - 300000
Profits - 400000
The proposal suggested by sales manager, Mary Watson, there is an impact on sales of
first three months which has increased from 6000 units to 10000 units resulted in total estimated
sales of 29,20,000. However, there is not much change in the profits of the company. The
company will be earning an estimated profits of $4,00,000 at the end of year which is higher than
the other two proposals (Hall, 2012). Advertising cost amounting to $40,000 was paid late in
march hence, it is not considered in the cost of current estimated profits.
3
⊘ This is a preview!⊘
Do you want full access?
Subscribe today to unlock all pages.
Trusted by 1+ million students worldwide
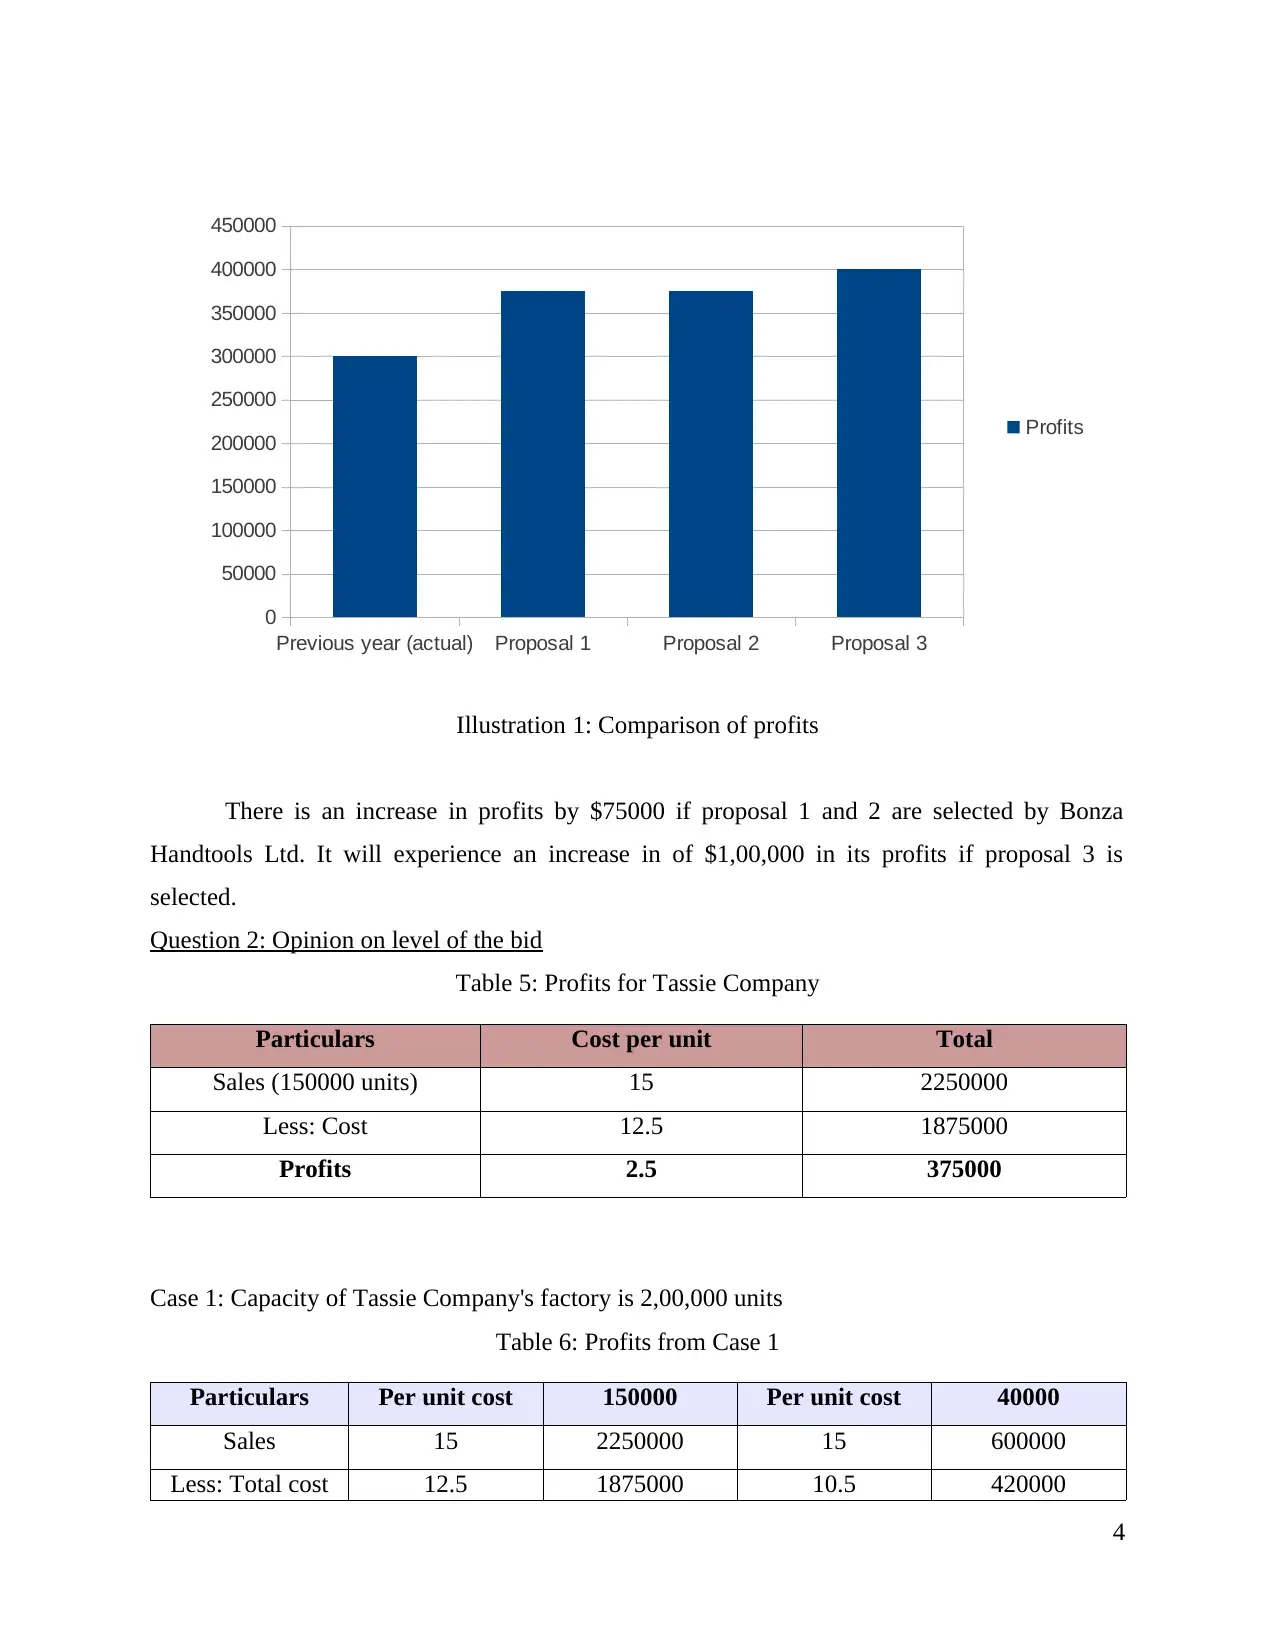
There is an increase in profits by $75000 if proposal 1 and 2 are selected by Bonza
Handtools Ltd. It will experience an increase in of $1,00,000 in its profits if proposal 3 is
selected.
Question 2: Opinion on level of the bid
Table 5: Profits for Tassie Company
Particulars Cost per unit Total
Sales (150000 units) 15 2250000
Less: Cost 12.5 1875000
Profits 2.5 375000
Case 1: Capacity of Tassie Company's factory is 2,00,000 units
Table 6: Profits from Case 1
Particulars Per unit cost 150000 Per unit cost 40000
Sales 15 2250000 15 600000
Less: Total cost 12.5 1875000 10.5 420000
4
Previous year (actual) Proposal 1 Proposal 2 Proposal 3
0
50000
100000
150000
200000
250000
300000
350000
400000
450000
Profits
Illustration 1: Comparison of profits
Paraphrase This Document
Need a fresh take? Get an instant paraphrase of this document with our AI Paraphraser
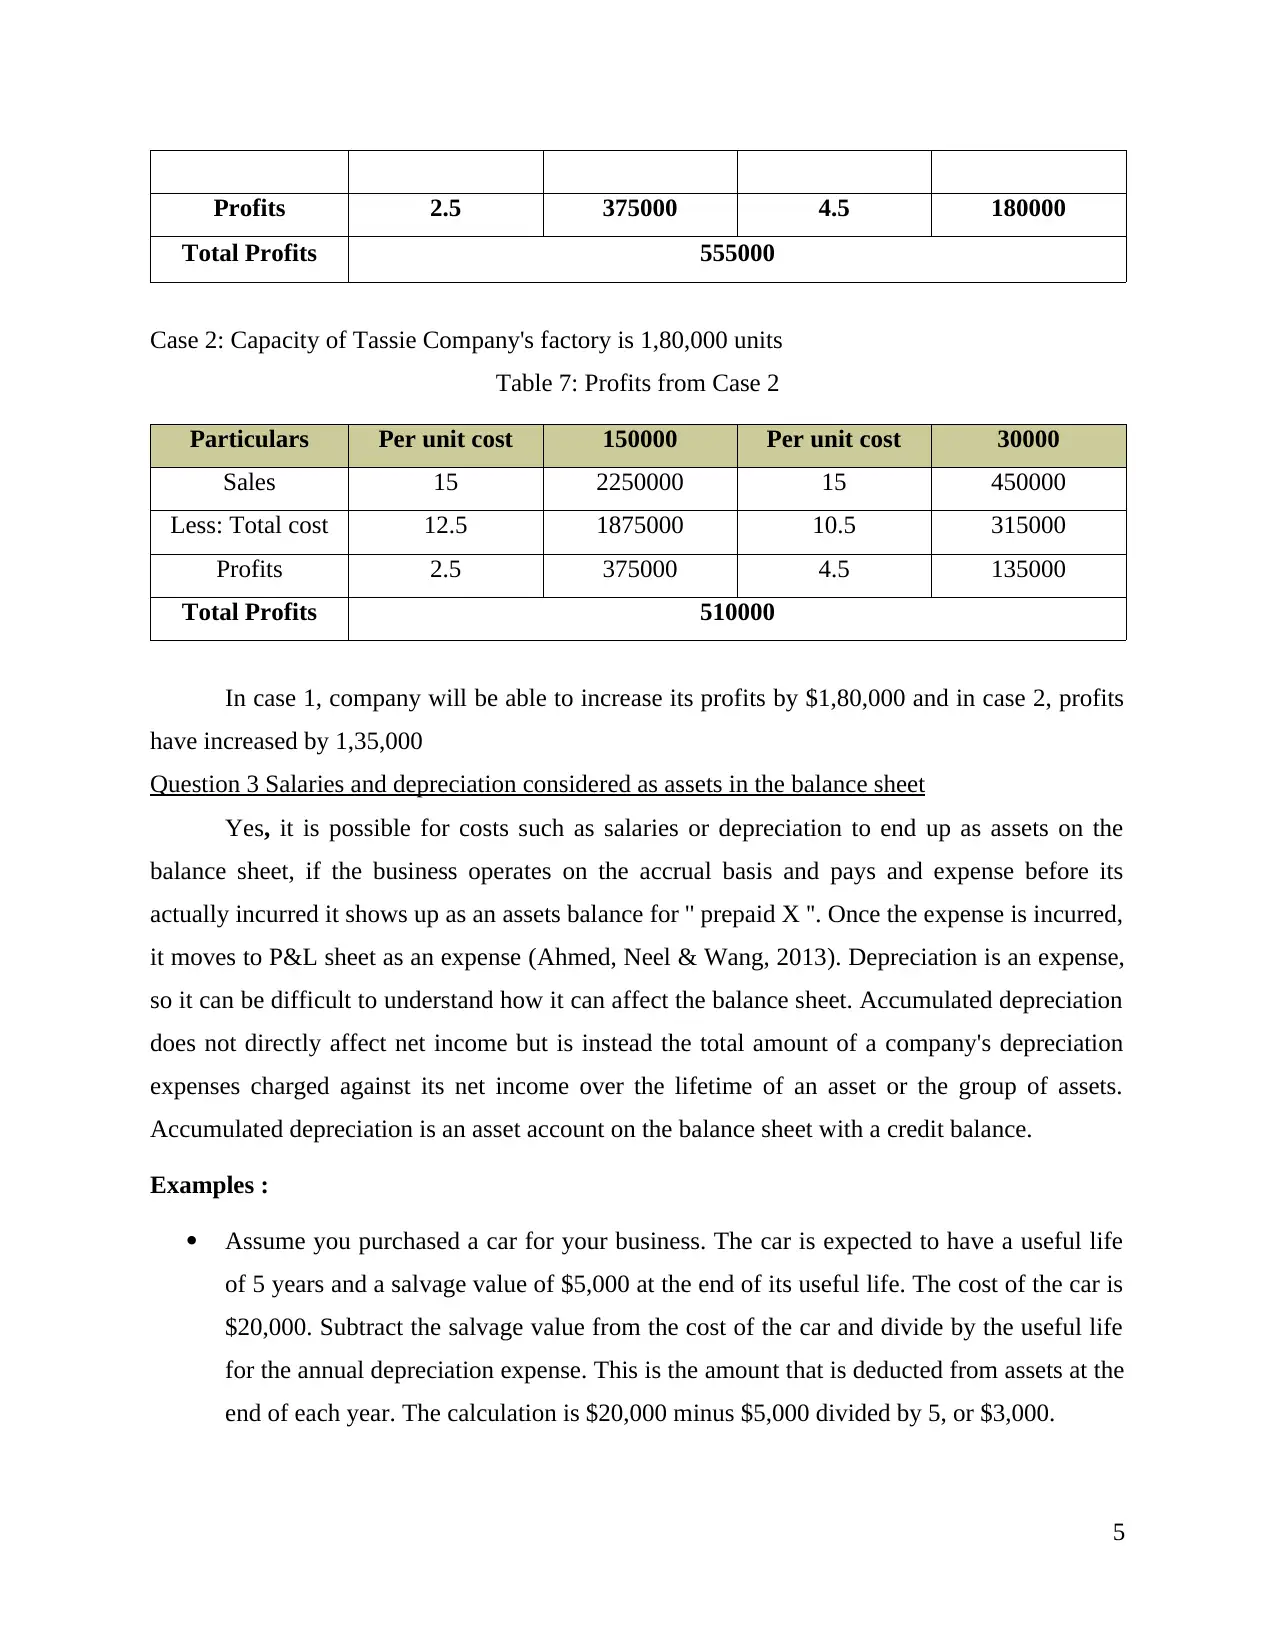
Profits 2.5 375000 4.5 180000
Total Profits 555000
Case 2: Capacity of Tassie Company's factory is 1,80,000 units
Table 7: Profits from Case 2
Particulars Per unit cost 150000 Per unit cost 30000
Sales 15 2250000 15 450000
Less: Total cost 12.5 1875000 10.5 315000
Profits 2.5 375000 4.5 135000
Total Profits 510000
In case 1, company will be able to increase its profits by $1,80,000 and in case 2, profits
have increased by 1,35,000
Question 3 Salaries and depreciation considered as assets in the balance sheet
Yes, it is possible for costs such as salaries or depreciation to end up as assets on the
balance sheet, if the business operates on the accrual basis and pays and expense before its
actually incurred it shows up as an assets balance for '' prepaid X ''. Once the expense is incurred,
it moves to P&L sheet as an expense (Ahmed, Neel & Wang, 2013). Depreciation is an expense,
so it can be difficult to understand how it can affect the balance sheet. Accumulated depreciation
does not directly affect net income but is instead the total amount of a company's depreciation
expenses charged against its net income over the lifetime of an asset or the group of assets.
Accumulated depreciation is an asset account on the balance sheet with a credit balance.
Examples :
Assume you purchased a car for your business. The car is expected to have a useful life
of 5 years and a salvage value of $5,000 at the end of its useful life. The cost of the car is
$20,000. Subtract the salvage value from the cost of the car and divide by the useful life
for the annual depreciation expense. This is the amount that is deducted from assets at the
end of each year. The calculation is $20,000 minus $5,000 divided by 5, or $3,000.
5
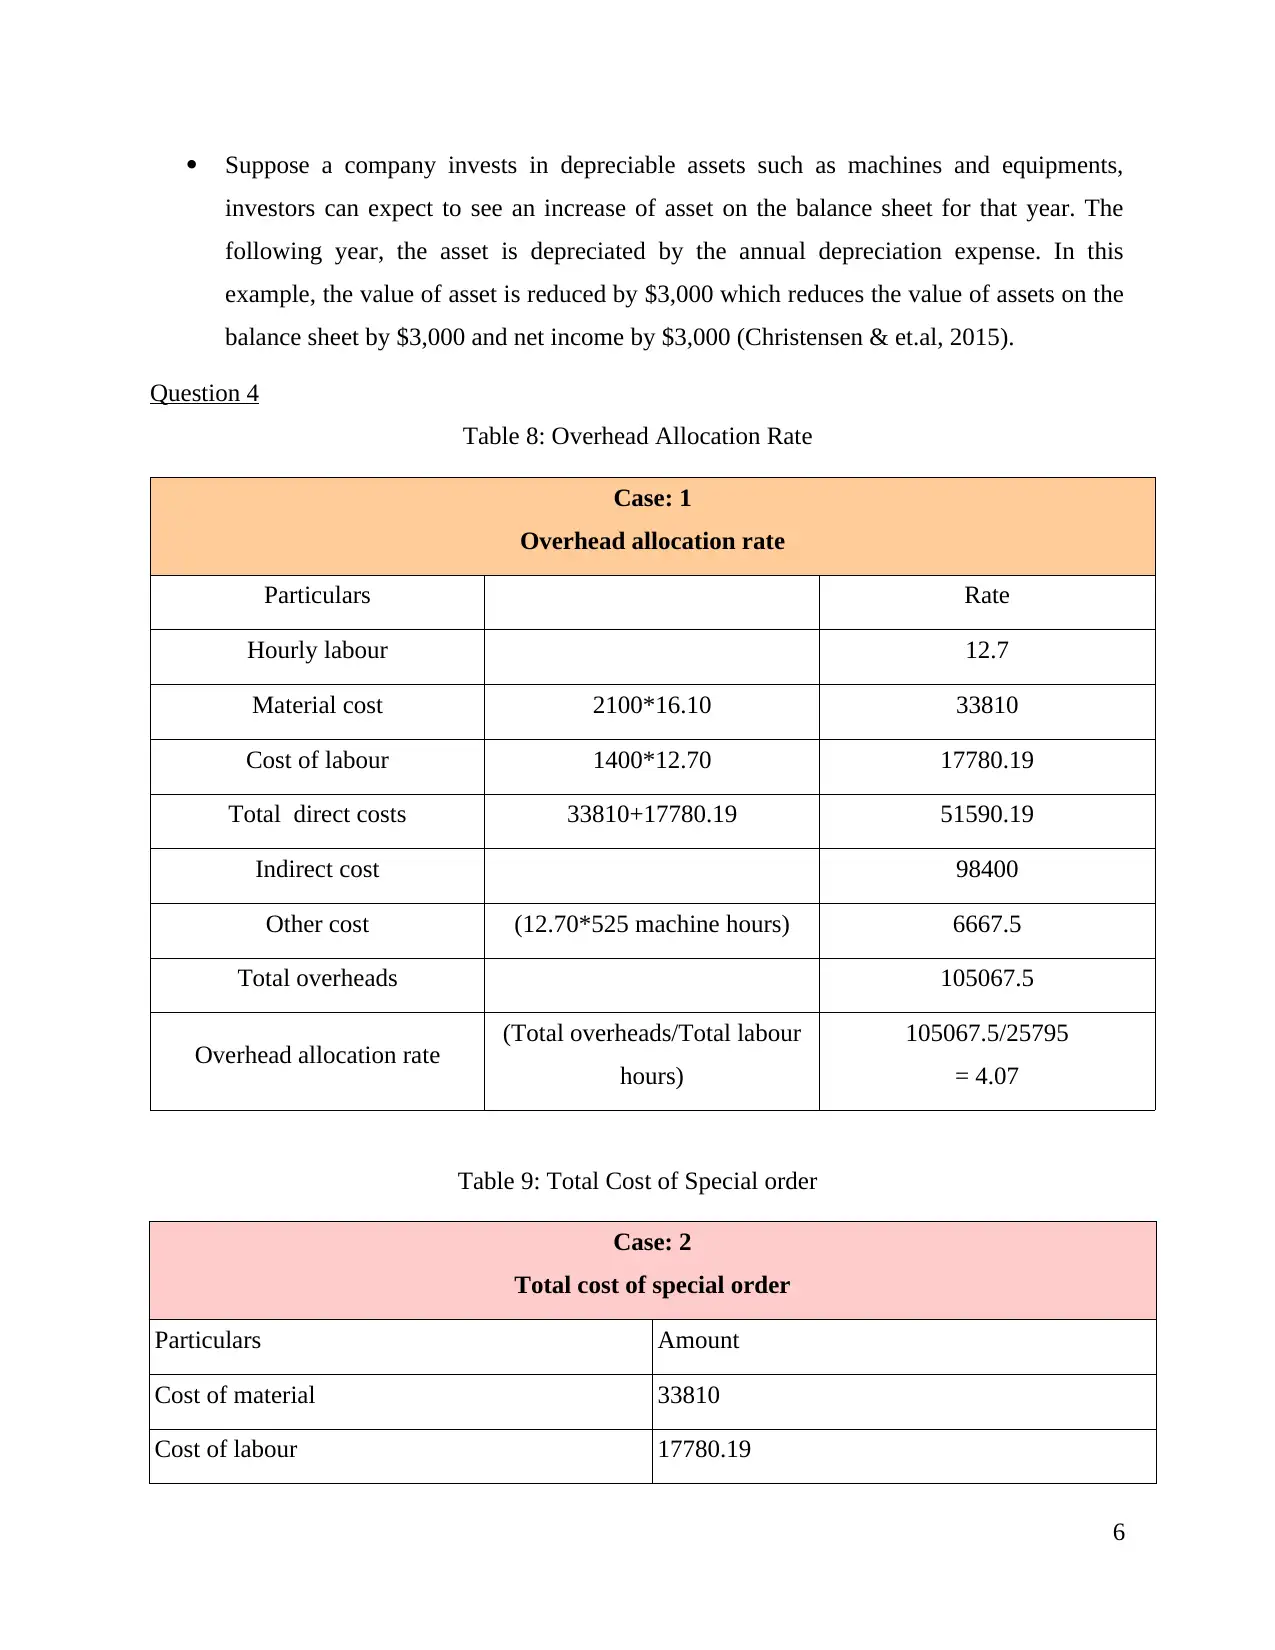
Suppose a company invests in depreciable assets such as machines and equipments,
investors can expect to see an increase of asset on the balance sheet for that year. The
following year, the asset is depreciated by the annual depreciation expense. In this
example, the value of asset is reduced by $3,000 which reduces the value of assets on the
balance sheet by $3,000 and net income by $3,000 (Christensen & et.al, 2015).
Question 4
Table 8: Overhead Allocation Rate
Case: 1
Overhead allocation rate
Particulars Rate
Hourly labour 12.7
Material cost 2100*16.10 33810
Cost of labour 1400*12.70 17780.19
Total direct costs 33810+17780.19 51590.19
Indirect cost 98400
Other cost (12.70*525 machine hours) 6667.5
Total overheads 105067.5
Overhead allocation rate (Total overheads/Total labour
hours)
105067.5/25795
= 4.07
Table 9: Total Cost of Special order
Case: 2
Total cost of special order
Particulars Amount
Cost of material 33810
Cost of labour 17780.19
6
⊘ This is a preview!⊘
Do you want full access?
Subscribe today to unlock all pages.
Trusted by 1+ million students worldwide
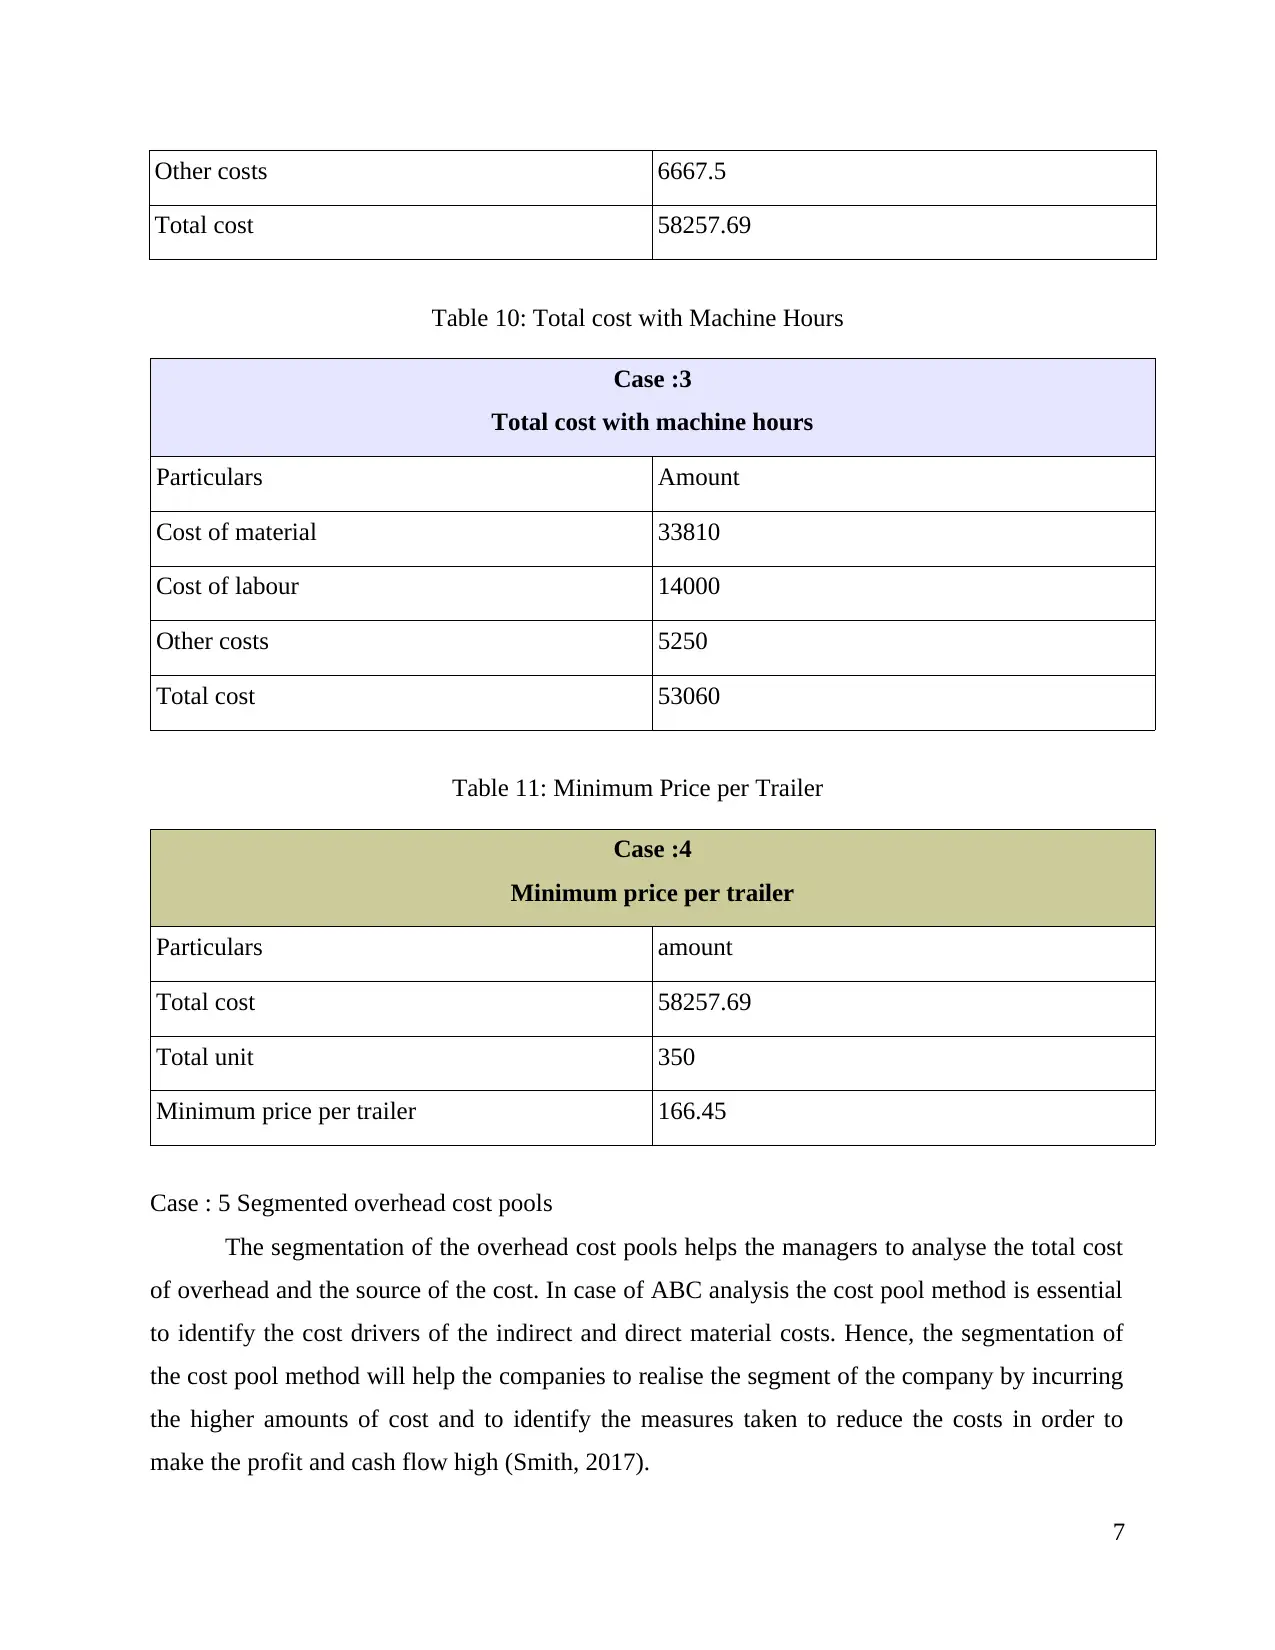
Other costs 6667.5
Total cost 58257.69
Table 10: Total cost with Machine Hours
Case :3
Total cost with machine hours
Particulars Amount
Cost of material 33810
Cost of labour 14000
Other costs 5250
Total cost 53060
Table 11: Minimum Price per Trailer
Case :4
Minimum price per trailer
Particulars amount
Total cost 58257.69
Total unit 350
Minimum price per trailer 166.45
Case : 5 Segmented overhead cost pools
The segmentation of the overhead cost pools helps the managers to analyse the total cost
of overhead and the source of the cost. In case of ABC analysis the cost pool method is essential
to identify the cost drivers of the indirect and direct material costs. Hence, the segmentation of
the cost pool method will help the companies to realise the segment of the company by incurring
the higher amounts of cost and to identify the measures taken to reduce the costs in order to
make the profit and cash flow high (Smith, 2017).
7
Total cost 58257.69
Table 10: Total cost with Machine Hours
Case :3
Total cost with machine hours
Particulars Amount
Cost of material 33810
Cost of labour 14000
Other costs 5250
Total cost 53060
Table 11: Minimum Price per Trailer
Case :4
Minimum price per trailer
Particulars amount
Total cost 58257.69
Total unit 350
Minimum price per trailer 166.45
Case : 5 Segmented overhead cost pools
The segmentation of the overhead cost pools helps the managers to analyse the total cost
of overhead and the source of the cost. In case of ABC analysis the cost pool method is essential
to identify the cost drivers of the indirect and direct material costs. Hence, the segmentation of
the cost pool method will help the companies to realise the segment of the company by incurring
the higher amounts of cost and to identify the measures taken to reduce the costs in order to
make the profit and cash flow high (Smith, 2017).
7
Paraphrase This Document
Need a fresh take? Get an instant paraphrase of this document with our AI Paraphraser
CONCLUSION
Based on the above report, it can be concluded that it is important to correctly analyse the
selling price and cost in order to attain maximum profits for the organization (Weil, Schipper &
Francis, 2013). The entity should consider all aspect related to sales before deciding advertising
budget for itself. Salaries and depreciation can be considered as an asset for the entity if amounts
have been paid in advance.
8
REFERENCES
Books and Journals
Ahmed, A. S., Neel, M. & Wang, D. (2013). Does mandatory adoption of IFRS improve
accounting quality? Preliminary evidence. Contemporary Accounting Research. 30(4).
1344-1372.
Brandt, L., Van Biesebroeck, J. & Zhang, Y. (2012). Creative accounting or creative
destruction? Firm-level productivity growth in Chinese manufacturing. Journal of
development economics. 97(2). 339-351.
Christensen, H. B. & et.al. (2015). Incentives or standards: What determines accounting quality
changes around IFRS adoption?. European Accounting Review. 24(1). 31-61.
Hall, J. A. (2012). Accounting information systems. Cengage Learning.
Johnson, R. C. & Noguera, G. (2012). Accounting for intermediates: Production sharing and
trade in value added. Journal of international Economics. 86(2). 224-236.
Romney, M. B. & Steinbart, P. J. (2012). Accounting information systems. Boston: Pearson.
Smith, M. (2017). Research methods in accounting. Sage.
Weil, R. L., Schipper, K. & Francis, J. (2013). Financial accounting: an introduction to
concepts, methods and uses. Cengage Learning.
9
⊘ This is a preview!⊘
Do you want full access?
Subscribe today to unlock all pages.
Trusted by 1+ million students worldwide
1 out of 12
Related Documents


Your All-in-One AI-Powered Toolkit for Academic Success.
+13062052269
info@desklib.com
Available 24*7 on WhatsApp / Email
![[object Object]](/_next/static/media/star-bottom.7253800d.svg)
Unlock your academic potential
Copyright © 2020–2026 A2Z Services. All Rights Reserved. Developed and managed by ZUCOL.