Bonza Handtools Ltd. Project: Profitability and Cost Analysis Report
VerifiedAdded on 2020/05/28
|8
|2391
|280
Project
AI Summary
This project analyzes the financial performance of Bonza Handtools Ltd., focusing on improving profitability through various proposals. The first part evaluates three suggestions from senior staff, including price increases, product quality enhancements, and promotional campaigns, using variance analysis to compare their impacts on profit. The second part provides cost and profit analysis under different scenarios, considering factory capacity and pricing strategies. The third part addresses overhead allocation, comparing traditional and activity-based costing methods, and calculating overhead rates. The final part elaborates on the application of activity-based costing, explaining its segmentation of overheads, identification of cost drivers, and advantages over traditional methods, using Toyota as an example. The project provides a comprehensive overview of financial analysis, cost management, and strategic decision-making within a business context.
Solution-1
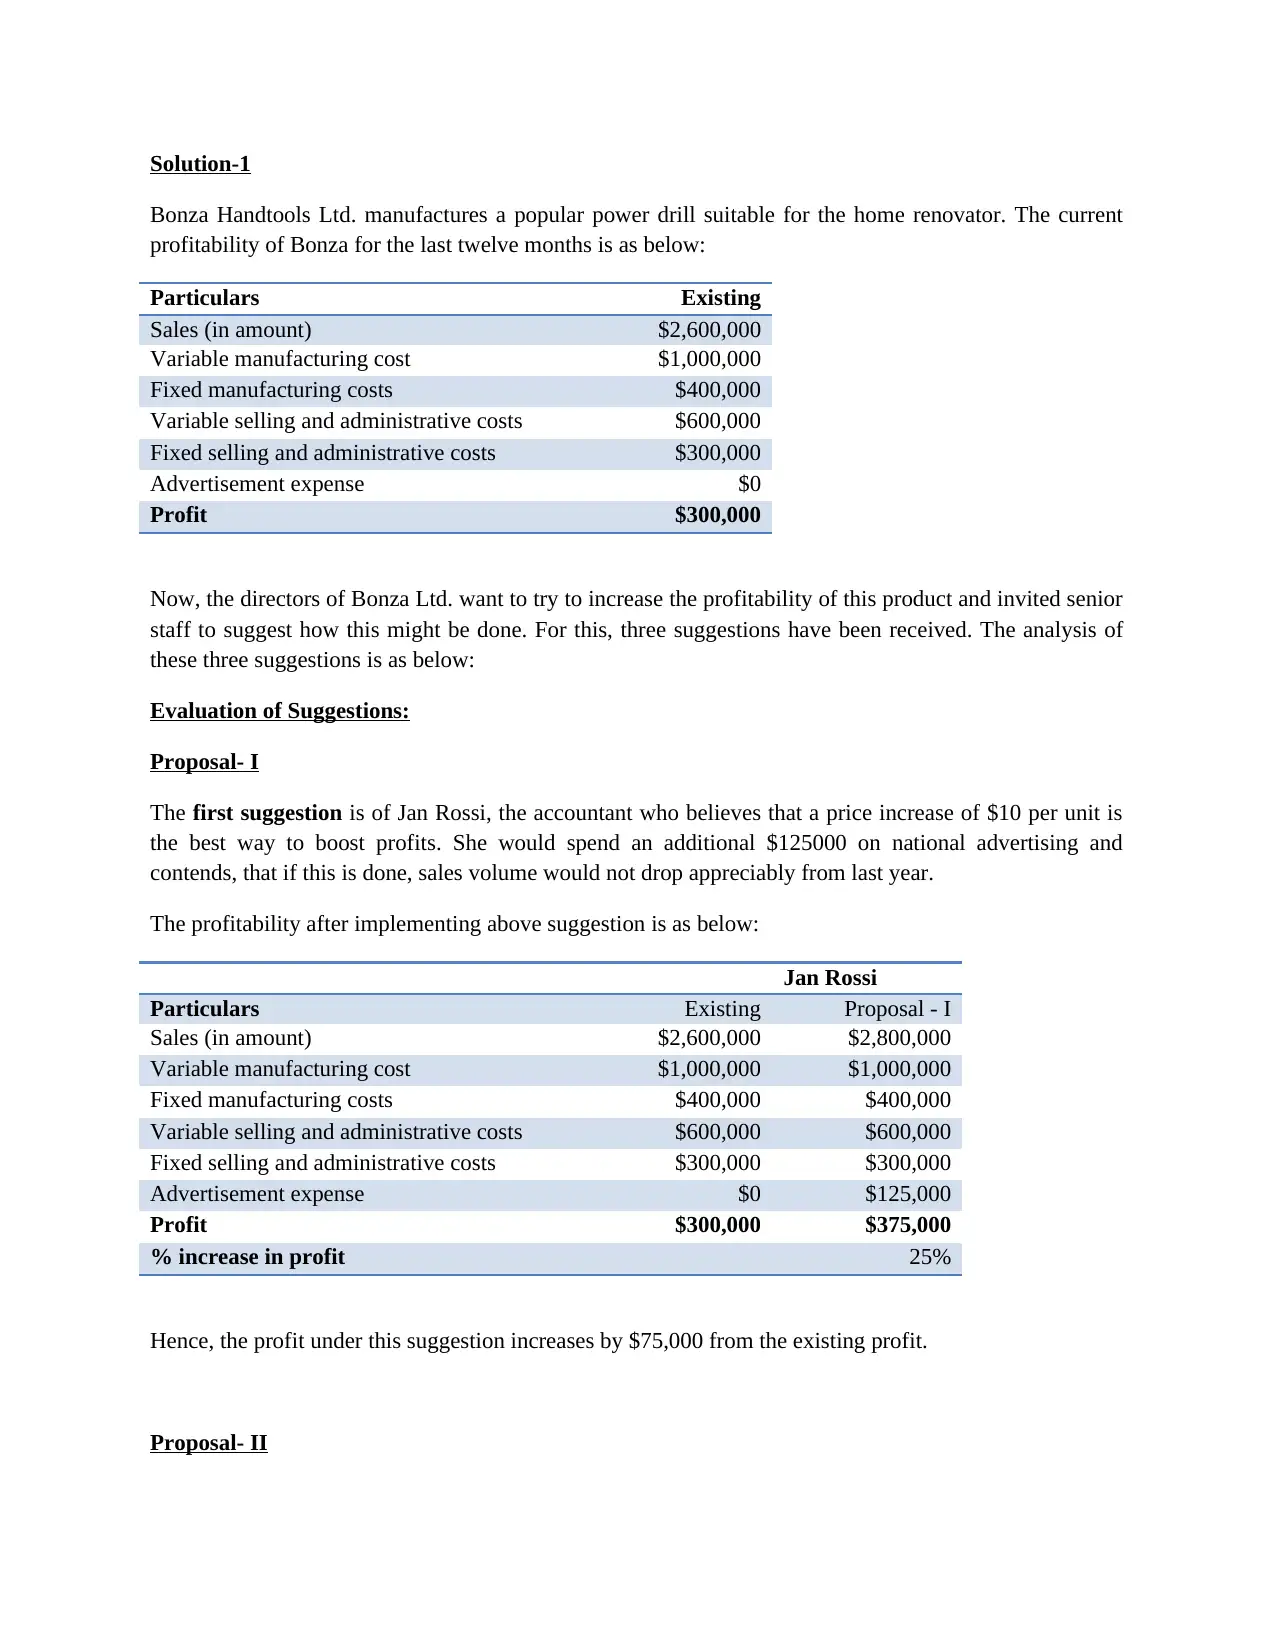
Bonza Handtools Ltd. manufactures a popular power drill suitable for the home renovator. The current
profitability of Bonza for the last twelve months is as below:
Particulars Existing
Sales (in amount) $2,600,000
Variable manufacturing cost $1,000,000
Fixed manufacturing costs $400,000
Variable selling and administrative costs $600,000
Fixed selling and administrative costs $300,000
Advertisement expense $0
Profit $300,000
Now, the directors of Bonza Ltd. want to try to increase the profitability of this product and invited senior
staff to suggest how this might be done. For this, three suggestions have been received. The analysis of
these three suggestions is as below:
Evaluation of Suggestions:
Proposal- I
The first suggestion is of Jan Rossi, the accountant who believes that a price increase of $10 per unit is
the best way to boost profits. She would spend an additional $125000 on national advertising and
contends, that if this is done, sales volume would not drop appreciably from last year.
The profitability after implementing above suggestion is as below:
Jan Rossi
Particulars Existing Proposal - I
Sales (in amount) $2,600,000 $2,800,000
Variable manufacturing cost $1,000,000 $1,000,000
Fixed manufacturing costs $400,000 $400,000
Variable selling and administrative costs $600,000 $600,000
Fixed selling and administrative costs $300,000 $300,000
Advertisement expense $0 $125,000
Profit $300,000 $375,000
% increase in profit 25%
Hence, the profit under this suggestion increases by $75,000 from the existing profit.
Proposal- II
Paraphrase This Document
Need a fresh take? Get an instant paraphrase of this document with our AI Paraphraser
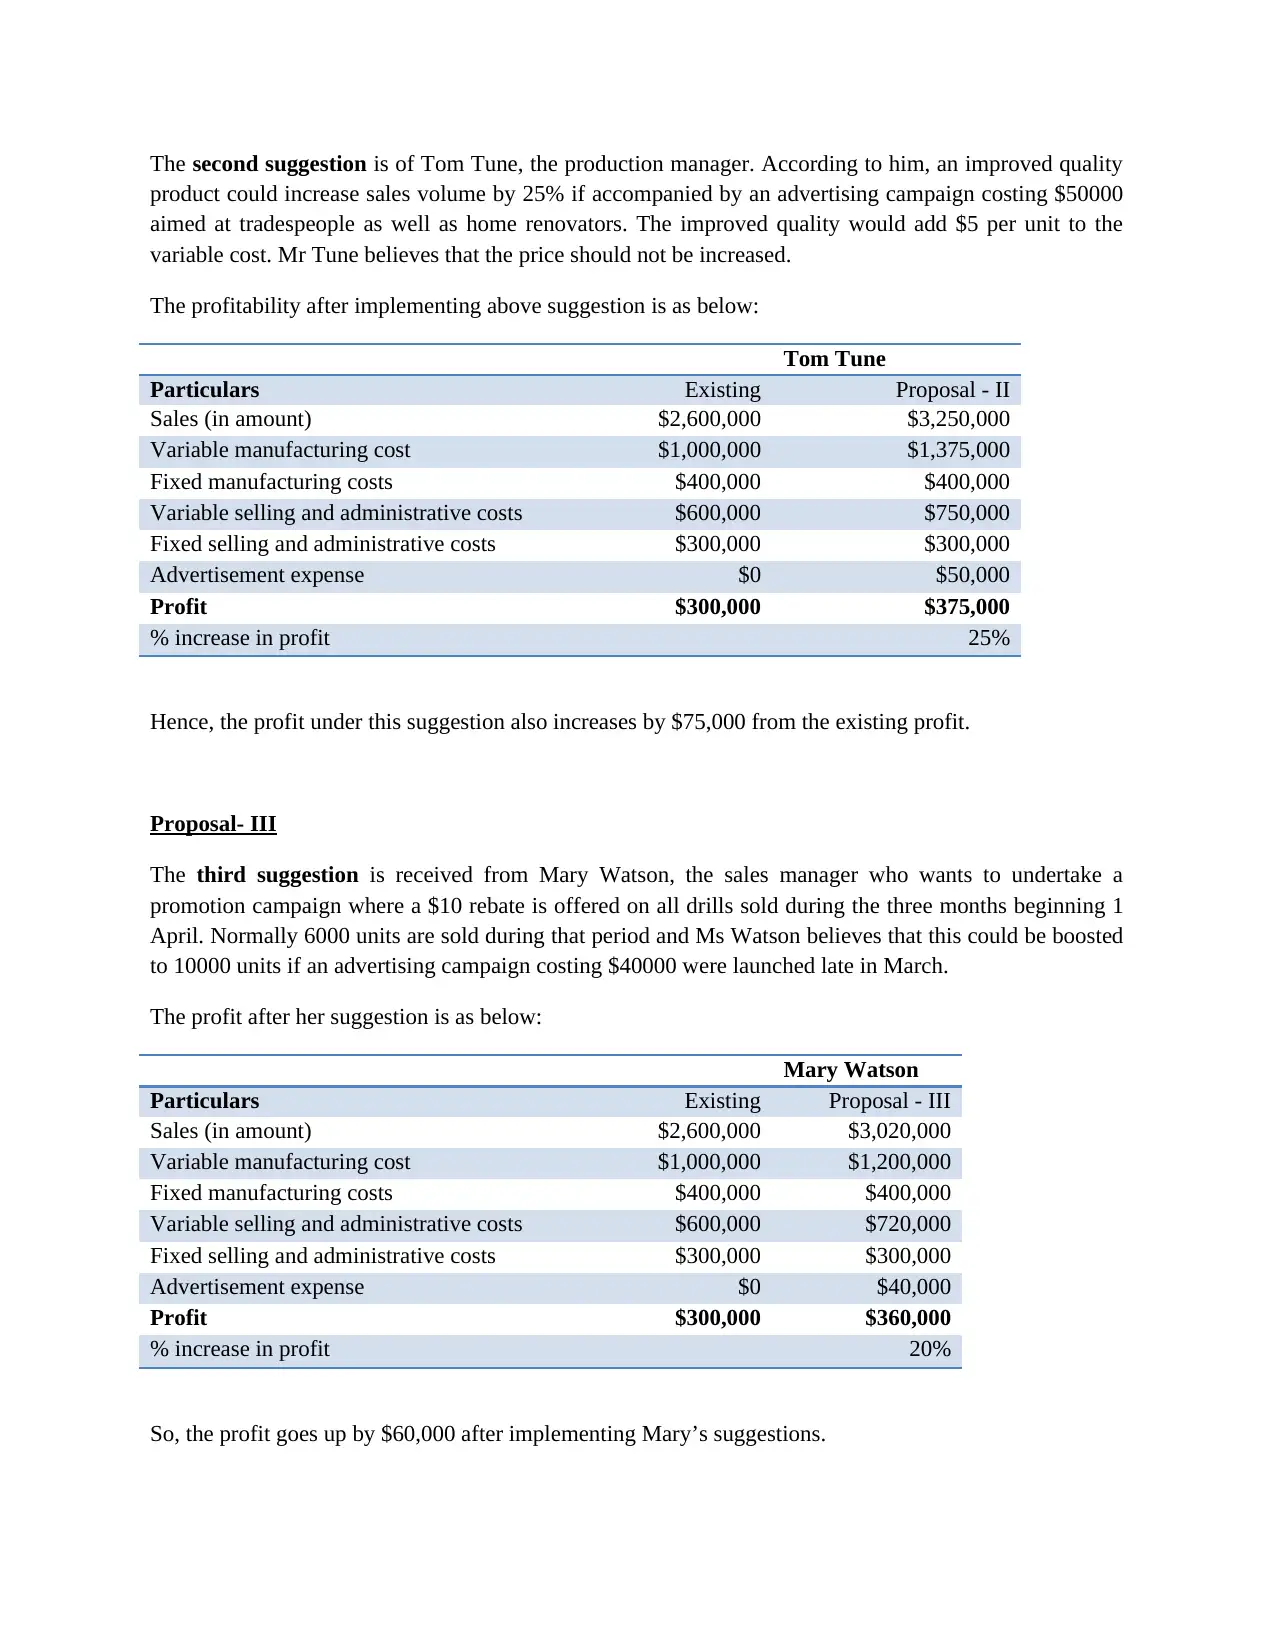
The second suggestion is of Tom Tune, the production manager. According to him, an improved quality
product could increase sales volume by 25% if accompanied by an advertising campaign costing $50000
aimed at tradespeople as well as home renovators. The improved quality would add $5 per unit to the
variable cost. Mr Tune believes that the price should not be increased.
The profitability after implementing above suggestion is as below:
Tom Tune
Particulars Existing Proposal - II
Sales (in amount) $2,600,000 $3,250,000
Variable manufacturing cost $1,000,000 $1,375,000
Fixed manufacturing costs $400,000 $400,000
Variable selling and administrative costs $600,000 $750,000
Fixed selling and administrative costs $300,000 $300,000
Advertisement expense $0 $50,000
Profit $300,000 $375,000
% increase in profit 25%
Hence, the profit under this suggestion also increases by $75,000 from the existing profit.
Proposal- III
The third suggestion is received from Mary Watson, the sales manager who wants to undertake a
promotion campaign where a $10 rebate is offered on all drills sold during the three months beginning 1
April. Normally 6000 units are sold during that period and Ms Watson believes that this could be boosted
to 10000 units if an advertising campaign costing $40000 were launched late in March.
The profit after her suggestion is as below:
Mary Watson
Particulars Existing Proposal - III
Sales (in amount) $2,600,000 $3,020,000
Variable manufacturing cost $1,000,000 $1,200,000
Fixed manufacturing costs $400,000 $400,000
Variable selling and administrative costs $600,000 $720,000
Fixed selling and administrative costs $300,000 $300,000
Advertisement expense $0 $40,000
Profit $300,000 $360,000
% increase in profit 20%
So, the profit goes up by $60,000 after implementing Mary’s suggestions.
Variations due to above suggestions
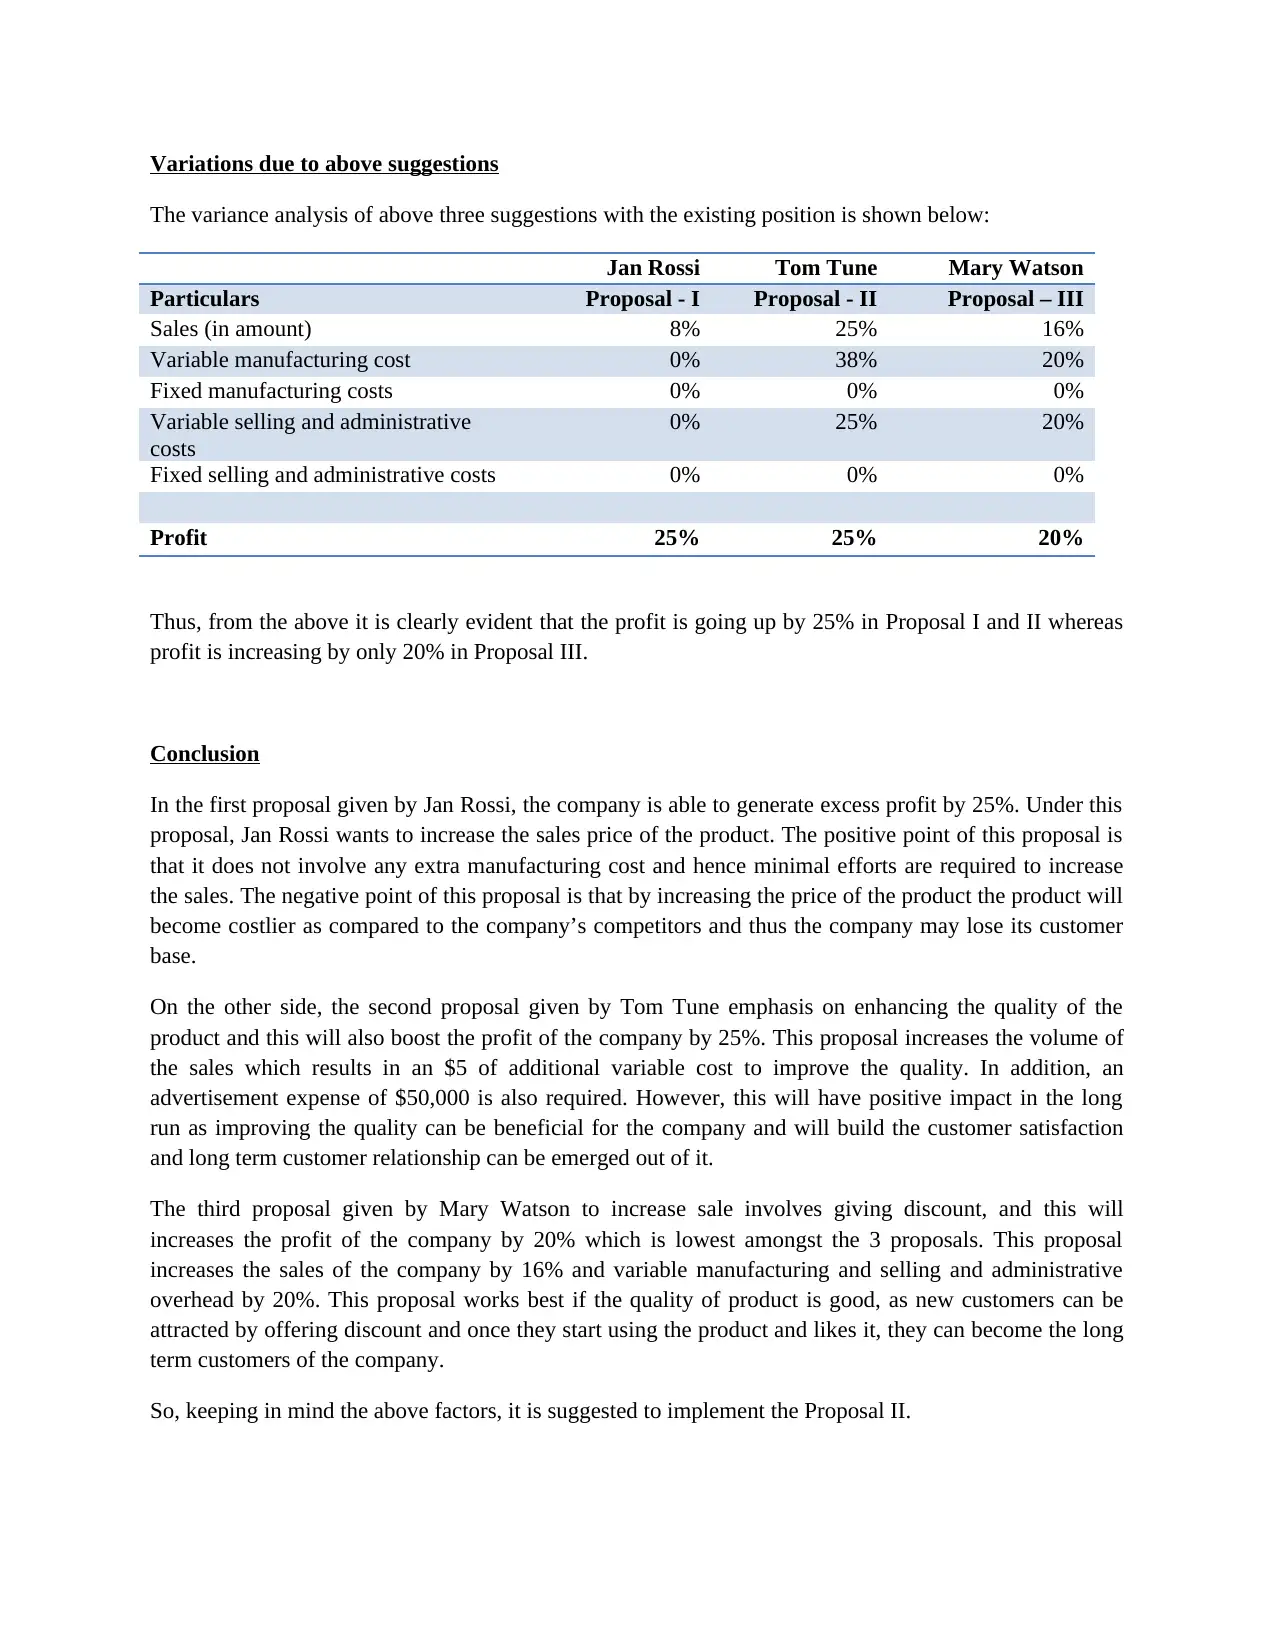
The variance analysis of above three suggestions with the existing position is shown below:
Jan Rossi Tom Tune Mary Watson
Particulars Proposal - I Proposal - II Proposal – III
Sales (in amount) 8% 25% 16%
Variable manufacturing cost 0% 38% 20%
Fixed manufacturing costs 0% 0% 0%
Variable selling and administrative
costs
0% 25% 20%
Fixed selling and administrative costs 0% 0% 0%
Profit 25% 25% 20%
Thus, from the above it is clearly evident that the profit is going up by 25% in Proposal I and II whereas
profit is increasing by only 20% in Proposal III.
Conclusion
In the first proposal given by Jan Rossi, the company is able to generate excess profit by 25%. Under this
proposal, Jan Rossi wants to increase the sales price of the product. The positive point of this proposal is
that it does not involve any extra manufacturing cost and hence minimal efforts are required to increase
the sales. The negative point of this proposal is that by increasing the price of the product the product will
become costlier as compared to the company’s competitors and thus the company may lose its customer
base.
On the other side, the second proposal given by Tom Tune emphasis on enhancing the quality of the
product and this will also boost the profit of the company by 25%. This proposal increases the volume of
the sales which results in an $5 of additional variable cost to improve the quality. In addition, an
advertisement expense of $50,000 is also required. However, this will have positive impact in the long
run as improving the quality can be beneficial for the company and will build the customer satisfaction
and long term customer relationship can be emerged out of it.
The third proposal given by Mary Watson to increase sale involves giving discount, and this will
increases the profit of the company by 20% which is lowest amongst the 3 proposals. This proposal
increases the sales of the company by 16% and variable manufacturing and selling and administrative
overhead by 20%. This proposal works best if the quality of product is good, as new customers can be
attracted by offering discount and once they start using the product and likes it, they can become the long
term customers of the company.
So, keeping in mind the above factors, it is suggested to implement the Proposal II.
⊘ This is a preview!⊘
Do you want full access?
Subscribe today to unlock all pages.
Trusted by 1+ million students worldwide
Solution-2
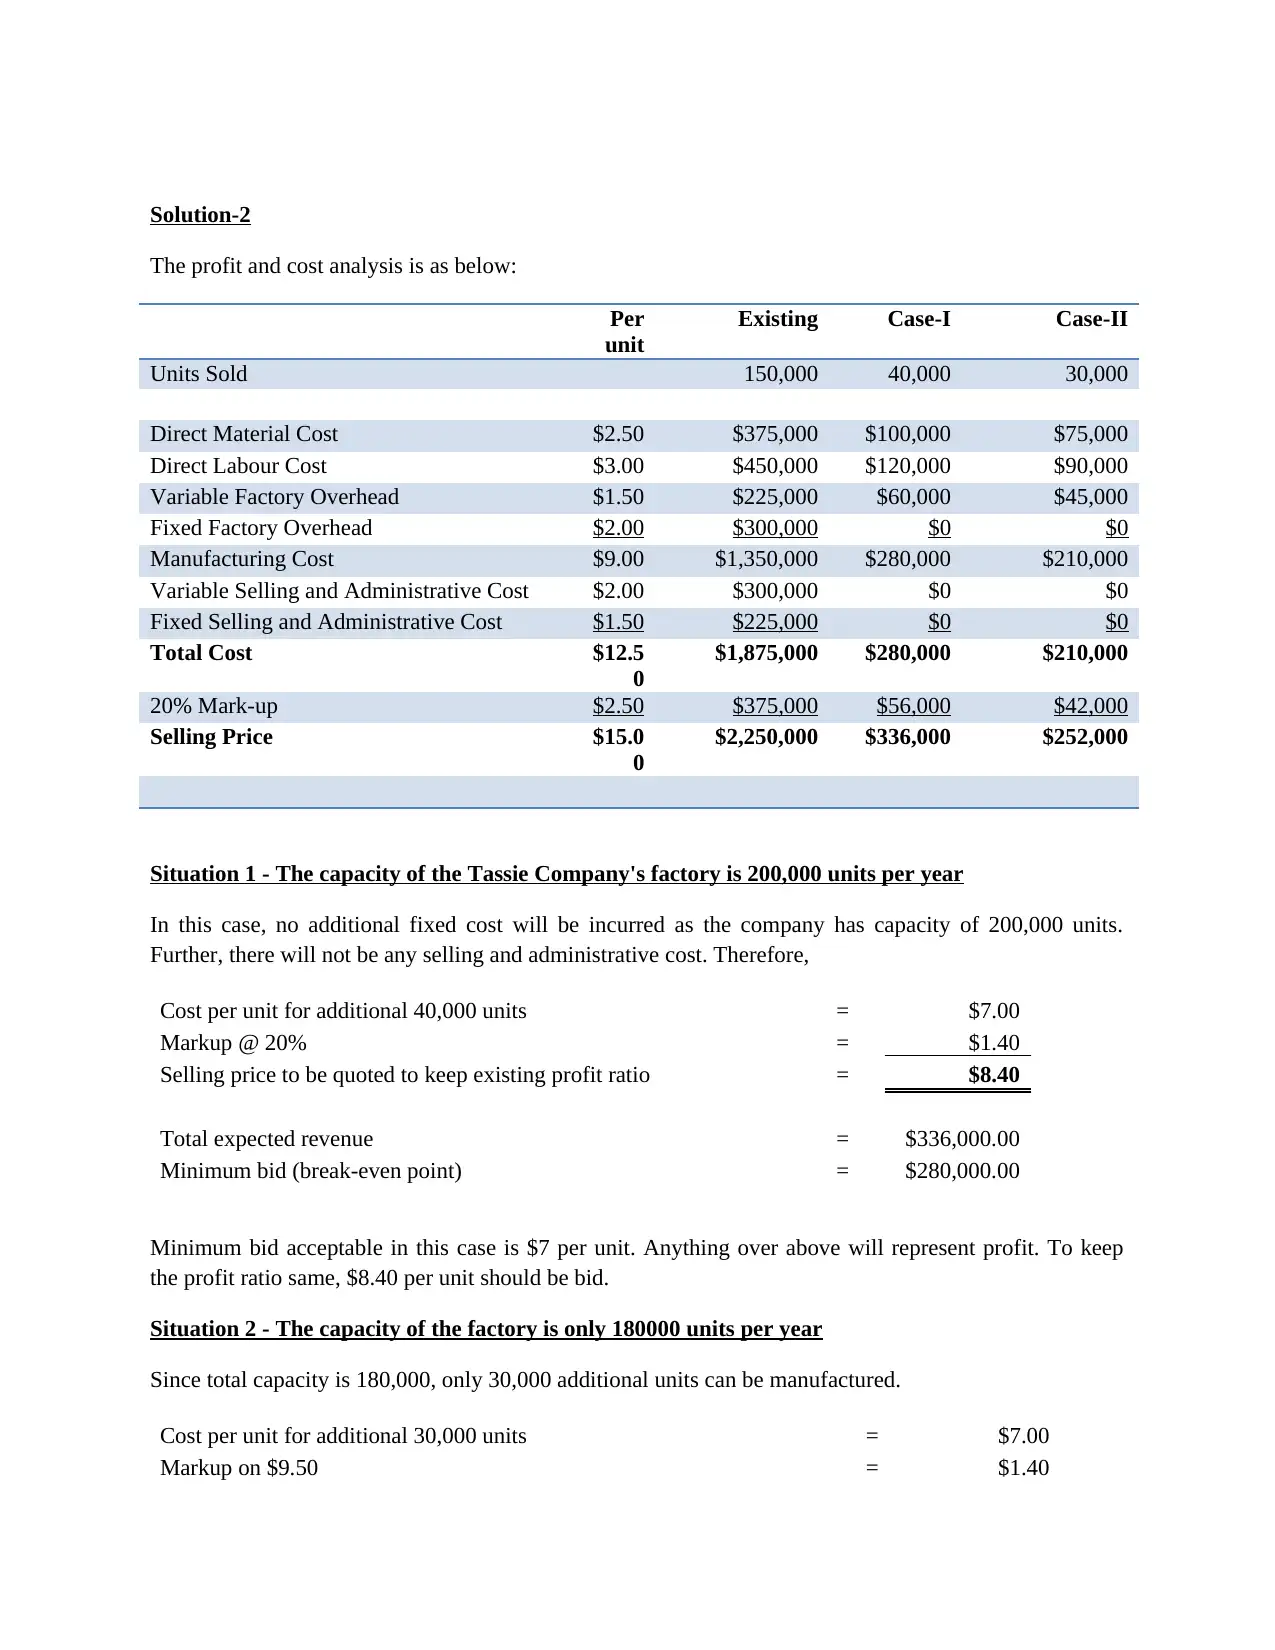
The profit and cost analysis is as below:
Per
unit
Existing Case-I Case-II
Units Sold 150,000 40,000 30,000
Direct Material Cost $2.50 $375,000 $100,000 $75,000
Direct Labour Cost $3.00 $450,000 $120,000 $90,000
Variable Factory Overhead $1.50 $225,000 $60,000 $45,000
Fixed Factory Overhead $2.00 $300,000 $0 $0
Manufacturing Cost $9.00 $1,350,000 $280,000 $210,000
Variable Selling and Administrative Cost $2.00 $300,000 $0 $0
Fixed Selling and Administrative Cost $1.50 $225,000 $0 $0
Total Cost $12.5
0
$1,875,000 $280,000 $210,000
20% Mark-up $2.50 $375,000 $56,000 $42,000
Selling Price $15.0
0
$2,250,000 $336,000 $252,000
Situation 1 - The capacity of the Tassie Company's factory is 200,000 units per year
In this case, no additional fixed cost will be incurred as the company has capacity of 200,000 units.
Further, there will not be any selling and administrative cost. Therefore,
Cost per unit for additional 40,000 units = $7.00
Markup @ 20% = $1.40
Selling price to be quoted to keep existing profit ratio = $8.40
Total expected revenue = $336,000.00
Minimum bid (break-even point) = $280,000.00
Minimum bid acceptable in this case is $7 per unit. Anything over above will represent profit. To keep
the profit ratio same, $8.40 per unit should be bid.
Situation 2 - The capacity of the factory is only 180000 units per year
Since total capacity is 180,000, only 30,000 additional units can be manufactured.
Cost per unit for additional 30,000 units = $7.00
Markup on $9.50 = $1.40
Paraphrase This Document
Need a fresh take? Get an instant paraphrase of this document with our AI Paraphraser
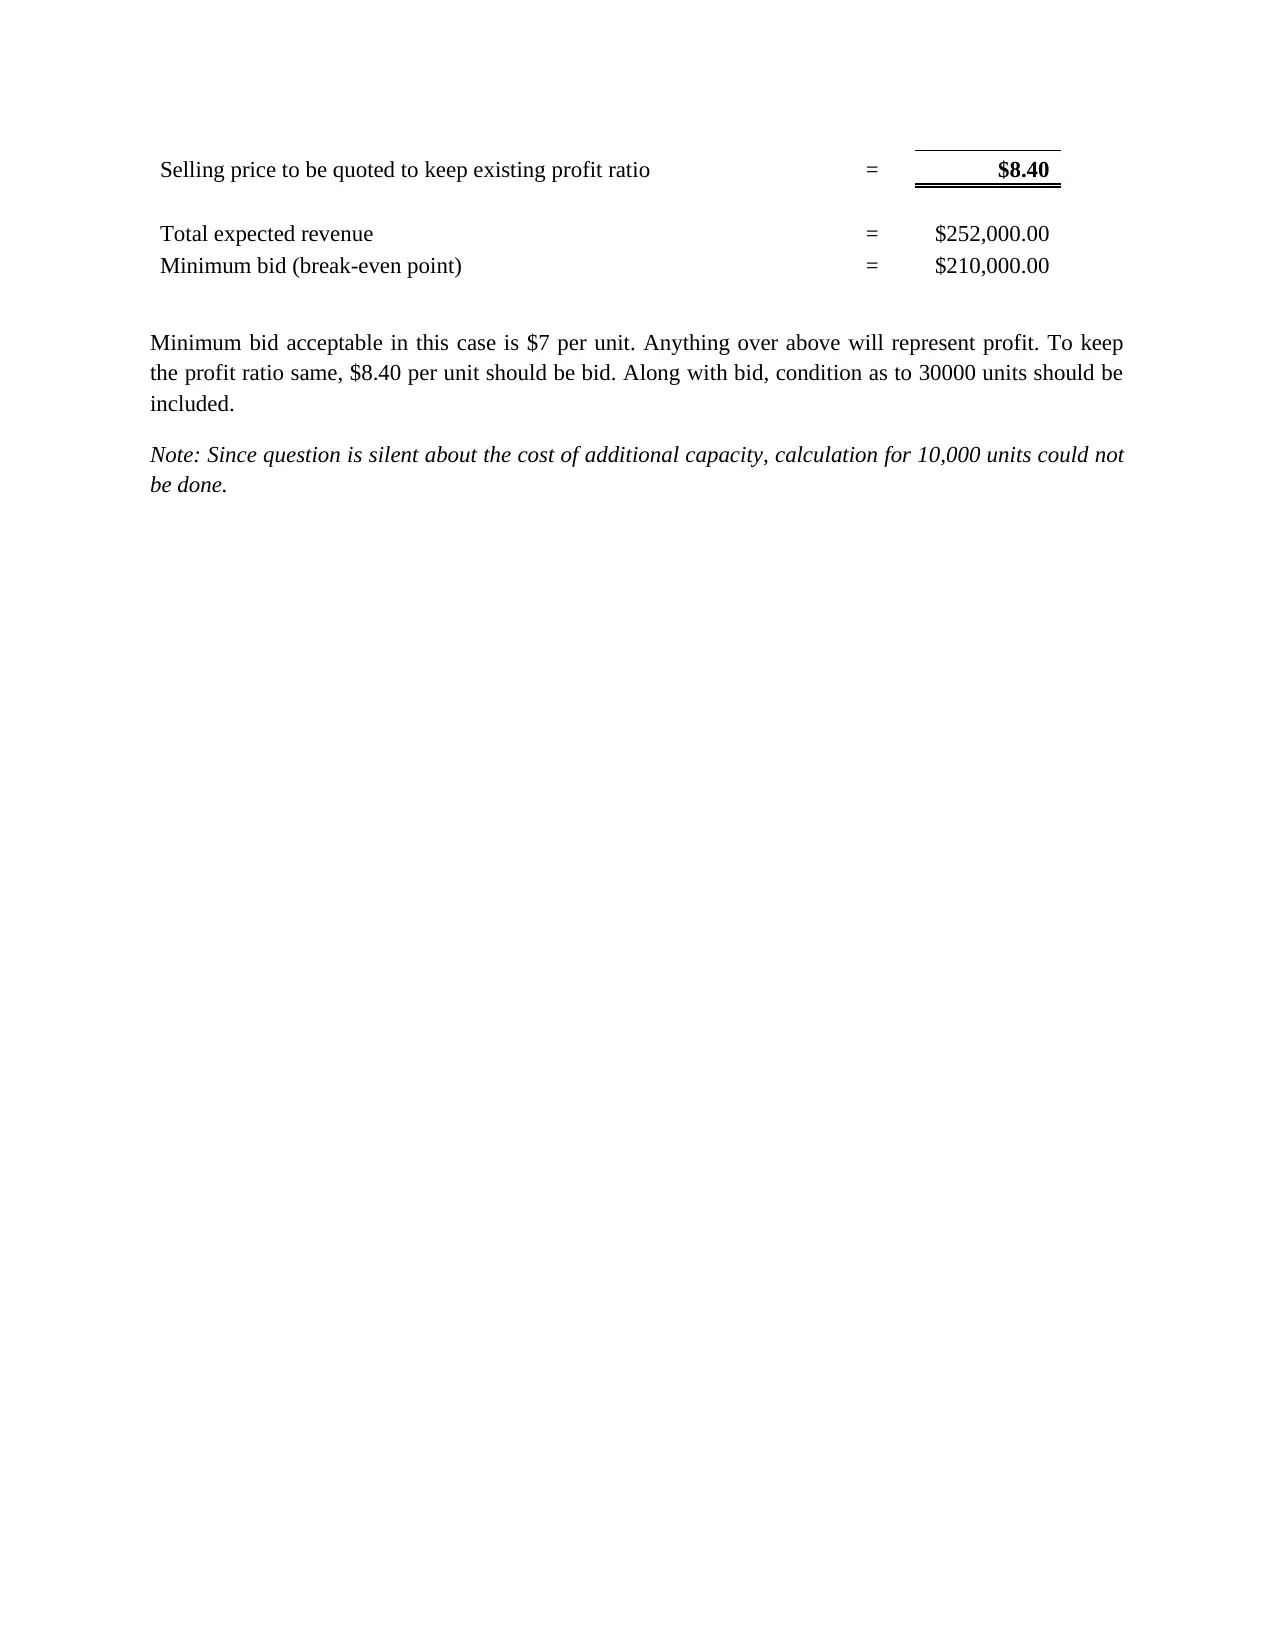
Selling price to be quoted to keep existing profit ratio = $8.40
Total expected revenue = $252,000.00
Minimum bid (break-even point) = $210,000.00
Minimum bid acceptable in this case is $7 per unit. Anything over above will represent profit. To keep
the profit ratio same, $8.40 per unit should be bid. Along with bid, condition as to 30000 units should be
included.
Note: Since question is silent about the cost of additional capacity, calculation for 10,000 units could not
be done.
Solution-3
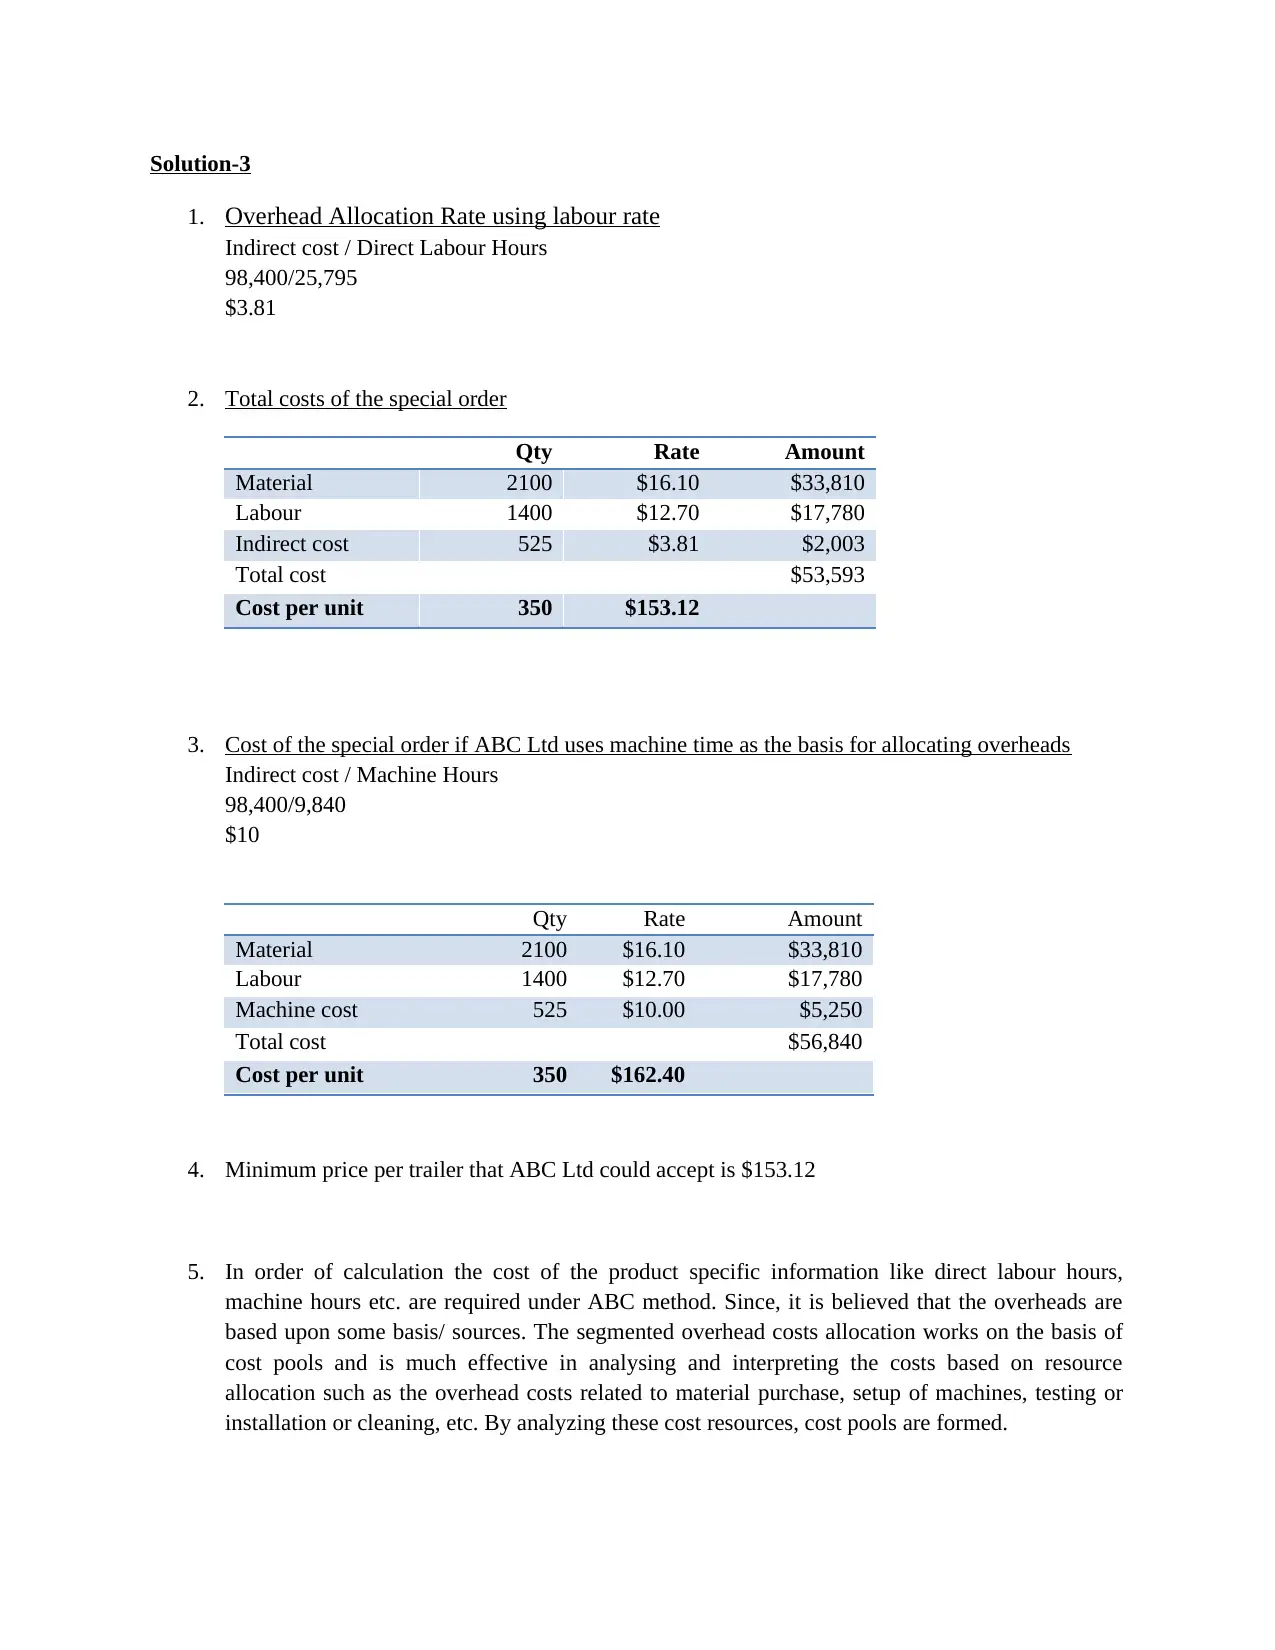
1. Overhead Allocation Rate using labour rate
Indirect cost / Direct Labour Hours
98,400/25,795
$3.81
2. Total costs of the special order
Qty Rate Amount
Material 2100 $16.10 $33,810
Labour 1400 $12.70 $17,780
Indirect cost 525 $3.81 $2,003
Total cost $53,593
Cost per unit 350 $153.12
3. Cost of the special order if ABC Ltd uses machine time as the basis for allocating overheads
Indirect cost / Machine Hours
98,400/9,840
$10
Qty Rate Amount
Material 2100 $16.10 $33,810
Labour 1400 $12.70 $17,780
Machine cost 525 $10.00 $5,250
Total cost $56,840
Cost per unit 350 $162.40
4. Minimum price per trailer that ABC Ltd could accept is $153.12
5. In order of calculation the cost of the product specific information like direct labour hours,
machine hours etc. are required under ABC method. Since, it is believed that the overheads are
based upon some basis/ sources. The segmented overhead costs allocation works on the basis of
cost pools and is much effective in analysing and interpreting the costs based on resource
allocation such as the overhead costs related to material purchase, setup of machines, testing or
installation or cleaning, etc. By analyzing these cost resources, cost pools are formed.
⊘ This is a preview!⊘
Do you want full access?
Subscribe today to unlock all pages.
Trusted by 1+ million students worldwide
Afterwards, the drivers of these cost pools are identified and the costs are allocated on the basis
of these drivers.
Thus, under segmented overhead cost pool accounting, the costs are properly allocated and thus
the resultant cost per activity or cost per product computed is more accurate and reliable as it
involves allocation of cost on the basis of cost pools and cost drivers. For example, the cost of
packaging is a cost pool and the number of products packed is the cost driver. Thus, the cost per
product is allocated by dividing the total packaging costs with the total number of products
packed. Thus, activity based costing is more reliable and provide accurate results.
Solution-4
Activity based costing is a cost allocation system which allocates the costs on the basis of segmenting the
overheads in the cost pools and then identifying the cost drivers. Segmenting of overheads means
dividing the overheads on the basis of their nature and then allocating these costs to the individual
products and services. The overheads are of two types, the direct overheads, like material cost and labour
costs which can be directly identified to the products and another are indirect overheads like rent, utilities
expenses, office expenses, depreciation, advertising, etc. These overheads can not be directly allocated
and they cannot be directly linked to products. Thus, some cost allocation basis is required to charge these
costs to the product and computing the total cost per unit.
So, for above overheads to be allocated to products, the activity based costing is used and for using this
method segmentation of costs are required. Under this method the overheads are segmented according to
their nature for example, costs related to packing, material cost, installation costs etc. and then their
respective cost drivers are identified. These drivers are identified basis the management experience and
the nature of overheads, for example, the driver for direct material cost is number of units of raw material
purchased, the driver for packaging cost if the number of products packed etc. This is a more accurate and
reliable method, however the cost of implementing this method is quite high. Whereas under the
traditional method or absorption costing mthod, the costs are allocated on the basis of blanket rate or
common allocation rate. This blanket rates are calculated on the basis of direct labour hours or machine
hours depending upon the nature of business. thus, all the overheads irrespective of their nature are
allocated on the basis of this rate. So, this is not an accurate method as compared to activity based
costing.
For example, the Toyato has adopted the overhead segmenting process to improve its process and reduce
the costs. The company has various type of overheads, like selling and administration overhead, legal
expenses, printing & stationery etc. The proper categorization of all these costs is of utmost priority, for
this all the costs are grouped according to their nature, for example labour costs are identified and then
they are further bifurcated between wages related to material handling, cleaning of machines, production
supplies, etc. this bifurcation is known as segmenting of overheads. After this, the cost drivers are
identified, which are number of labour hours spent on material handling, cleaning of machines, on
production supplies, etc. then, the costs identified are allocated on the basis of these labour hours spent.
Thus, the costs allocated are based on a reasonable basis and result in proper and accurate allocation.
Paraphrase This Document
Need a fresh take? Get an instant paraphrase of this document with our AI Paraphraser
References:
1. Civilserviceindia.com. (2018). Overhead Cost and Control, Controlling Overhead Costs. [online]
Available at: https://www.civilserviceindia.com/subject/Management/notes/overhead-cost-and-
control.html [Accessed 21 Jan. 2018].
2. Bragg, S. and Bragg, S. (2018). Overhead allocation. [online] AccountingTools. Available at:
https://www.accountingtools.com/articles/2017/5/14/overhead-allocation [Accessed 21 Jan.
2018].
1 out of 8
Related Documents


Your All-in-One AI-Powered Toolkit for Academic Success.
+13062052269
info@desklib.com
Available 24*7 on WhatsApp / Email
![[object Object]](/_next/static/media/star-bottom.7253800d.svg)
Unlock your academic potential
Copyright © 2020–2026 A2Z Services. All Rights Reserved. Developed and managed by ZUCOL.