Boohoo Group Financial Analysis: Ratios and Comparative Study

Verified

Added on  2023/06/15

|9
|1906
|299
Report
AI Summary
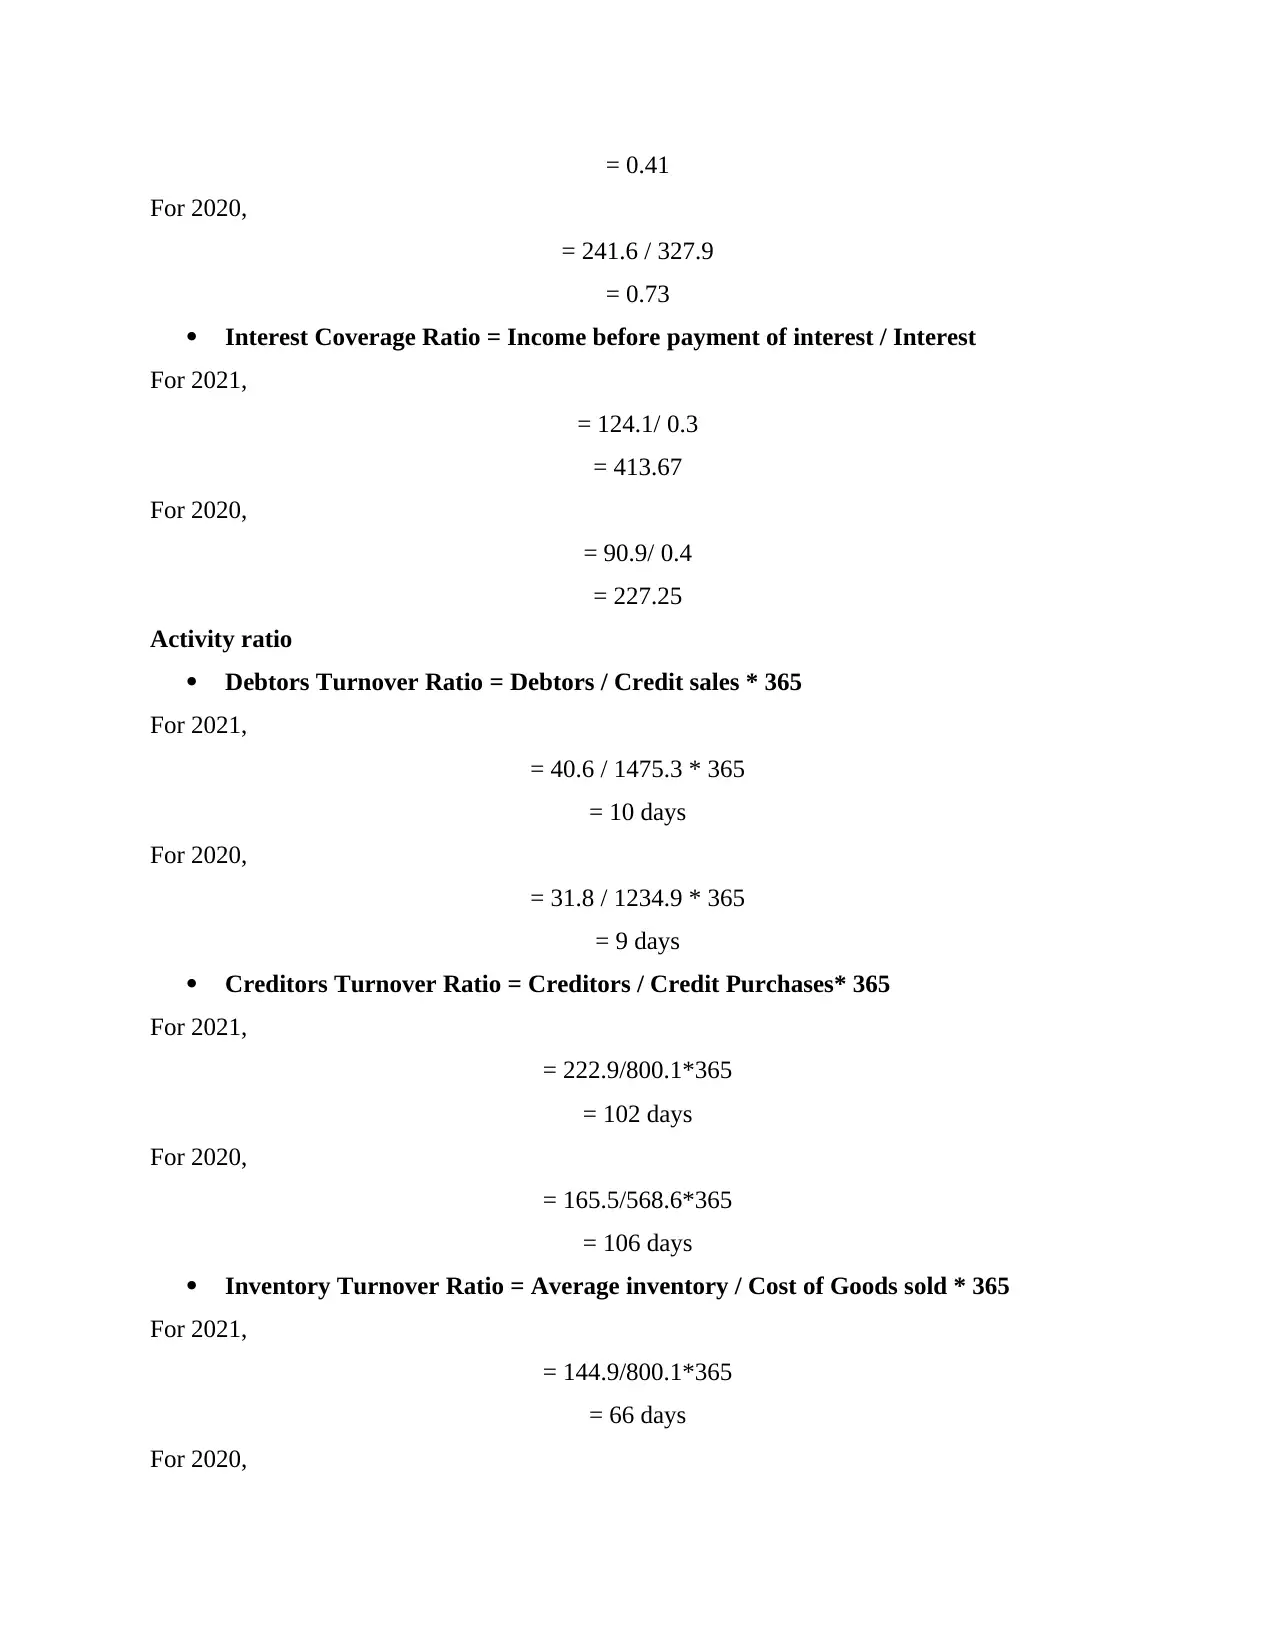
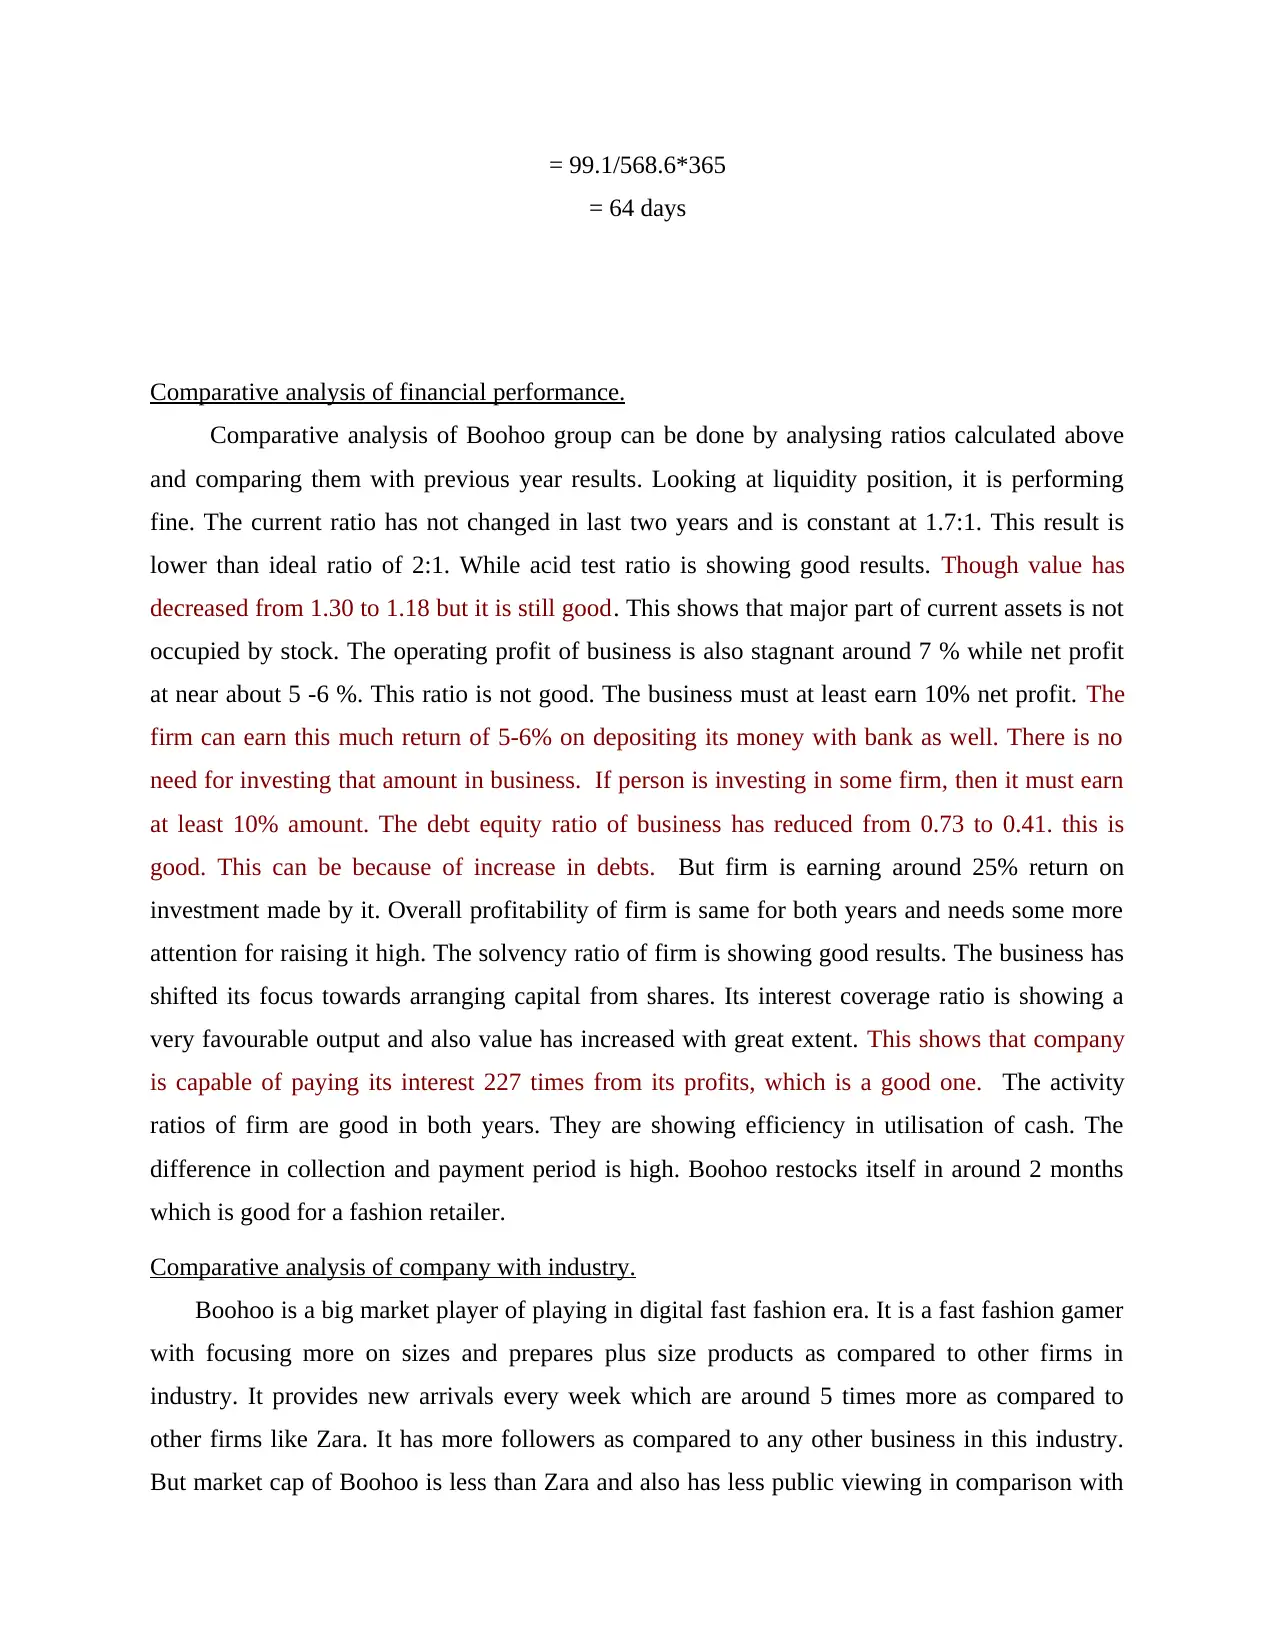
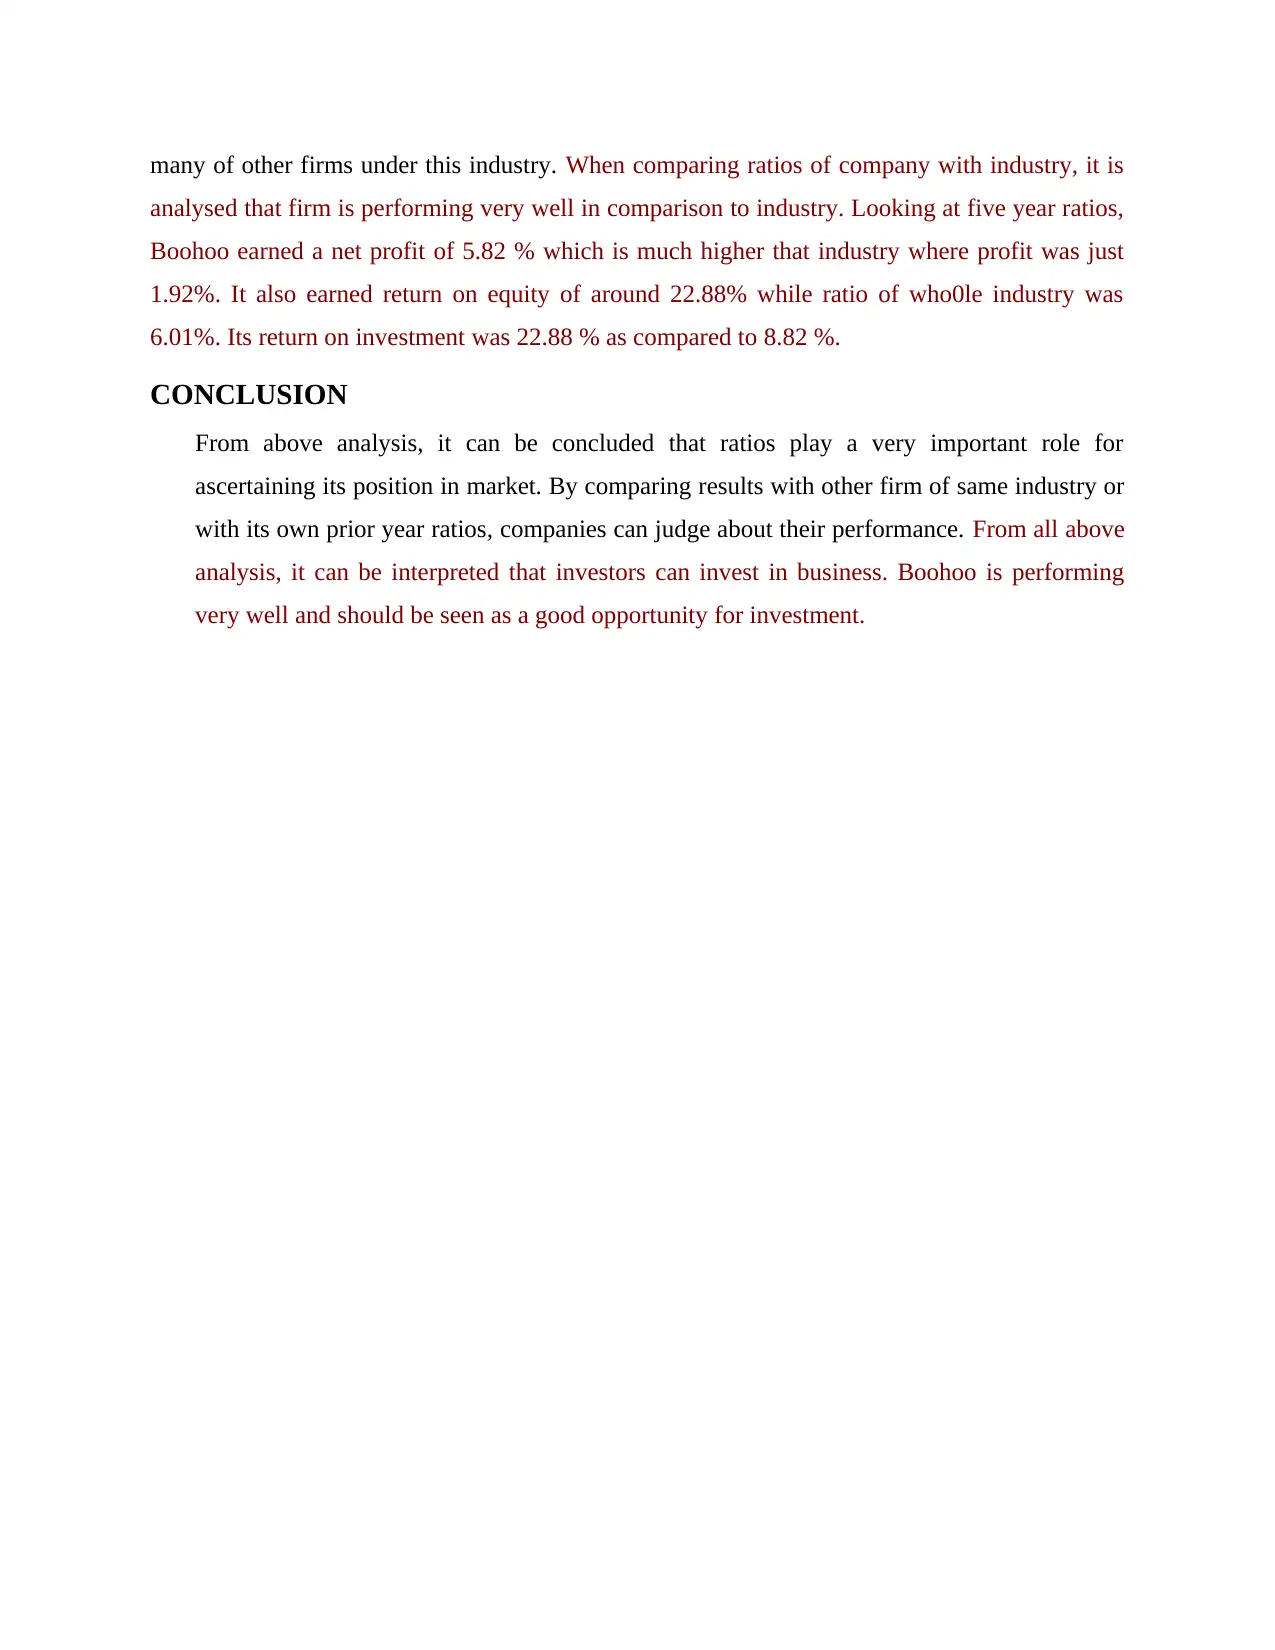
This report provides a comprehensive financial analysis of Boohoo Group, a UK-based online fashion retailer, covering its background, qualitative aspects, and quantitative performance. It includes an introduction to the UK fashion industry and Boohoo's business model, followed by a qualitative assessment considering stakeholder relations, COVID-19 impacts, and auditor's reports. The report features detailed ratio calculations for 2020 and 2021, including liquidity, profitability, solvency, and activity ratios, enabling a comparative analysis of the company's financial performance over the two years. Furthermore, it benchmarks Boohoo against the broader industry, highlighting its strengths and weaknesses. The analysis concludes that Boohoo presents a potentially favorable investment opportunity based on its financial performance and market position.
tabler-icon-diamond-filled.svg

Contribute Materials

Your contribution can guide someone’s learning journey. Share your documents today.
Document Page
Assessment 2
Financial Coursework
– Part A
tabler-icon-diamond-filled.svg

Secure Best Marks with AI Grader

Need help grading? Try our AI Grader for instant feedback on your assignments.
Document Page
Contents
Contents...........................................................................................................................................2
INTRODUCTION...........................................................................................................................3
MAIN BODY..................................................................................................................................3
Introduction and background of industry....................................................................................3
Introduction and background of company...................................................................................3
Qualitative analysis of firm.........................................................................................................4
Calculation of ratios for two years...............................................................................................4
Comparative analysis of financial performance..........................................................................7
Comparative analysis of company with industry.........................................................................8
CONCLUSION................................................................................................................................8
REFERENCES................................................................................................................................9
Document Page
INTRODUCTION
Management means to organise the whole work with a view to achieve organisational
objective. In financial accounting it means to manage the financial resources of company in such
a way that it results in maximisation of wealth and profits (Bock and et. Al., 2017). The company
chosen in this report is Boohoo Group. It is a UK based online fashion retailer with headquarter
in Manchester. The report discusses about the background of the chosen industry along with
background of company. It conducts qualitative and quantitative analysis of the firm. Further it
analysis the performance of firm and compares with other business.
MAIN BODY
Introduction and background of industry.
The fashion industry of UK plays as important role in leveraging economy of country high.
Growth in population and increase in awareness among people about fashion is raising demand
of fashionable clothes in UK. In year 1984, when a lady ordered its groceries by calling a
grocery store after viewing list of items on computer. After that trend of online shopping started.
Now, companies have their own portal where people select their product they want to buy and
simply place an order without having any physical contact with seller. In same way, fashion
industry layers also showcase their products on their portals and attract customers to purchase
them. This has provided a pool of choices for customers from which they can make choice of
their required stuff (Essel, 2021).
Introduction and background of company.
Boohoo group is an online fashion store in Britain which was founded in year 2006. It
deals in more than 36000 products. It has acquired many brands and online stores. The firm was
founded by Mahmud kamani and Corol Kane, who is at present the chairman of organisation.
The business focuses mainly on people from age group of 16-24 years and is serving in more
than 100 countries. It first listed its shares on year 2014. Being an online retailer, Boohoo makes
use of social media for its marketing. The main distribution centre of firm is in Lancashire. The
company was once criticised for promoting fast fashion as they produced at cost of environment.
Mostly clothes of Boohoo are produced in London only. Company also owns brans like Nasty
Gal, Pretty Little Thing, boohooMAN and Miss Pap. The firm was affected by Covid-19 and is
facing issues with suppliers at present (Sivasamy and et.al., 2019).
Document Page
Qualitative analysis of firm.
According to statement of chairperson, company is implementing lots of changes for
improving their relation and way of working with suppliers. This point is of great importance to
their stakeholders as well. They are also working on increasing transparency and independence
in their work. The firm also faced lot of challenges due to Covid-19 while continuing their
business in such a scenario. All decisions taken by them were great importance to handle
situation of pandemic. According to directors’ report, impact of covid on business is not going to
be changed even in next year. They are taking care of all hygienic and social distancing
measures. Looking at auditor’s report, firm has prepared its financial statements fairly (Suheldi,
Sukarmanto and Fadilah, 2019). It shows its true picture and is prepared in accordance with
principles of IFRS. There was no kind of misstatement in report. The company had a positive
tone of language. They are being optimistic that firm will be able to cope with situation and will
be able to regain its profits and market back. But at present annual report is presented in negative
tone with negative results. The statement is also prepared in very presentable manner. The choice
of their colours is very good. They have made use of their fashion collection as images on report.
The sentiments of annual report show that firm is expecting to earn revenue in future. All charts
of firm are properly prepared but they did not made any graphs for presenting results.
Calculation of ratios for two years.
Liquidity ratio
Current Ratio = Current Assets/Current Liabilities
For 2021,
= 483/285.7
= 1.7:1
For 2020,
= 382.9/217.9
= 1.7:1
Acid Test Ratio = Current Assets - Inventory/Current Liabilities
For 2021,
= 483– 144.9/285.7
=1.18:1
For 2020,
tabler-icon-diamond-filled.svg

Secure Best Marks with AI Grader

Need help grading? Try our AI Grader for instant feedback on your assignments.
Document Page
= 382.9– 99.1/217.9
= 1.30:1
Profitability ratio
Net operating profit Ratio = Operating Profit / Revenue * 100
For 2021,
= 124.1 /1745.3 *100
= 7.11 %
For 2020,
= 90.9/1234.9*100
= 7.36 %
Net Profit Ratio = Net Profit / Revenue * 100
For 2021,
= 93.4/1745.3*100
= 5.35 %
For 2020,
= 72.9/1234.9 *100
= 5.90 %
Return on Investment = Net profit before interest, tax and Dividend/Capital
Employed * 100
For 2021,
= 124.1 / (472.5 +17.70) * 100
= 124.1 /490.2
= 25.31%
For 2020,
= 90.9 / (327.9 +23.7) * 100
= 90.9 /351.6 * 100
= 25.85 %
Solvency ratio
Debt to equity Ratio = Total debt / Shareholders funds
For 2021,
= 303.4 / 472.5
Document Page
= 0.41
For 2020,
= 241.6 / 327.9
= 0.73
Interest Coverage Ratio = Income before payment of interest / Interest
For 2021,
= 124.1/ 0.3
= 413.67
For 2020,
= 90.9/ 0.4
= 227.25
Activity ratio
Debtors Turnover Ratio = Debtors / Credit sales * 365
For 2021,
= 40.6 / 1475.3 * 365
= 10 days
For 2020,
= 31.8 / 1234.9 * 365
= 9 days
Creditors Turnover Ratio = Creditors / Credit Purchases* 365
For 2021,
= 222.9/800.1*365
= 102 days
For 2020,
= 165.5/568.6*365
= 106 days
Inventory Turnover Ratio = Average inventory / Cost of Goods sold * 365
For 2021,
= 144.9/800.1*365
= 66 days
For 2020,
Document Page
= 99.1/568.6*365
= 64 days
Comparative analysis of financial performance.
Comparative analysis of Boohoo group can be done by analysing ratios calculated above
and comparing them with previous year results. Looking at liquidity position, it is performing
fine. The current ratio has not changed in last two years and is constant at 1.7:1. This result is
lower than ideal ratio of 2:1. While acid test ratio is showing good results. Though value has
decreased from 1.30 to 1.18 but it is still good. This shows that major part of current assets is not
occupied by stock. The operating profit of business is also stagnant around 7 % while net profit
at near about 5 -6 %. This ratio is not good. The business must at least earn 10% net profit. The
firm can earn this much return of 5-6% on depositing its money with bank as well. There is no
need for investing that amount in business. If person is investing in some firm, then it must earn
at least 10% amount. The debt equity ratio of business has reduced from 0.73 to 0.41. this is
good. This can be because of increase in debts. But firm is earning around 25% return on
investment made by it. Overall profitability of firm is same for both years and needs some more
attention for raising it high. The solvency ratio of firm is showing good results. The business has
shifted its focus towards arranging capital from shares. Its interest coverage ratio is showing a
very favourable output and also value has increased with great extent. This shows that company
is capable of paying its interest 227 times from its profits, which is a good one. The activity
ratios of firm are good in both years. They are showing efficiency in utilisation of cash. The
difference in collection and payment period is high. Boohoo restocks itself in around 2 months
which is good for a fashion retailer.
Comparative analysis of company with industry.
Boohoo is a big market player of playing in digital fast fashion era. It is a fast fashion gamer
with focusing more on sizes and prepares plus size products as compared to other firms in
industry. It provides new arrivals every week which are around 5 times more as compared to
other firms like Zara. It has more followers as compared to any other business in this industry.
But market cap of Boohoo is less than Zara and also has less public viewing in comparison with
tabler-icon-diamond-filled.svg

Paraphrase This Document

Need a fresh take? Get an instant paraphrase of this document with our AI Paraphraser
Document Page
many of other firms under this industry. When comparing ratios of company with industry, it is
analysed that firm is performing very well in comparison to industry. Looking at five year ratios,
Boohoo earned a net profit of 5.82 % which is much higher that industry where profit was just
1.92%. It also earned return on equity of around 22.88% while ratio of who0le industry was
6.01%. Its return on investment was 22.88 % as compared to 8.82 %.
CONCLUSION
From above analysis, it can be concluded that ratios play a very important role for
ascertaining its position in market. By comparing results with other firm of same industry or
with its own prior year ratios, companies can judge about their performance. From all above
analysis, it can be interpreted that investors can invest in business. Boohoo is performing
very well and should be seen as a good opportunity for investment.
Document Page
REFERENCES
Books and Journals
Bock, T. and et. Al., 2017. 7 Financial Statements and the DNP: Essential Knowledge. Financial
and Business Management for the Doctor of Nursing Practice, p.183.
Essel, R.E., 2021. Assessing Materials Management Practices Effect on Firm’s Performance in
Ghana Using Dominance Analysis: Evidence from a Listed Company. Journal of
Operations and Strategic Planning. 4(2). pp.174-201.
Sivasamy, R. and et.al., 2019. Spatial pattern of ratio-dependent predator–prey model with prey
harvesting and cross-diffusion. International Journal of Bifurcation and Chaos. 29(03).
p.1950036.
Suheldi, S.O., Sukarmanto, E. and Fadilah, S., 2019. The Influence of Intellectual Capital and
Capital Structure on A Corporate Financial Performance (An Empirical Study on A
Banking Company, banking Sector listed on Indonesian Stock Exchange, Year 2010-
2014).
chevron_up_icon
1 out of 9
circle_padding
hide_on_mobile
zoom_out_icon
logo.png

Your All-in-One AI-Powered Toolkit for Academic Success.

Available 24*7 on WhatsApp / Email

[object Object]