ICT706 Data Analytics Project: Data-Driven Book Sales Recommendations
VerifiedAdded on 2023/06/11
|13
|2550
|473
Report
AI Summary
This report presents a comprehensive data analysis of book sales data, encompassing 1168 book sales records, to derive actionable business insights. The analysis employs various statistical techniques including two-sample t-tests, one-way ANOVA, correlation analysis, and regression analysis using Python. The data includes book name, cost price, sale price, profit, shipping type, customer type, region, category, and monthly sales/profit. The study identifies key factors influencing sales, such as the impact of free shipping, the profitability of new customers, regional sales differences between South Australia and Western Australia, and the popularity of specific book categories like Literature & Fiction and Romance. Regression analysis reveals a strong relationship between the number of customers and total sales. The report concludes with specific recommendations for the company, including prioritizing free shipping, targeted marketing in South Australia, and expanding the selection of popular book categories, along with an implementation plan to enhance logistics, marketing strategies, and regional targeting.
[Document title]
[Document subtitle]
[DATE]
[Company name]
[Company address]
[Document subtitle]
[DATE]
[Company name]
[Company address]
Paraphrase This Document
Need a fresh take? Get an instant paraphrase of this document with our AI Paraphraser
Table of Contents
Introduction – What is the problem?..........................................................................................4
Project Problem......................................................................................................................4
Research Methodology...............................................................................................................4
Analytical Findings................................................................................................................5
Two Sample t-test..................................................................................................................7
One-way ANOVA..................................................................................................................7
Correlation Analysis...............................................................................................................8
Regression analysis................................................................................................................8
Recommendations to the company............................................................................................9
An implementation plan based on the recommendations you have provided............................9
Conclusions..............................................................................................................................10
Executive Summary
The data was generated from various sources, the data is about the sale of different types of
book category with total records of 1168 book’s sales. The description of data is as follows:
Book name represents the name of the book, Book Cost Price represents the cost price of the
book to the selling eCommerce platform, Book Sale Price represents the sale price of the
book, Profit represents the difference between selling and cost price of the book, Shipping
represents the type of shipping (paid/free), Customer type represents the customer who is new
or existing, Number of customer represents the customers who bought the particular book,
Region represents the customer from two regions of the Australia (Western Australia or
South Australia), Category represents the various categories of book and finally the total
monthly sale and monthly profit is being represented.
In order to do the analysis, we are going to use sample two test, p-test, one-way ANOVA and
mean difference among the various factors of the data. The regression analysis is done to find
the various factors (using python) that would be perfect for the sale amount total that is being
calculated at the end. Based on all the analysis done further recommendation have been
provided for the company.
⊘ This is a preview!⊘
Do you want full access?
Subscribe today to unlock all pages.
Trusted by 1+ million students worldwide
List of Abbreviations and assumptions made
1. Max : Maximum
2. Min : Minimum
3. SA : South Australia
4. WA : Western Australia
List of Table
Table 1: Profit analysis according to for shipping type, customer type, region and category...5
Table 2: Summary statistics for numbers of customer who bought the books for shipping
type, customer type, region and category...................................................................................6
Table 3: Two sample independent test for shipping type, customer type and region................7
Table 4: Output of one-way ANOVA for Category...................................................................8
Table 5: Pearson’s correlation coefficient..................................................................................8
Table 6: Output of Regression Analysis....................................................................................9
Paraphrase This Document
Need a fresh take? Get an instant paraphrase of this document with our AI Paraphraser
Introduction – What is the problem?
Books are the perfect way to acquire education and help in improving overall vision of any
human being. The readers read books in physical and virtually as well, physical being actual
purchase of the book and virtual being reading it off internet using tablet, kindle, laptop etc.
The books market has always been on rise in any country and hence website giant such as
Amazon have the dedicated section for the books, this shows the seriousness of consumers
around the Australia and their interest in Books. The online sales around the world of books
have increase exponentially hence, dedicated sections enable users to order books and they
are being delivered in stipulated time by the service providers.
Project Problem
The major importance of study following:
1. Profit analysis
2. Mean No’s of customer relationship with different aspects of data
3. Correlation Analysis of the data
4. Regression analysis of the data
Research Methodology
The various analysis techniques using statistical techniques and other tools provides the
handful methods to conduct the data analysis on the data. To do the profit analysis we need to
calculate the total monthly sales and corresponding monthly profit with respect to different
attributes such as customer type, region, shipping and category of books on sale. The analysis
based on description for the customer based on shipping, customer’s region and customer
type. The p-test, two sample test and one-way ANOVA are being used in testing the
comparison between the customer who bought the books and other factors based on the
books. The analysis is being done using Python 3.6.
Analytical Findings
In this section, we carried the following
Description Statistics
Two sample t test
Correlation Analysis
Profit Analysis
Regression Analysis
One-way ANOVA
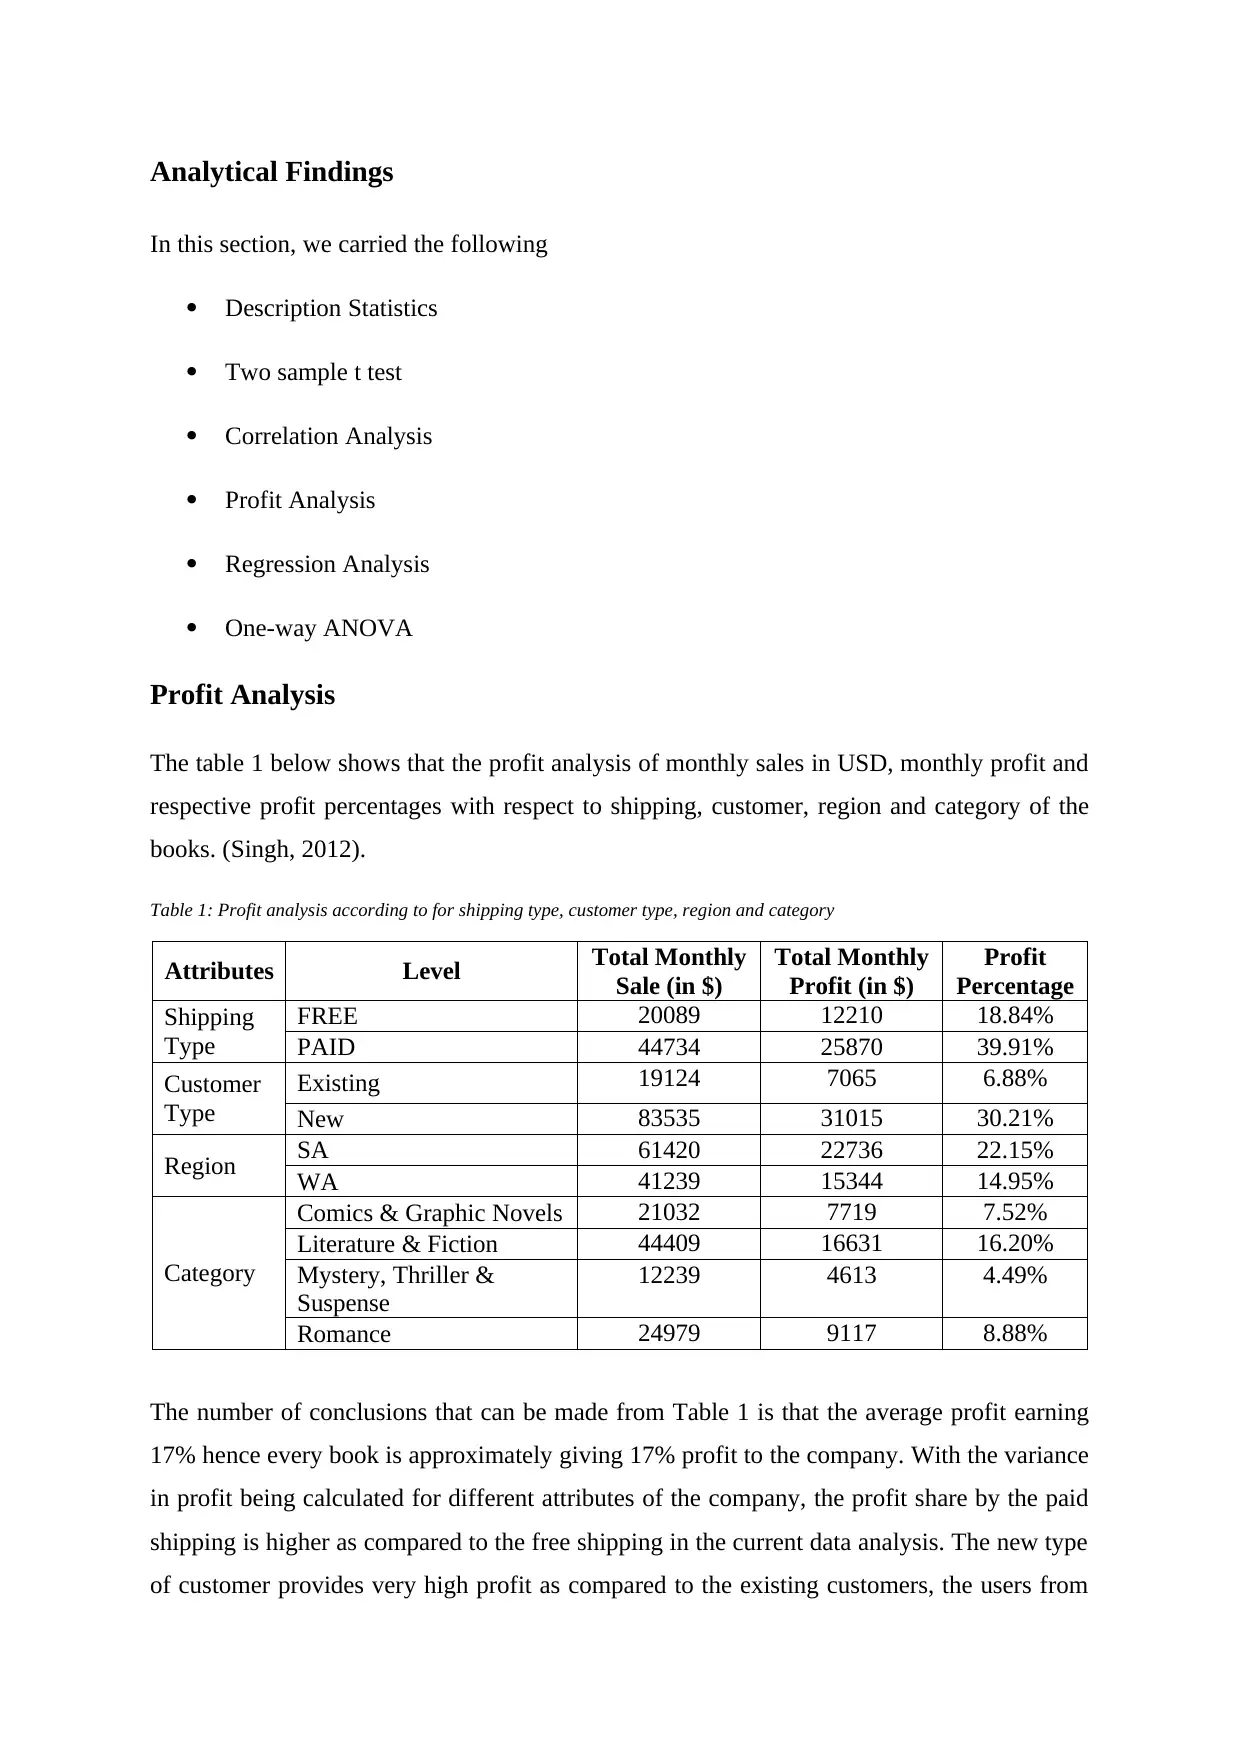
Profit Analysis
The table 1 below shows that the profit analysis of monthly sales in USD, monthly profit and
respective profit percentages with respect to shipping, customer, region and category of the
books. (Singh, 2012).
Table 1: Profit analysis according to for shipping type, customer type, region and category
Attributes Level Total Monthly
Sale (in $)
Total Monthly
Profit (in $)
Profit
Percentage
Shipping
Type
FREE 20089 12210 18.84%
PAID 44734 25870 39.91%
Customer
Type
Existing 19124 7065 6.88%
New 83535 31015 30.21%
Region SA 61420 22736 22.15%
WA 41239 15344 14.95%
Category
Comics & Graphic Novels 21032 7719 7.52%
Literature & Fiction 44409 16631 16.20%
Mystery, Thriller &
Suspense
12239 4613 4.49%
Romance 24979 9117 8.88%
The number of conclusions that can be made from Table 1 is that the average profit earning
17% hence every book is approximately giving 17% profit to the company. With the variance
in profit being calculated for different attributes of the company, the profit share by the paid
shipping is higher as compared to the free shipping in the current data analysis. The new type
of customer provides very high profit as compared to the existing customers, the users from
In this section, we carried the following
Description Statistics
Two sample t test
Correlation Analysis
Profit Analysis
Regression Analysis
One-way ANOVA
Profit Analysis
The table 1 below shows that the profit analysis of monthly sales in USD, monthly profit and
respective profit percentages with respect to shipping, customer, region and category of the
books. (Singh, 2012).
Table 1: Profit analysis according to for shipping type, customer type, region and category
Attributes Level Total Monthly
Sale (in $)
Total Monthly
Profit (in $)
Profit
Percentage
Shipping
Type
FREE 20089 12210 18.84%
PAID 44734 25870 39.91%
Customer
Type
Existing 19124 7065 6.88%
New 83535 31015 30.21%
Region SA 61420 22736 22.15%
WA 41239 15344 14.95%
Category
Comics & Graphic Novels 21032 7719 7.52%
Literature & Fiction 44409 16631 16.20%
Mystery, Thriller &
Suspense
12239 4613 4.49%
Romance 24979 9117 8.88%
The number of conclusions that can be made from Table 1 is that the average profit earning
17% hence every book is approximately giving 17% profit to the company. With the variance
in profit being calculated for different attributes of the company, the profit share by the paid
shipping is higher as compared to the free shipping in the current data analysis. The new type
of customer provides very high profit as compared to the existing customers, the users from
⊘ This is a preview!⊘
Do you want full access?
Subscribe today to unlock all pages.
Trusted by 1+ million students worldwide
South Australia provide more orders and profit as compared to the Western Australia. Among
the categories the Literature and Fiction sales have maximum profit as compared to other
books category types. (Weimao Ke,2015)
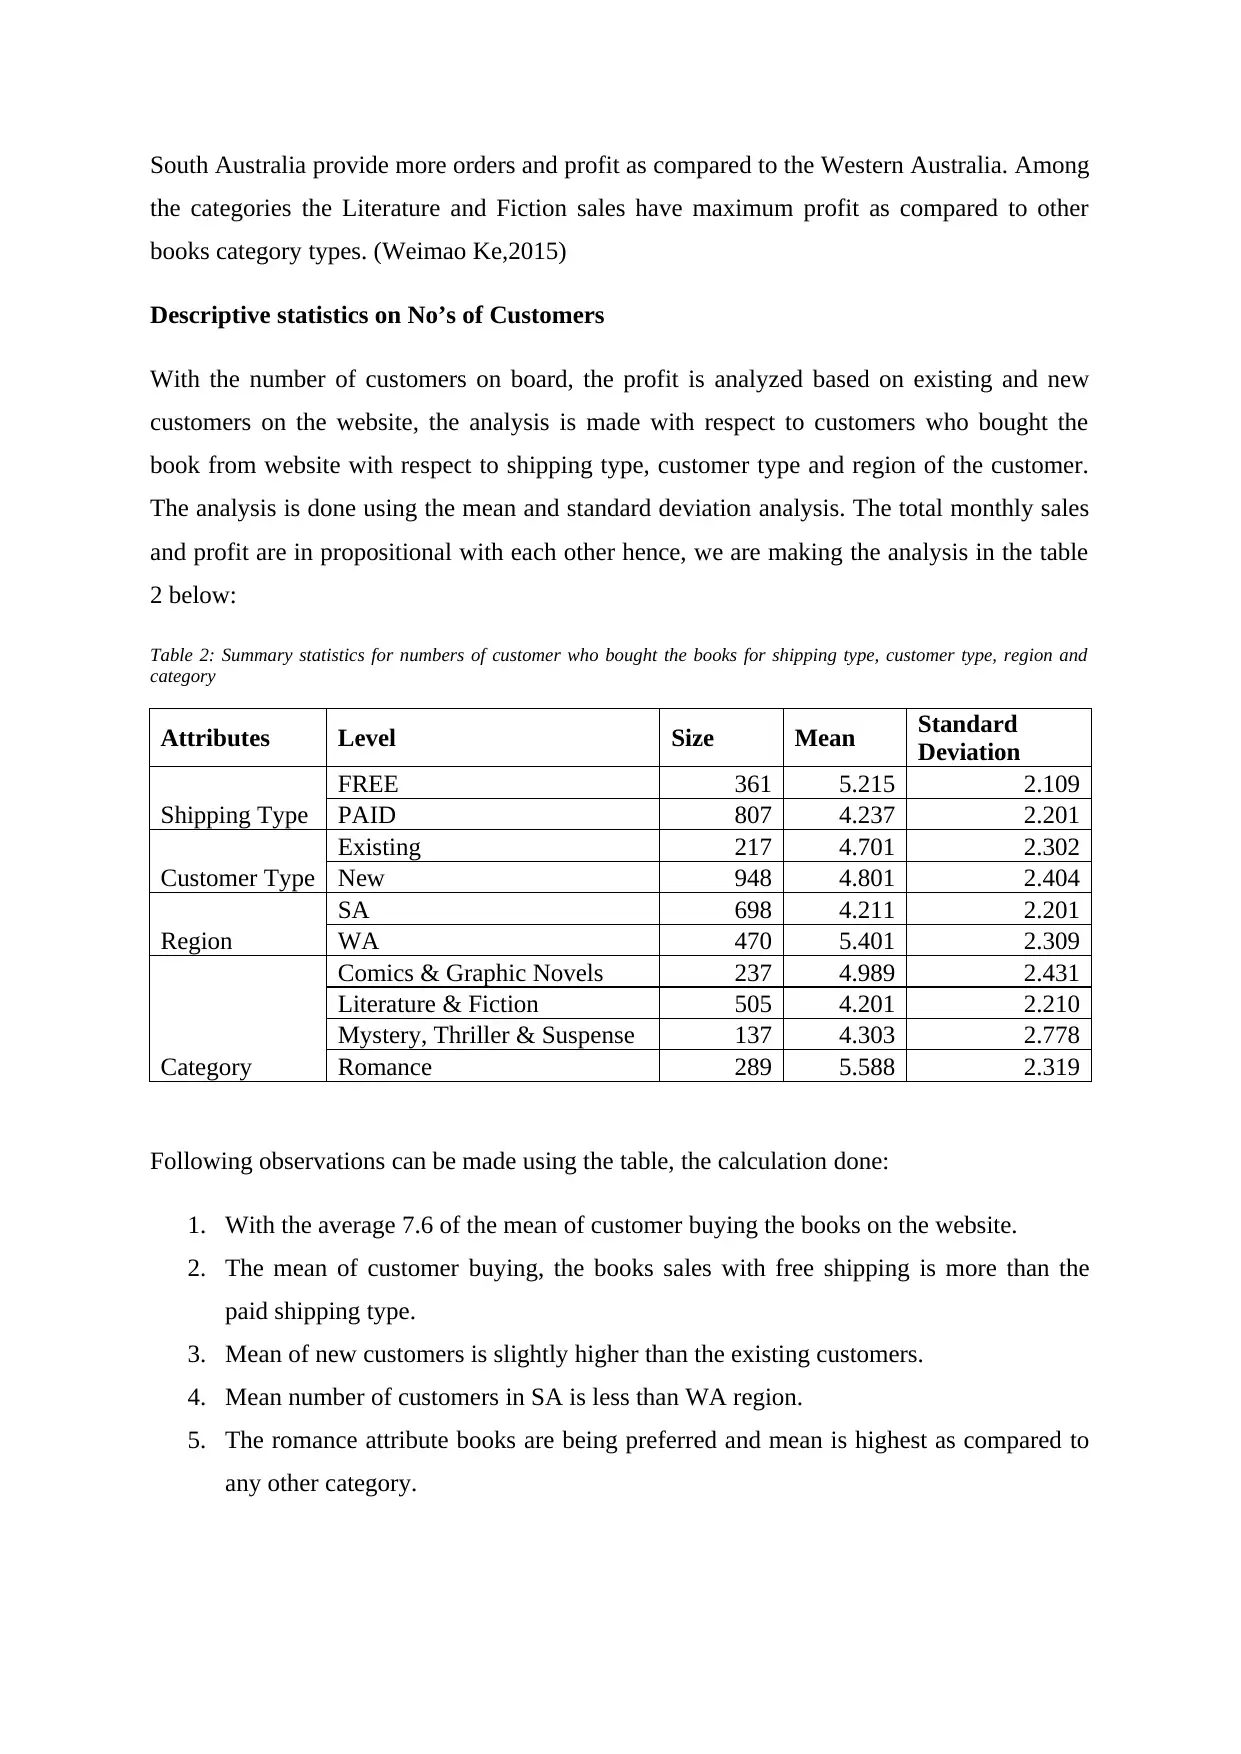
Descriptive statistics on No’s of Customers
With the number of customers on board, the profit is analyzed based on existing and new
customers on the website, the analysis is made with respect to customers who bought the
book from website with respect to shipping type, customer type and region of the customer.
The analysis is done using the mean and standard deviation analysis. The total monthly sales
and profit are in propositional with each other hence, we are making the analysis in the table
2 below:
Table 2: Summary statistics for numbers of customer who bought the books for shipping type, customer type, region and
category
Attributes Level Size Mean Standard
Deviation
Shipping Type
FREE 361 5.215 2.109
PAID 807 4.237 2.201
Customer Type
Existing 217 4.701 2.302
New 948 4.801 2.404
Region
SA 698 4.211 2.201
WA 470 5.401 2.309
Category
Comics & Graphic Novels 237 4.989 2.431
Literature & Fiction 505 4.201 2.210
Mystery, Thriller & Suspense 137 4.303 2.778
Romance 289 5.588 2.319
Following observations can be made using the table, the calculation done:
1. With the average 7.6 of the mean of customer buying the books on the website.
2. The mean of customer buying, the books sales with free shipping is more than the
paid shipping type.
3. Mean of new customers is slightly higher than the existing customers.
4. Mean number of customers in SA is less than WA region.
5. The romance attribute books are being preferred and mean is highest as compared to
any other category.
the categories the Literature and Fiction sales have maximum profit as compared to other
books category types. (Weimao Ke,2015)
Descriptive statistics on No’s of Customers
With the number of customers on board, the profit is analyzed based on existing and new
customers on the website, the analysis is made with respect to customers who bought the
book from website with respect to shipping type, customer type and region of the customer.
The analysis is done using the mean and standard deviation analysis. The total monthly sales
and profit are in propositional with each other hence, we are making the analysis in the table
2 below:
Table 2: Summary statistics for numbers of customer who bought the books for shipping type, customer type, region and
category
Attributes Level Size Mean Standard
Deviation
Shipping Type
FREE 361 5.215 2.109
PAID 807 4.237 2.201
Customer Type
Existing 217 4.701 2.302
New 948 4.801 2.404
Region
SA 698 4.211 2.201
WA 470 5.401 2.309
Category
Comics & Graphic Novels 237 4.989 2.431
Literature & Fiction 505 4.201 2.210
Mystery, Thriller & Suspense 137 4.303 2.778
Romance 289 5.588 2.319
Following observations can be made using the table, the calculation done:
1. With the average 7.6 of the mean of customer buying the books on the website.
2. The mean of customer buying, the books sales with free shipping is more than the
paid shipping type.
3. Mean of new customers is slightly higher than the existing customers.
4. Mean number of customers in SA is less than WA region.
5. The romance attribute books are being preferred and mean is highest as compared to
any other category.
Paraphrase This Document
Need a fresh take? Get an instant paraphrase of this document with our AI Paraphraser
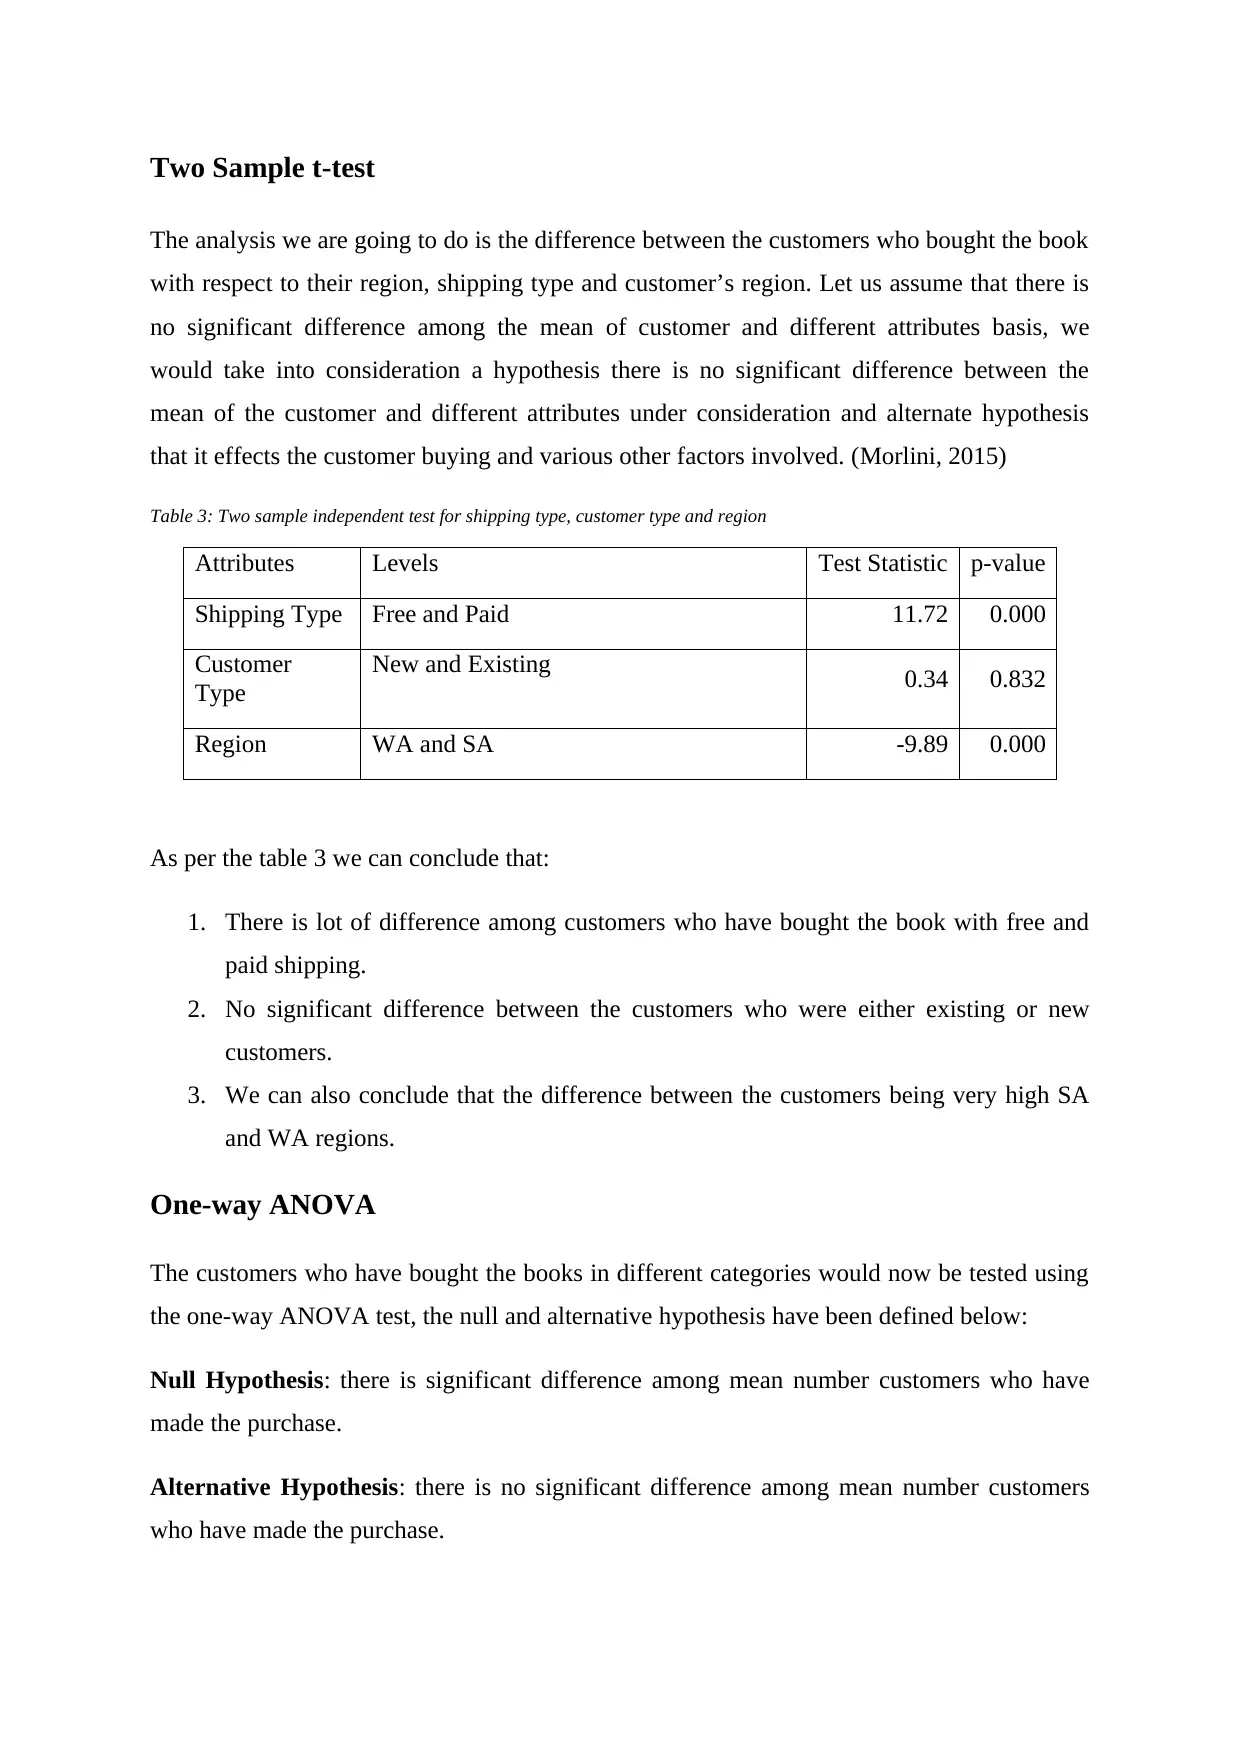
Two Sample t-test
The analysis we are going to do is the difference between the customers who bought the book
with respect to their region, shipping type and customer’s region. Let us assume that there is
no significant difference among the mean of customer and different attributes basis, we
would take into consideration a hypothesis there is no significant difference between the
mean of the customer and different attributes under consideration and alternate hypothesis
that it effects the customer buying and various other factors involved. (Morlini, 2015)
Table 3: Two sample independent test for shipping type, customer type and region
Attributes Levels Test Statistic p-value
Shipping Type Free and Paid 11.72 0.000
Customer
Type
New and Existing 0.34 0.832
Region WA and SA -9.89 0.000
As per the table 3 we can conclude that:
1. There is lot of difference among customers who have bought the book with free and
paid shipping.
2. No significant difference between the customers who were either existing or new
customers.
3. We can also conclude that the difference between the customers being very high SA
and WA regions.
One-way ANOVA
The customers who have bought the books in different categories would now be tested using
the one-way ANOVA test, the null and alternative hypothesis have been defined below:
Null Hypothesis: there is significant difference among mean number customers who have
made the purchase.
Alternative Hypothesis: there is no significant difference among mean number customers
who have made the purchase.
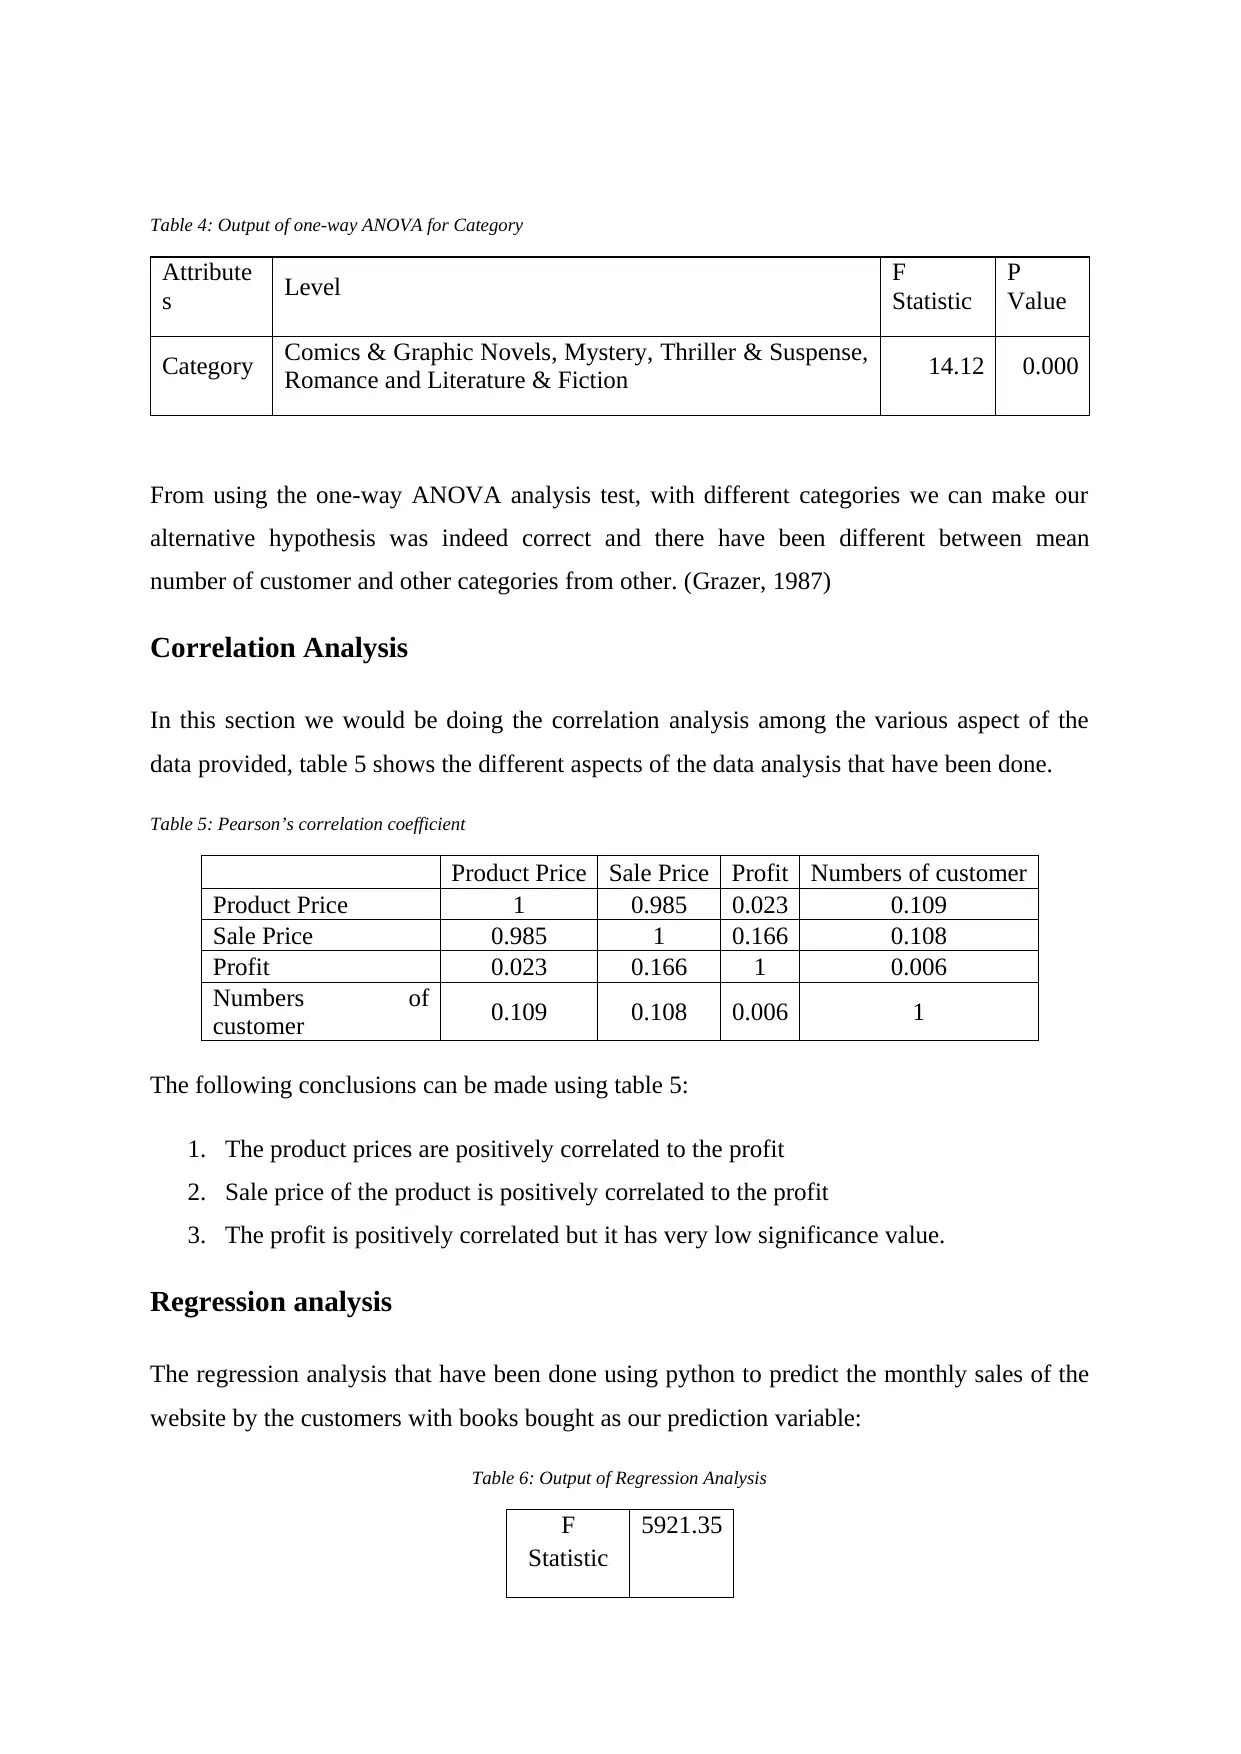
Table 4: Output of one-way ANOVA for Category
Attribute
s Level F
Statistic
P
Value
Category Comics & Graphic Novels, Mystery, Thriller & Suspense,
Romance and Literature & Fiction 14.12 0.000
From using the one-way ANOVA analysis test, with different categories we can make our
alternative hypothesis was indeed correct and there have been different between mean
number of customer and other categories from other. (Grazer, 1987)
Correlation Analysis
In this section we would be doing the correlation analysis among the various aspect of the
data provided, table 5 shows the different aspects of the data analysis that have been done.
Table 5: Pearson’s correlation coefficient
Product Price Sale Price Profit Numbers of customer
Product Price 1 0.985 0.023 0.109
Sale Price 0.985 1 0.166 0.108
Profit 0.023 0.166 1 0.006
Numbers of
customer 0.109 0.108 0.006 1
The following conclusions can be made using table 5:
1. The product prices are positively correlated to the profit
2. Sale price of the product is positively correlated to the profit
3. The profit is positively correlated but it has very low significance value.
Regression analysis
The regression analysis that have been done using python to predict the monthly sales of the
website by the customers with books bought as our prediction variable:
Table 6: Output of Regression Analysis
F
Statistic
5921.35
⊘ This is a preview!⊘
Do you want full access?
Subscribe today to unlock all pages.
Trusted by 1+ million students worldwide
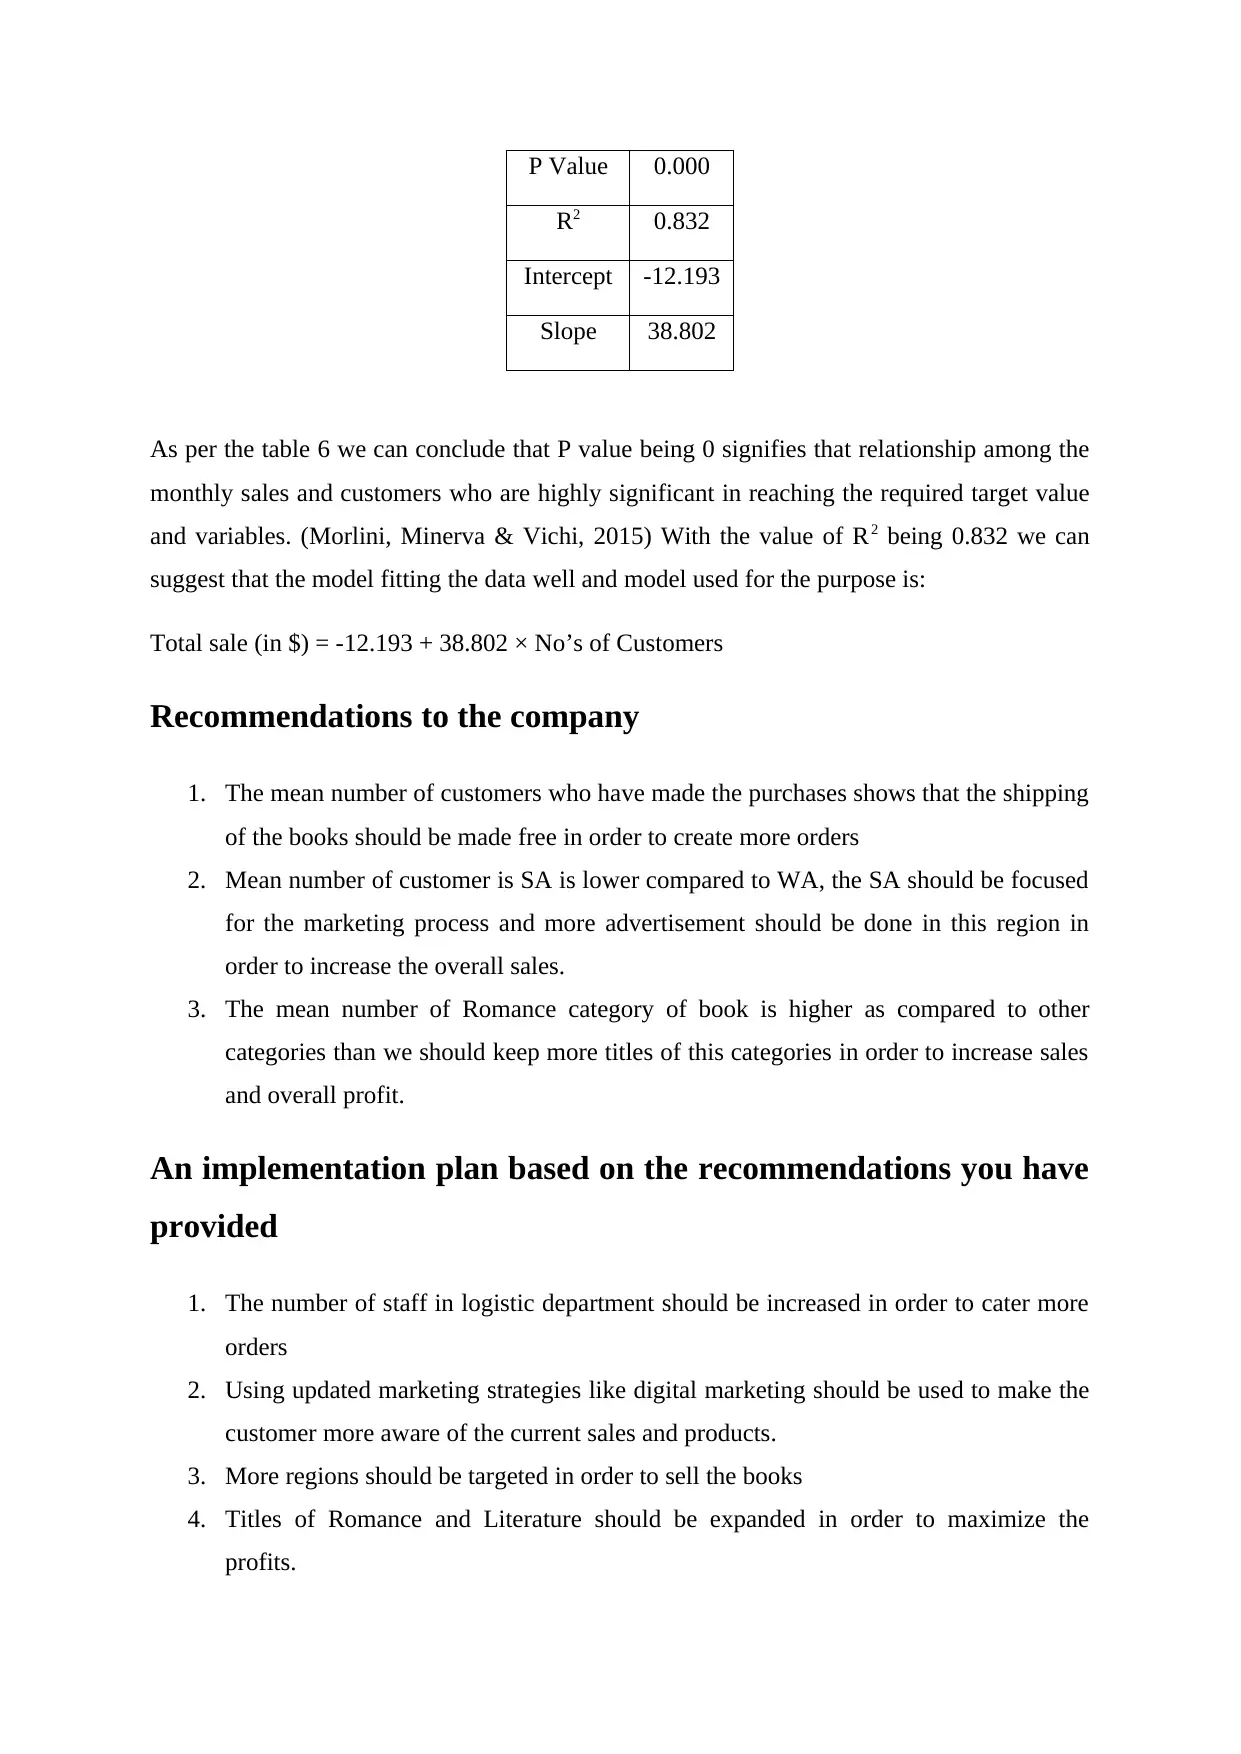
P Value 0.000
R2 0.832
Intercept -12.193
Slope 38.802
As per the table 6 we can conclude that P value being 0 signifies that relationship among the
monthly sales and customers who are highly significant in reaching the required target value
and variables. (Morlini, Minerva & Vichi, 2015) With the value of R2 being 0.832 we can
suggest that the model fitting the data well and model used for the purpose is:
Total sale (in $) = -12.193 + 38.802 × No’s of Customers
Recommendations to the company
1. The mean number of customers who have made the purchases shows that the shipping
of the books should be made free in order to create more orders
2. Mean number of customer is SA is lower compared to WA, the SA should be focused
for the marketing process and more advertisement should be done in this region in
order to increase the overall sales.
3. The mean number of Romance category of book is higher as compared to other
categories than we should keep more titles of this categories in order to increase sales
and overall profit.
An implementation plan based on the recommendations you have
provided
1. The number of staff in logistic department should be increased in order to cater more
orders
2. Using updated marketing strategies like digital marketing should be used to make the
customer more aware of the current sales and products.
3. More regions should be targeted in order to sell the books
4. Titles of Romance and Literature should be expanded in order to maximize the
profits.
Paraphrase This Document
Need a fresh take? Get an instant paraphrase of this document with our AI Paraphraser

Conclusions
The average profit earning 17% hence every book is approximately giving 17% profit to the
company. With the variance in profit being calculated for different attributes of the company,
the profit share by the paid shipping is higher as compared to the free shipping in the current
data analysis. The new type of customer provides very high profit as compared to the existing
customers, the users from South Australia provide more orders and profit as compared to the
Western Australia. Among the categories the Literature and Fiction sales have maximum
profit as compared to other books category types.
Using the regression analysis we can conclude that P value being 0 signifies that relationship
among the monthly sales and customers who are highly significant in reaching the required
target value and variables.
The average profit earning 17% hence every book is approximately giving 17% profit to the
company. With the variance in profit being calculated for different attributes of the company,
the profit share by the paid shipping is higher as compared to the free shipping in the current
data analysis. The new type of customer provides very high profit as compared to the existing
customers, the users from South Australia provide more orders and profit as compared to the
Western Australia. Among the categories the Literature and Fiction sales have maximum
profit as compared to other books category types.
Using the regression analysis we can conclude that P value being 0 signifies that relationship
among the monthly sales and customers who are highly significant in reaching the required
target value and variables.
⊘ This is a preview!⊘
Do you want full access?
Subscribe today to unlock all pages.
Trusted by 1+ million students worldwide
1 out of 13
Related Documents


Your All-in-One AI-Powered Toolkit for Academic Success.
+13062052269
info@desklib.com
Available 24*7 on WhatsApp / Email
![[object Object]](/_next/static/media/star-bottom.7253800d.svg)
Unlock your academic potential
Copyright © 2020–2026 A2Z Services. All Rights Reserved. Developed and managed by ZUCOL.