Booli Electronics SSHA Project: Business Finance Report Analysis
VerifiedAdded on 2021/06/17
|13
|2574
|18
Report
AI Summary
This report examines whether Booli Electronics should expand its business by introducing a new product, SSHA, using capital budgeting techniques. The report analyzes the project's financial viability through methods like the non-discounted payback period, profitability index, internal rate of return (IRR), and net present value (NPV). The analysis reveals a discounted payback period of 2.9 years, a profitability index of 1.97, and an IRR of 30.50%, all of which support the project's acceptance. The NPV is calculated to be $439,28,233, indicating a positive return on investment. The report also discusses the sensitivity of NPV to price and quantity changes, concluding that SSHA is a beneficial product for Booli Electronics, capable of increasing revenue and profitability. The recommendation is for Booli Electronics to expand its business by introducing SSHA, given its favorable financial metrics and potential for growth. The report emphasizes the importance of considering the payback period, profitability index, and IRR in making investment decisions and suggests adjusting pricing strategies to maximize sales and revenue.

qwertyuiopasdfghjklzxcvbnmqw
ertyuiopasdfghjklzxcvbnmqwert
yuiopasdfghjklzxcvbnmqwertyui
opasdfghjklzxcvbnmqwertyuiop
asdfghjklzxcvbnmqwertyuiopasd
fghjklzxcvbnmqwertyuiopasdfgh
jklzxcvbnmqwertyuiopasdfghjkl
zxcvbnmqwertyuiopasdfghjklzxc
vbnmqwertyuiopasdfghjklzxcvb
nmqwertyuiopasdfghjklzxcvbnm
qwertyuiopasdfghjklzxcvbnmqw
ertyuiopasdfghjklzxcvbnmqwert
yuiopasdfghjklzxcvbnmqwertyui
opasdfghjklzxcvbnmqwertyuiop
asdfghjklzxcvbnmqwertyuiopasd
fghjklzxcvbnmqwertyuiopasdfgh
jklzxcvbnmrtyuiopasdfghjklzxcv
bnmqwertyuiopasdfghjklzxcvbn
Business Finance
Report
5/6/2018
Student Name
ertyuiopasdfghjklzxcvbnmqwert
yuiopasdfghjklzxcvbnmqwertyui
opasdfghjklzxcvbnmqwertyuiop
asdfghjklzxcvbnmqwertyuiopasd
fghjklzxcvbnmqwertyuiopasdfgh
jklzxcvbnmqwertyuiopasdfghjkl
zxcvbnmqwertyuiopasdfghjklzxc
vbnmqwertyuiopasdfghjklzxcvb
nmqwertyuiopasdfghjklzxcvbnm
qwertyuiopasdfghjklzxcvbnmqw
ertyuiopasdfghjklzxcvbnmqwert
yuiopasdfghjklzxcvbnmqwertyui
opasdfghjklzxcvbnmqwertyuiop
asdfghjklzxcvbnmqwertyuiopasd
fghjklzxcvbnmqwertyuiopasdfgh
jklzxcvbnmrtyuiopasdfghjklzxcv
bnmqwertyuiopasdfghjklzxcvbn
Business Finance
Report
5/6/2018
Student Name
Paraphrase This Document
Need a fresh take? Get an instant paraphrase of this document with our AI Paraphraser
1 | P a g e Business Finance
Table of Contents
Introduction................................................................................................................................2
Questions....................................................................................................................................2
Q1. Non-discounted payback period......................................................................................2
Q.2 Profitability index............................................................................................................2
Q.3 IRR of the project............................................................................................................3
Q.4 NPV of the project...........................................................................................................4
Q.5..........................................................................................................................................5
Q.6..........................................................................................................................................5
Q.7..........................................................................................................................................5
Q.8..........................................................................................................................................6
Conclusion..................................................................................................................................6
Recommendation........................................................................................................................7
References..................................................................................................................................8
Appendices...............................................................................................................................10
Appendix 1...........................................................................................................................10
Appendix 2...........................................................................................................................10
Appendix 3...........................................................................................................................10
Appendix 4...........................................................................................................................11
2 | P a g e Business Finance
Introduction
The report discusses whether the Booli should expand its business operations or not.
For this following techniques have been used in the analysis. In the research, the capital
budgeting techniques have been discussed (Paseda, 2016). The aim of this report is to
identify the various techniques of capital budgeting to know how to accept or reject the
project. The criteria of choosing the proposal will be discussed in the report. Acceptance
and rejection of the project depend on its profitability and cost of the project. If the
profitability is high then the project is accepted by the company (Baker, Jabbouri &
Dyaz, 2017). The Booli electronics Company have to decide whether to go for the new
introduction in its project will be done by the company or not. The Company
profitability, internal rate of return, the payback period is discussed in the report.
Questions
Q1. Non-discounted payback period
A non-discounted payback period is a method which ignores the time value of money
in its calculation. This method assumes that there will be no earning after the project is
over. That means that non discounted payback period ignored the cash received after a
payback period of time (Chaysin, Daengdej & Tangjitprom, 2016). In Booli electronics,
the discounted payback period comes out to be 2.9 years (Refer Appendix 1). This shows
that the company can recover its cost in less time that is in nearly 3 years. The company
money is invested can come back in reasonable time. So the company can accept this
project and invest its funds.
Q.2 Profitability index
⊘ This is a preview!⊘
Do you want full access?
Subscribe today to unlock all pages.
Trusted by 1+ million students worldwide
3 | P a g e Business Finance
Profitability index can be defined as an index which is highlighting the profits of the
company. It is a useful tool for ranking the various projects at a time. It allows
quantifying the profitability of all the available projects. Profitability index can be
calculated by summation of initial investment and Net present value divided by the initial
investment of the project. Higher the profitability index higher will be the profits. The
company will choose those projects which will have high profitability index (Esty,
2014). The profitability index can be calculated by this formula:
Profitability Index = Present value of Future cash flows
Initial Investment
OR
= (NPV+ initial investment)/Initial investment
If the profitability index is greater than 1 then, the project will be accepted by the
business and vice-versa. In Booli electronics, the profitability is coming out to be 1.97
times (Refer. 1.97 is more than one so the company will earn a profit in the new business
expansion. The project SSHA should be opted by the company as the profitability index
is more than 1.
Q.3 IRR of the project
Internal Rate of Return is the method used to calculate the rate of return of the
projects. The term internal here refers to that the factors affected this rate will be internal
this rate will not be influenced by the external factors. IRR is accepted when it is greater
than the Cost of a capital project (Daunfeldt & Hartwig, 2014). In Booli electronics the
IRR comes out to be 30.50 (Refer Appendix 3). The minimum required of return earned
Paraphrase This Document
Need a fresh take? Get an instant paraphrase of this document with our AI Paraphraser
4 | P a g e Business Finance
by the company is 11%. The company is getting the higher return from the internal rate.
Booli can choose the IRR as it is greater than the required rate of return by the company.
Q.4 NPV of the project
Net present value can be defined as the difference between the total present value of
cash inflows at discounted factor and initial investment. Net present value is the most
important technique in capital budgeting. Since it is directly related to the objective of
maximizing the wealth of the shareholders (Cavusgil, Knight, Riesenberger, Rammal &
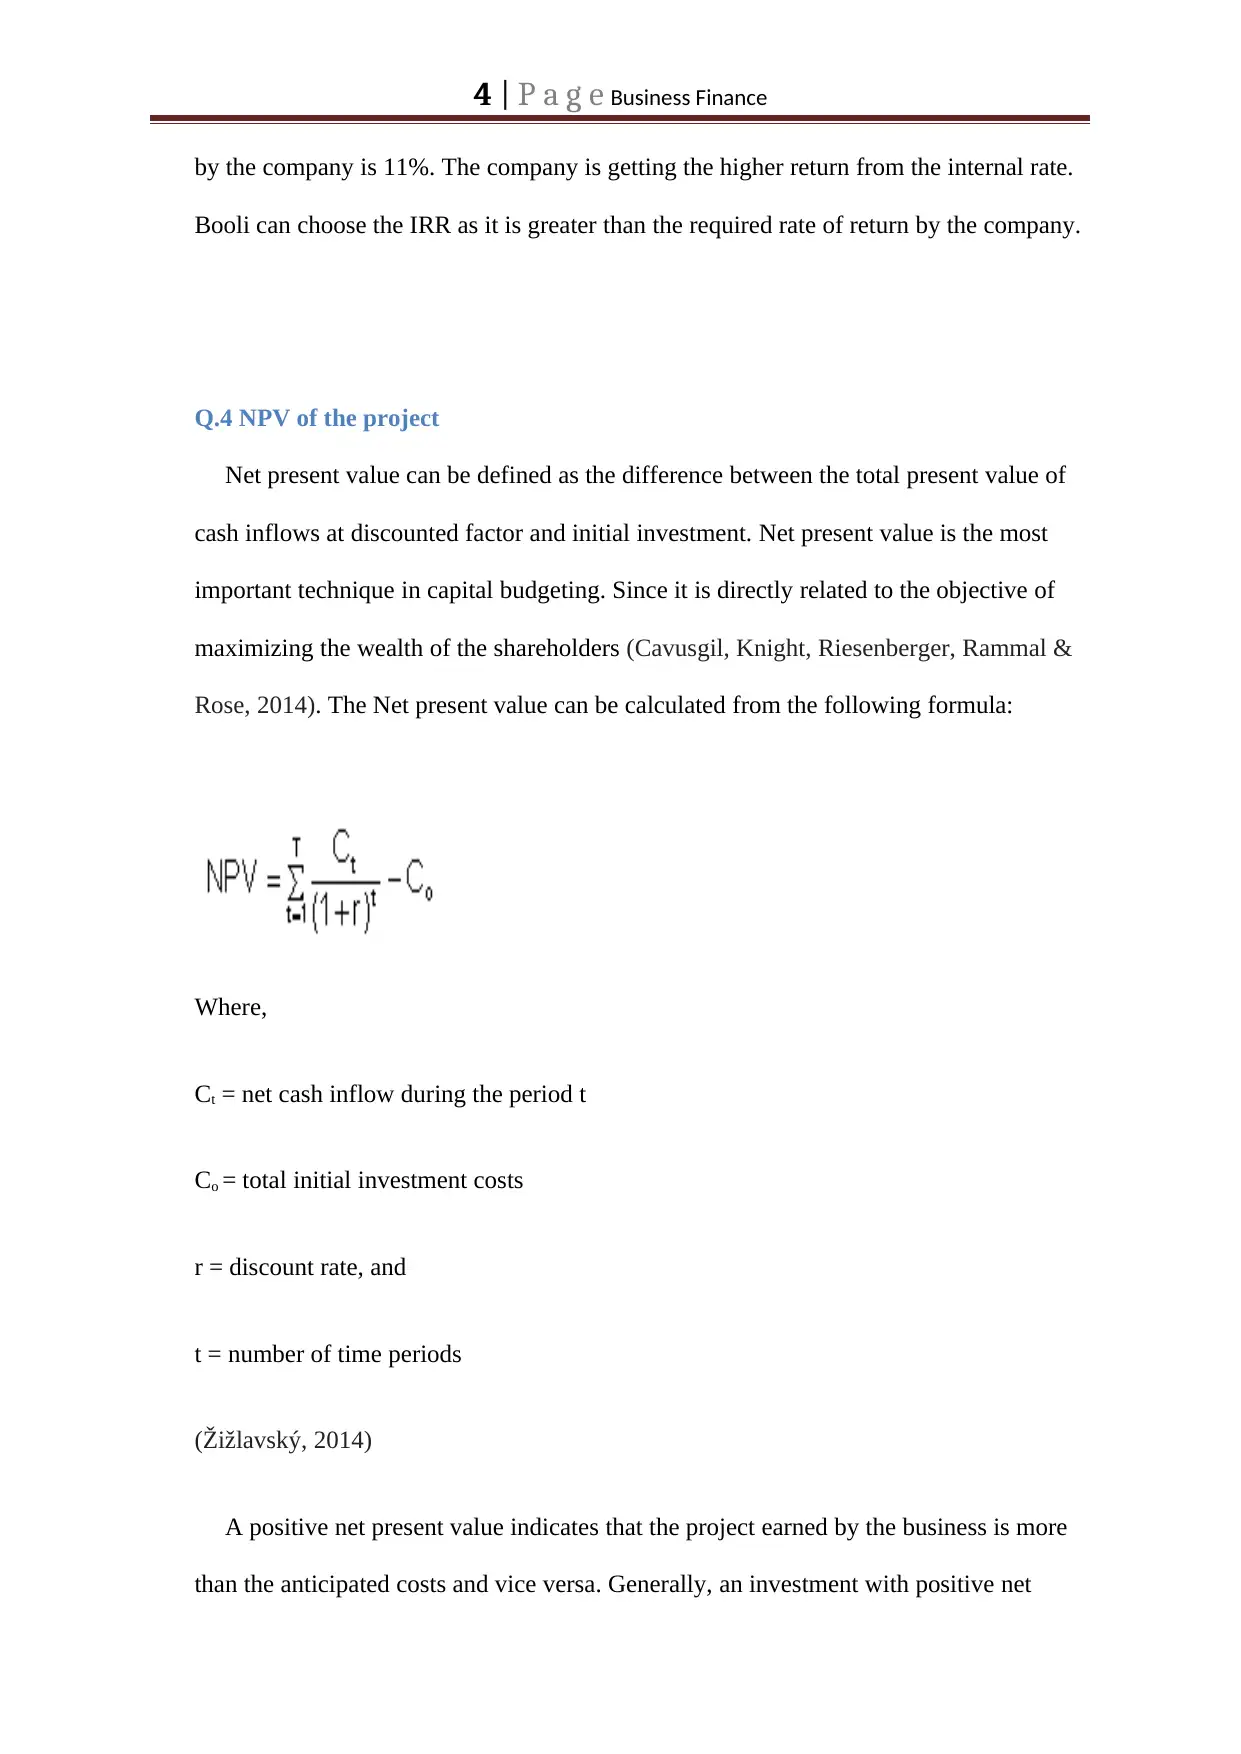
Rose, 2014). The Net present value can be calculated from the following formula:
Where,
Ct = net cash inflow during the period t
Co = total initial investment costs
r = discount rate, and
t = number of time periods
(Žižlavský, 2014)
A positive net present value indicates that the project earned by the business is more
than the anticipated costs and vice versa. Generally, an investment with positive net
by the company is 11%. The company is getting the higher return from the internal rate.
Booli can choose the IRR as it is greater than the required rate of return by the company.
Q.4 NPV of the project
Net present value can be defined as the difference between the total present value of
cash inflows at discounted factor and initial investment. Net present value is the most
important technique in capital budgeting. Since it is directly related to the objective of
maximizing the wealth of the shareholders (Cavusgil, Knight, Riesenberger, Rammal &
Rose, 2014). The Net present value can be calculated from the following formula:
Where,
Ct = net cash inflow during the period t
Co = total initial investment costs
r = discount rate, and
t = number of time periods
(Žižlavský, 2014)
A positive net present value indicates that the project earned by the business is more
than the anticipated costs and vice versa. Generally, an investment with positive net
5 | P a g e Business Finance
present value will have the profits and negative net present value indicates the losses in
the project. Net present value is chosen on the basis of positive value and higher amount
(Leung, Springborn, Turner & Brockerhoff, 2014). Booli company net present value
comes out to be $439, 28,233 (Refer Appendix 2). This shows that the company’s inflow
is more than the outflow of the company. That means the company can earn profits from
this expansion (Bierman & Smidt, 2014).
Q.5
Net present value is sensitive to changes in the prices. Net present value is the
difference between the present value of cash inflows and the present value of cash
outflows over a period of time. NPV is one of the techniques to calculate the capital
budget in a business. This business comprises of risks and opportunity while entering the
market. With this risk, some market factors are influence the prices of the commodity.
This method is used to calculate the profitability of the business. If the business is
earning the high profits then the project will be accepted and vice versa (Walden & Kitts,
2014).
Q.6
The change in the net present value also occurs because of the changes in the quantity
sold by the company. The overall sales of the Booli electronics company increase in the
initial years after that it gradually keeps on decreasing. The net present value of the
company changes as if the quantity sold is high then the revenues earned by the company
is also high. Higher the quantity sold, higher will be the revenues earned by the company
(Sayadi, Tavassoli, Monjezi & Rezaei, 2014).
⊘ This is a preview!⊘
Do you want full access?
Subscribe today to unlock all pages.
Trusted by 1+ million students worldwide
6 | P a g e Business Finance
Q.7
Yes, the Booli electronics should produce the SSHA as it will benefit the company.
The sales of SSHA are showing the increasing trends in the initial year. From this
company can be able to earn the high revenue from the business. This product has many
new and unique features like Wifi tethering and access to a large number of music
streaming services including Amazon, Spotify etc. The proposal should be accepted as
the project cash inflows are found to be good. It will increase the earning and
profitability of the company. From the Net present value, it can be seen that the $439,
28,233 is earned by the company from this product. The calculations of 5 years data
depict that the profitability index of the company is also more than 1, so the introducing
the new features in the product should be accepted (Nichol & Dowling, 2014).
Q.8
Yes, the overall sales of Booli Electronics will decrease if the company tried another
model. As SSHA offer new and unique things which makes the existence of other
product difficult. The analysis will quite be complicated if other models are introduced.
The overall sales of Booli Electronics Company have shown the increasing trend in the
first year due to the introduction of SSHA afterward the sales has been decreased and
fewer cash inflows received by the company (McCombie, & Thirlwall, 2016).
Conclusion
From the above discussion, it can be concluded that the capital budgeting techniques
are important in business to evaluate the business proposals. The capital budgeting
techniques are used in to evaluate the profitability and risk factor in the project. The
project which has high profitability and low risk should be accepted by the company. In
Paraphrase This Document
Need a fresh take? Get an instant paraphrase of this document with our AI Paraphraser
7 | P a g e Business Finance
the analysis, the company Booli electronics has introduced new techniques in its new
product because of which the sales of the company have been increased. An increased
sale in the company leads to increase in the cash inflows. SSHA product increases the
profitability of the company which is more than one in this company. The company
payback period is also low that means the company can recover its investment in a short
duration of time. The company cash flows are showing the increasing trend and the cash
outflows of the company are less. This means that company has fewer expenses and cost,
then also company can able to earn high inflow of cash. The company can recover its
money from the market in short period of time. The company can grow substantially in
the market. The company should opt for the SSHA product.
Recommendation
The Booli Electronics Company should expand its business in introducing the new
features in the product SSHA. The company should for the expansion as it is a profitable
situation for the company. The company can earn good amount of profit in it. The
company payback is in favor of the company which will benefit the company. The
company should concentrate on the period, profitability index and internal rate of return.
The company should concentrate on the price and quantity of the product offered by the
company. The company sales have been increasing in the initial years and start
decreasing in the third year. There is an increase in the price of the product because of
that there will be a decrease in the quantity sold by the company. The company should
try to change its pricing policies so that the price can be reduced and other factors too.
Booli electronics sales will also increase from this change in the company.
8 | P a g e Business Finance
References
Baker, H.K., Jabbouri, I. & Dyaz, C. (2017). Corporate finance practices in
Morocco. Managerial Finance, 43(8), 865-880.
Bierman Jr, H. & Smidt, S. (2014). Advanced capital budgeting: Refinements in the economic
analysis of investment projects. Oxon: Routledge.
Cavusgil, S.T., Knight, G., Riesenberger, J.R., Rammal, H.G. & Rose, E.L. (2014).
International business. Melbourne VIC: Pearson Australia.
Chaysin, P., Daengdej, J. & Tangjitprom, N., (2016). Survey on Available Methods to
Evaluate IT Investment. Electronic Journal Information Systems Evaluation
Volume, 19(1).
Daunfeldt, S.O. & Hartwig, F. (2014). What determines the use of capital budgeting
methods?: Evidence from Swedish listed companies. Journal of Finance and
Economics, 2(4),101-112.
Esty, B. (2014). An overview of project finance and infrastructure finance-2014 update.
Leung, B., Springborn, M.R., Turner, J.A. & Brockerhoff, E.G. (2014). Pathway‐level risk
analysis: the net present value of an invasive species policy in the US. Frontiers in
Ecology and the Environment, 12(5), 273-279.
McCombie, J. & Thirlwall, A.P (2016). Economic growth and the balance-of-payments
constraint. New York: Springer.
Nichol, E. & Dowling, M. (2014). Profitability and investment factors for UK asset pricing
models. Economics Letters, 125(3), 364-366.
⊘ This is a preview!⊘
Do you want full access?
Subscribe today to unlock all pages.
Trusted by 1+ million students worldwide

9 | P a g e Business Finance
Sayadi, A.R., Tavassoli, S.M.M., Monjezi, M. & Rezaei, M. (2014). Application of neural
networks to predict net present value in mining projects. Arabian Journal of
Geosciences, 7(3), 1067-1072.
Walden, J.B. & Kitts, N. (2014). Measuring fishery profitability: An index number
approach. Marine Policy, 43, 321-326.
Žižlavský, O. (2014). Net present value approach: method for economic assessment of
innovation projects. Procedia-Social and Behavioral Sciences, 156,506-512.
Paraphrase This Document
Need a fresh take? Get an instant paraphrase of this document with our AI Paraphraser
10 | P a g e Business Finance
Appendices
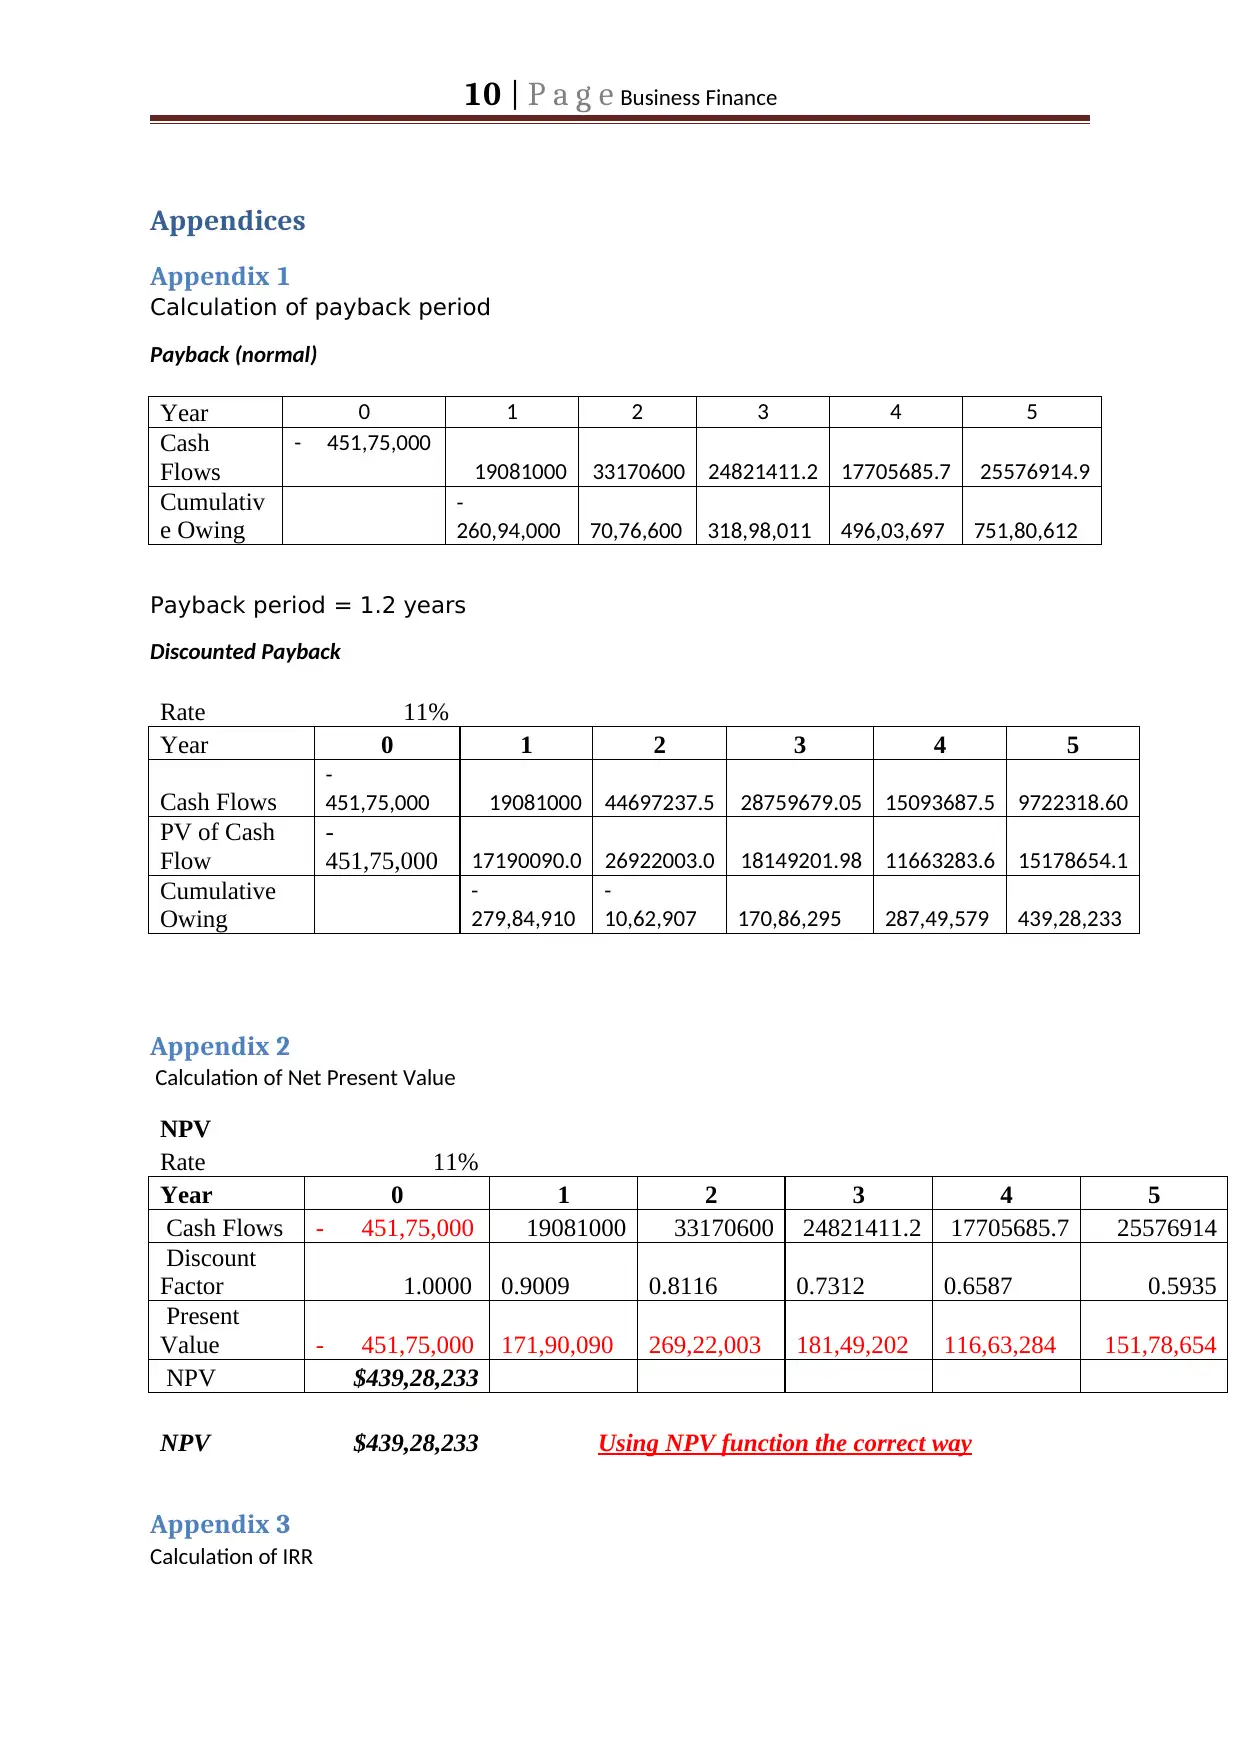
Appendix 1
Calculation of payback period
Payback (normal)
Year 0 1 2 3 4 5
Cash
Flows
- 451,75,000
19081000 33170600 24821411.2 17705685.7 25576914.9
Cumulativ
e Owing
-
260,94,000 70,76,600 318,98,011 496,03,697 751,80,612
Payback period = 1.2 years
Discounted Payback
Rate 11%
Year 0 1 2 3 4 5
Cash Flows
-
451,75,000 19081000 44697237.5 28759679.05 15093687.5 9722318.60
PV of Cash
Flow
-
451,75,000 17190090.0 26922003.0 18149201.98 11663283.6 15178654.1
Cumulative
Owing
-
279,84,910
-
10,62,907 170,86,295 287,49,579 439,28,233
Appendix 2
Calculation of Net Present Value
NPV
Rate 11%
Year 0 1 2 3 4 5
Cash Flows - 451,75,000 19081000 33170600 24821411.2 17705685.7 25576914
Discount
Factor 1.0000 0.9009 0.8116 0.7312 0.6587 0.5935
Present
Value - 451,75,000 171,90,090 269,22,003 181,49,202 116,63,284 151,78,654
NPV $439,28,233
NPV $439,28,233 Using NPV function the correct way
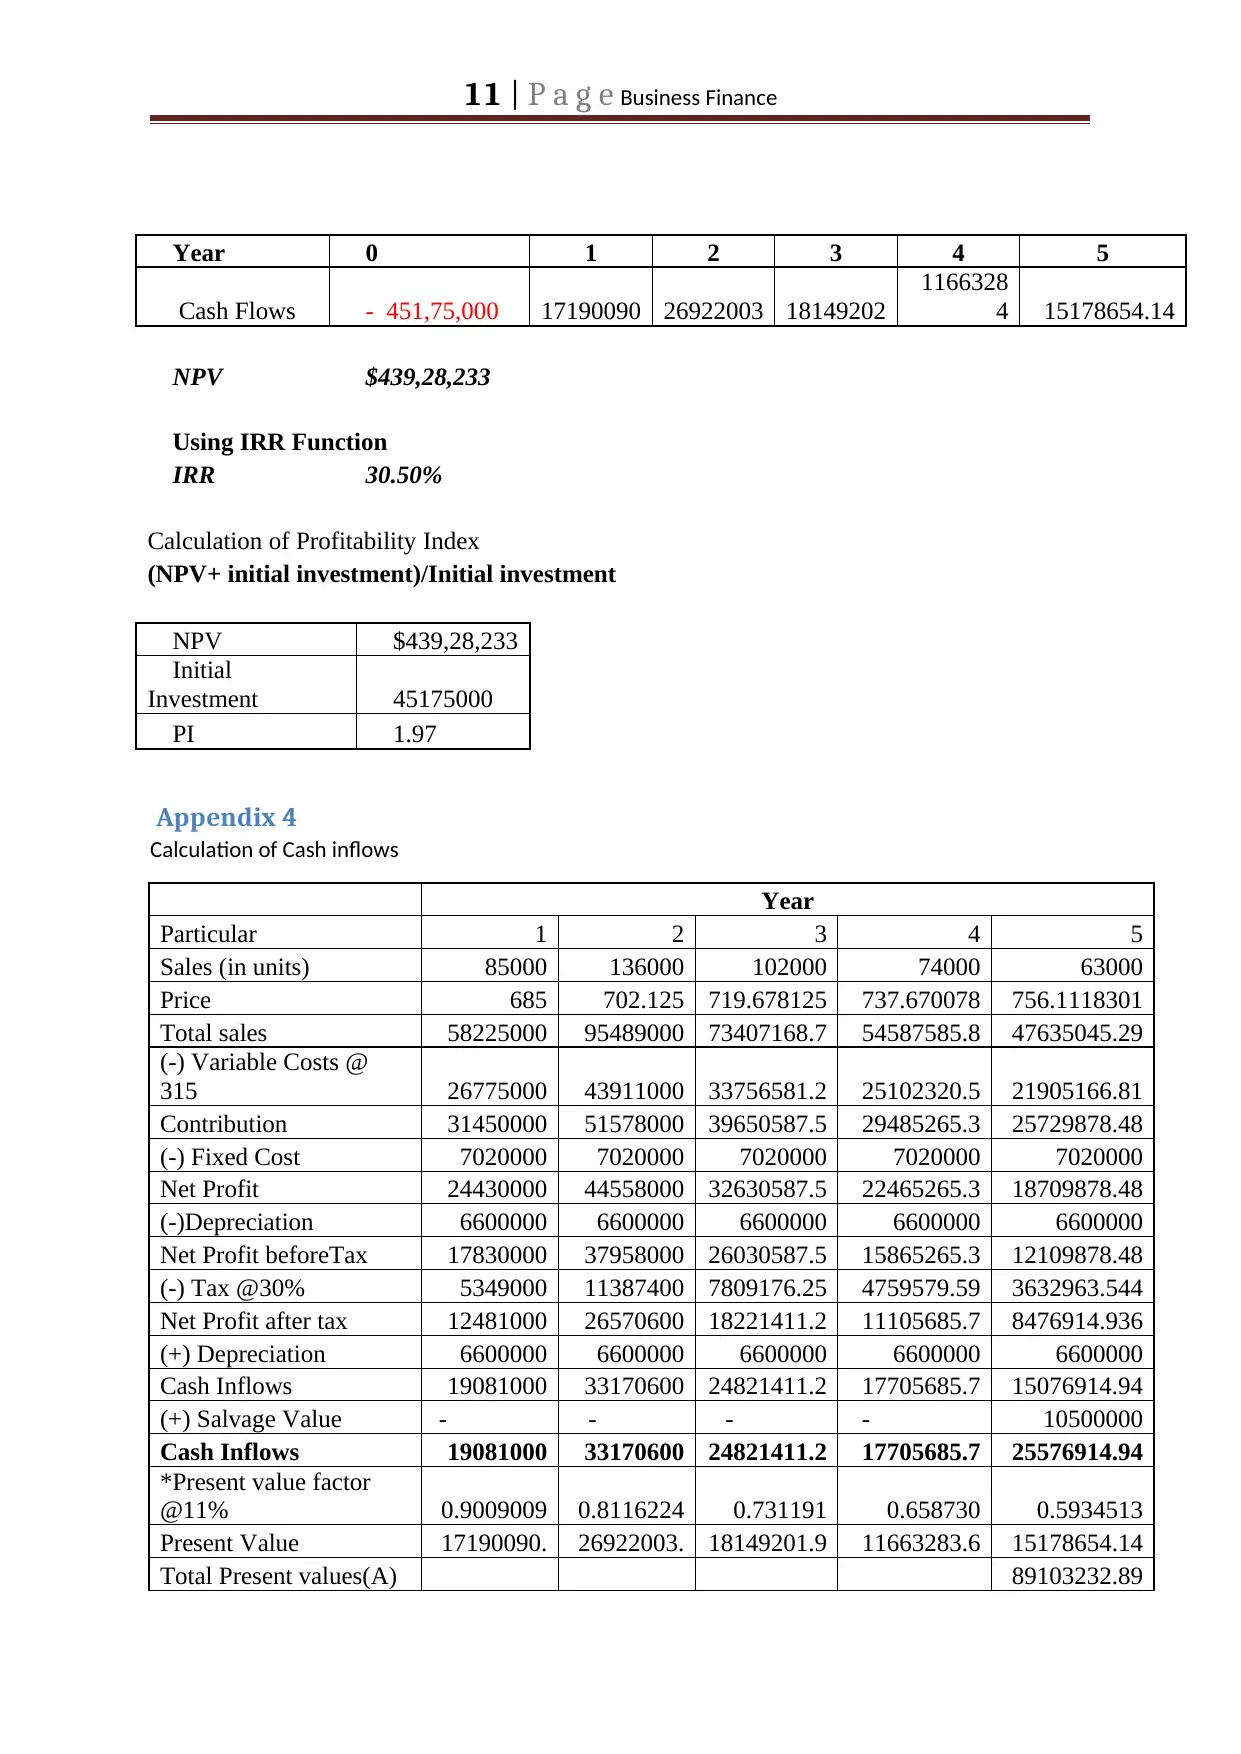
Appendix 3
Calculation of IRR
Appendices
Appendix 1
Calculation of payback period
Payback (normal)
Year 0 1 2 3 4 5
Cash
Flows
- 451,75,000
19081000 33170600 24821411.2 17705685.7 25576914.9
Cumulativ
e Owing
-
260,94,000 70,76,600 318,98,011 496,03,697 751,80,612
Payback period = 1.2 years
Discounted Payback
Rate 11%
Year 0 1 2 3 4 5
Cash Flows
-
451,75,000 19081000 44697237.5 28759679.05 15093687.5 9722318.60
PV of Cash
Flow
-
451,75,000 17190090.0 26922003.0 18149201.98 11663283.6 15178654.1
Cumulative
Owing
-
279,84,910
-
10,62,907 170,86,295 287,49,579 439,28,233
Appendix 2
Calculation of Net Present Value
NPV
Rate 11%
Year 0 1 2 3 4 5
Cash Flows - 451,75,000 19081000 33170600 24821411.2 17705685.7 25576914
Discount
Factor 1.0000 0.9009 0.8116 0.7312 0.6587 0.5935
Present
Value - 451,75,000 171,90,090 269,22,003 181,49,202 116,63,284 151,78,654
NPV $439,28,233
NPV $439,28,233 Using NPV function the correct way
Appendix 3
Calculation of IRR
11 | P a g e Business Finance
Year 0 1 2 3 4 5
Cash Flows - 451,75,000 17190090 26922003 18149202
1166328
4 15178654.14
NPV $439,28,233
Using IRR Function
IRR 30.50%
Calculation of Profitability Index
(NPV+ initial investment)/Initial investment
NPV $439,28,233
Initial
Investment 45175000
PI 1.97
Appendix 4
Calculation of Cash inflows
Year
Particular 1 2 3 4 5
Sales (in units) 85000 136000 102000 74000 63000
Price 685 702.125 719.678125 737.670078 756.1118301
Total sales 58225000 95489000 73407168.7 54587585.8 47635045.29
(-) Variable Costs @
315 26775000 43911000 33756581.2 25102320.5 21905166.81
Contribution 31450000 51578000 39650587.5 29485265.3 25729878.48
(-) Fixed Cost 7020000 7020000 7020000 7020000 7020000
Net Profit 24430000 44558000 32630587.5 22465265.3 18709878.48
(-)Depreciation 6600000 6600000 6600000 6600000 6600000
Net Profit beforeTax 17830000 37958000 26030587.5 15865265.3 12109878.48
(-) Tax @30% 5349000 11387400 7809176.25 4759579.59 3632963.544
Net Profit after tax 12481000 26570600 18221411.2 11105685.7 8476914.936
(+) Depreciation 6600000 6600000 6600000 6600000 6600000
Cash Inflows 19081000 33170600 24821411.2 17705685.7 15076914.94
(+) Salvage Value - - - - 10500000
Cash Inflows 19081000 33170600 24821411.2 17705685.7 25576914.94
*Present value factor
@11% 0.9009009 0.8116224 0.731191 0.658730 0.5934513
Present Value 17190090. 26922003. 18149201.9 11663283.6 15178654.14
Total Present values(A) 89103232.89
⊘ This is a preview!⊘
Do you want full access?
Subscribe today to unlock all pages.
Trusted by 1+ million students worldwide
1 out of 13
Related Documents


Your All-in-One AI-Powered Toolkit for Academic Success.
+13062052269
info@desklib.com
Available 24*7 on WhatsApp / Email
![[object Object]](/_next/static/media/star-bottom.7253800d.svg)
Unlock your academic potential
Copyright © 2020–2026 A2Z Services. All Rights Reserved. Developed and managed by ZUCOL.