Boots Plc: Analysis of Financial Reports and Market Performance
VerifiedAdded on 2020/11/23
|14
|3937
|423
Report
AI Summary
This report analyzes the financial performance of Boots Plc, a UK-based health and beauty retail chain, focusing on its accounting reports and market data. It begins by defining various accounting reports and statements, such as cash flow statements, income statements, and statistical data, highlighting their importance in business decision-making and performance tracking. The report then identifies Boots Plc's biggest income booster as its bathroom segment and outlines its overall percentage within the organization, supported by retail week data from 2017. A pie chart illustrates the percentage of all aspects of the company, emphasizing the significance of the bath segment. The analysis further explores the performance of product areas according to differing growth rates, providing recommendations for Boots to consolidate its market position. Finally, the report uses mean and standard deviation to comment on the firm's five-year net income, offering a comprehensive overview of Boots Plc's financial health and market strategy. The assignment utilizes information from various sources to provide a clear and detailed analysis of the company's financial standing and market position.
USING INFORMATION 1
Paraphrase This Document
Need a fresh take? Get an instant paraphrase of this document with our AI Paraphraser
TABLE OF CONTENTS
INTRODUCTION...........................................................................................................................1
SECTION 1....................................................................................................................................1
1. Providing brief definition of different Accounting report and statement...............................1
2. Identifying the use of accounting information system............................................................3
SECTION 2.....................................................................................................................................4
1. Biggest income booster for Boots Plc and its overall percentage in organisation...................4
2. Labelled Pie chart reflecting percentage of all aspects of company........................................5
3. Performance of product areas of business according to differing growth rates......................5
4. Recommendation of strategy to Boots for consolidating position in market..........................7
5. Use of mean and standard deviation to comment on 5 years’ net income of firm..................8
CONCLUSION................................................................................................................................9
REFERENCES..............................................................................................................................11
INTRODUCTION
Market decision making and monitoring are the core aspect of business growth and
performance. It is necessary for every company to track its performance by keeping a regular
check of sales, increase in product and sector share. The report will identify use of accounting
terms like, trend analysis, income statement, etc. In addition, assignment will outline biggest
income booster of Boots Plc, which is beauty and health retail chain of UK. It will identify
differing growth rates according to performance of product areas with the help of retail week
data 2017. Accordingly, it will provide recommendation to Boots for consolidating market
position.
SECTION 1
1. Providing brief definition of different Accounting report and statement
Cash flow statement – This is a statement which shows the way changes in balance sheet
and revenue earned by firm effect cash. The cash flow statement breaks the income generated by
organisation into various parts such as operating, investing and financing activities. It is
generally used by manager in an organisation for analysing the total income generated and
expenses incurred by business entity during particular financial year. Cash flow statement is
utilised by management for determining the need of financial resources for fulfilling the
requirement of various business operations. It can also be utilised for addressing the variations in
cash flows and determining the reason for same. Cash flow statement is mainly used for making
the financial plans for business (Boddy, McCalman and Buchanan, 2018). It is used by
management for making the major business decisions.
Manager by using the cash flow statement can easily determine the operational activities
which are contributing towards firm profit. It helps management in eliminating those activities
due to which an organisation has to suffer loss. Cash flow statement consists of summary of all
transactions which has been made by an enterprise during specific accounting year. For instance,
cash inflow from investing activities such as revenue generated by firm by making short term
investment in particular project. Cash flow statement can be used by finance manager or other
stakeholder such as investors for analysing the way cash has been spent by an enterprise in
particular financial year.
Income statement- This is one of the primary financial statement which is used by
management or other stakeholders such as investors for assessing the business performance as
1
⊘ This is a preview!⊘
Do you want full access?
Subscribe today to unlock all pages.
Trusted by 1+ million students worldwide
well as company financial position during specific accounting period. Income statement can be
defined as summary of management performance which can be measure in terms of profitability
of business entity during particular period of time. It is used for analysing the aggregate revenue
earned as well as expenditure made by an enterprise in specific financial year (Amiram and
Owens, 2018).
Income statement is used by management for identifying whether firm has incurred profit or
loss during specific financial year. It can be used by managers, investors or other stakeholders
for determining the way an enterprise incurs its revenues and expenses through both operating
and non-operating activities. For instance, Tesco offers grocery products, company generates
income which is recognized as revenue by selling goods and providing services to customers. It
can be used by accountant for calculating the tax liability.
A. Statistical data- It is defined as accumulation of facts using which conclusion can be
drawn. Statistical data is considered by management before selecting the specific project
for making the investment. It helps business entity in identifying the profitable project.
Statistical data is mainly used for making the comparison between current as well as past
financial performance of company (Hoque, 2018). This data is also utilised by
management for comparing two projects on which business entity can make investment.
Statistical data can also be used for identifying the solution to financial performance. It
enables managers to track non-monetary data and then utilized that information for
preparing reports and income statements.
Statistical data is used by accountant for forecasting earnings, consumption, cash
flows etc. Firm can utilise this type of data for calculating the average income earned
during specific accounting year. For instance, customer perception about company’s
products, through the statistical data manager in an organisation can easily analyse what
people perceive about business and they can identify the area which requires
improvement.
B. Annual report –This is recognised as comprehensive report which consist of information
about various activities performed by business entity during particular period of time.
Annual report can also be utilised by stakeholder for analysing the financial performance
of organisation.
2
Paraphrase This Document
Need a fresh take? Get an instant paraphrase of this document with our AI Paraphraser
C. Trend analysis- It is defined as the strategy or method which is used by business owner
for determining stock's performance given the overall trends of the market and particular
indicators within the market (Muteti, Namusonge and Nzomo, 2018). Trend analyses is
done by an organization in order to determine or predict a market trend. It can be referred
to as presentation of amount as a percentage of base year. For instance, firm can use trend
analyse the percent change in sales within specific period of time.
2. Identifying the use of accounting information system
Commercially available software:
It is also recognised as Commercial off the shelf software. This is predominant
accounting software which is used by many organisations worldwide. Commercially available
software is considered to be suitable, as it fulfils the requirement of business. The features of this
accounting software that it contains the multiple layer of error detection. In other words, major
advantage of this software is that it helps in eliminating the chances of mistakes in accounting.
Commercially available software assist accountant in preparing standard report which is very
much important in order to cater the need of user.
The drawback is that installation of Commercially available software requires expert
knowledge. Lengthy installation procedure is considered to be as another major disadvantage.
ERP:
The abbreviation ERP stands for enterprise resource planning. This software combines
data or information from different functional units or Part of an organisation into single database.
ERP software assist in eliminating the problem related to independent departmental specific
software which does not share information (Trinandha and Ghozali, 2018). This system is used
by management for many routine business functions. It enables business entity to manage all the
functions related to technology, human resource and services in systematic manner. A typical
ERP covers following aspects such as customer relationship management, sales, Financial
management etc. ERP software assist an organisation in developing a new business foundations
and also helps in increasing operational capabilities. The benefit of ERP accounting information
system is that it helps firm in increasing efficiency. It integrates various business functions such
as marketing, sales, inventory accounting etc.
3
Major disadvantage of this software is that it takes long time to get install. It is quite
expensive as compared to other software’s.
SECTION 2
1. Biggest income booster for Boots Plc and its overall percentage in organisation
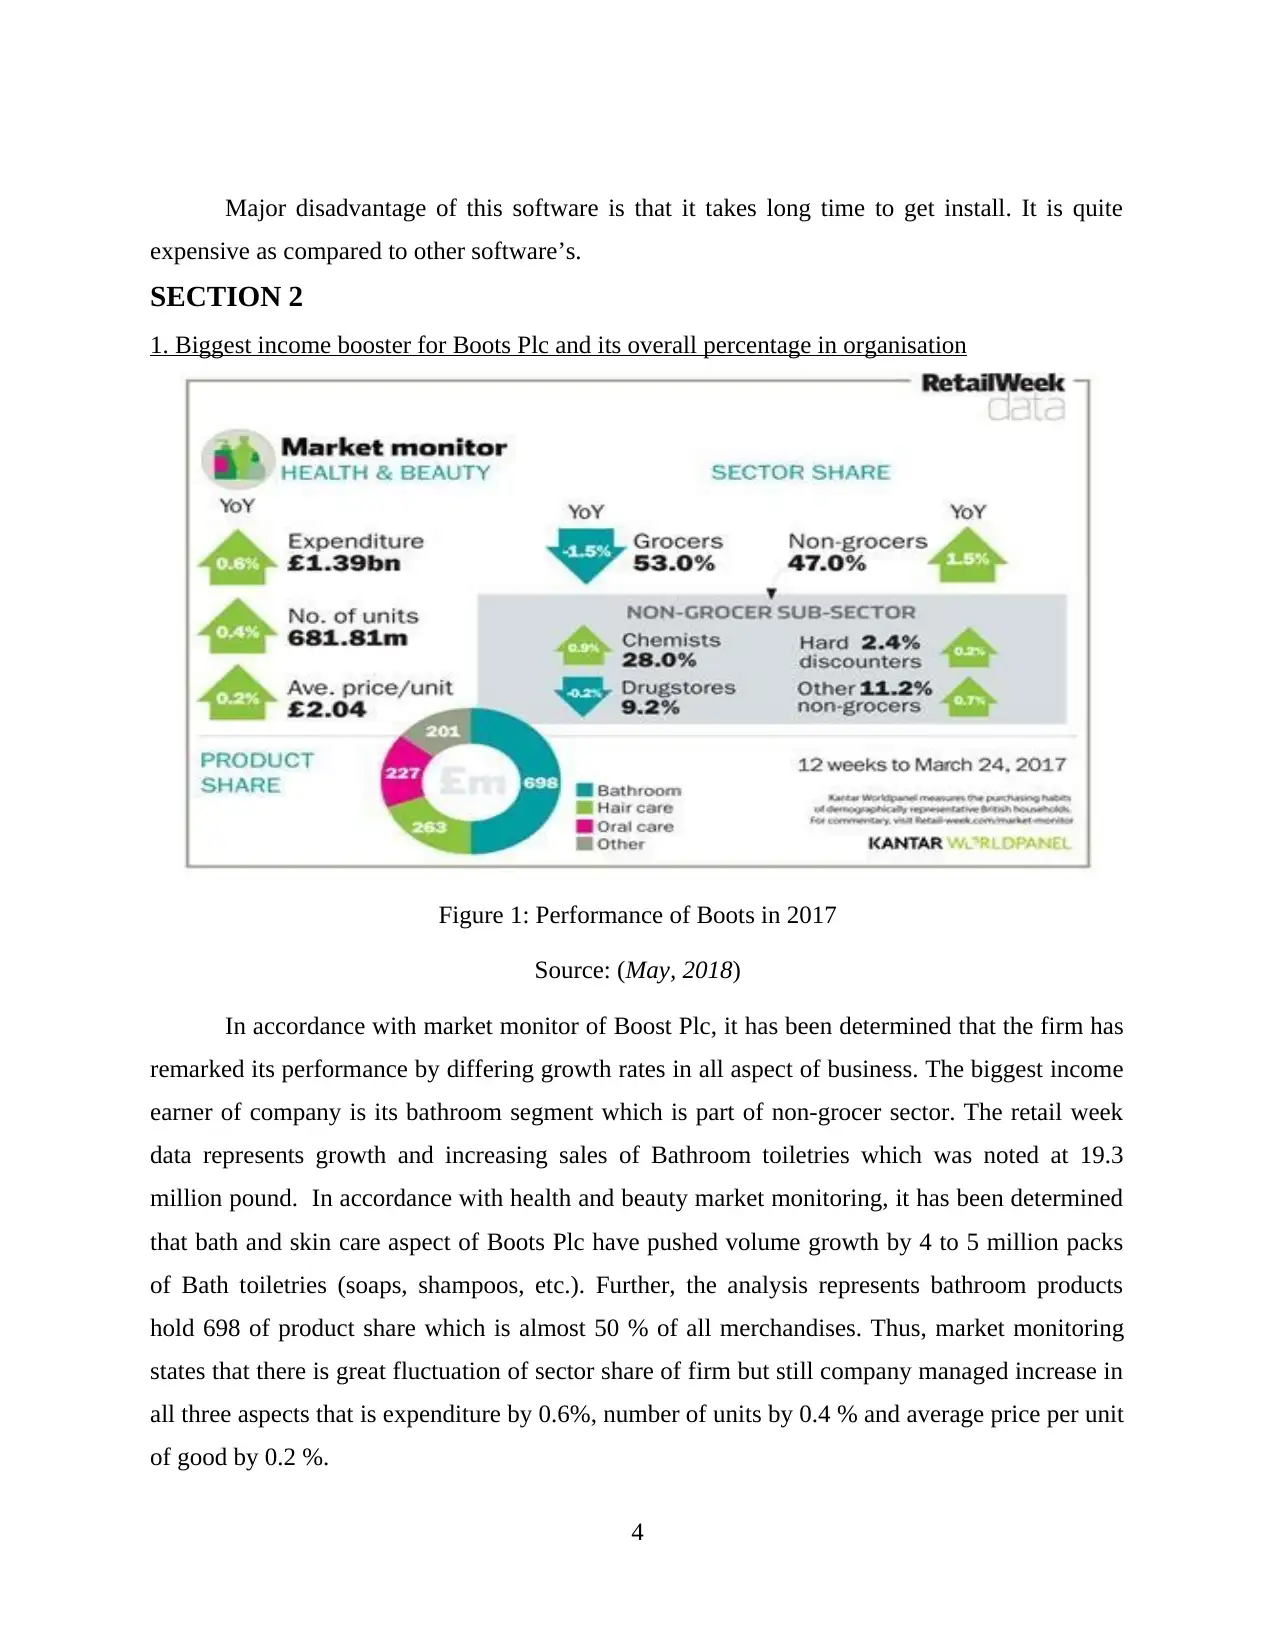
Figure 1: Performance of Boots in 2017
Source: (May, 2018)
In accordance with market monitor of Boost Plc, it has been determined that the firm has
remarked its performance by differing growth rates in all aspect of business. The biggest income
earner of company is its bathroom segment which is part of non-grocer sector. The retail week
data represents growth and increasing sales of Bathroom toiletries which was noted at 19.3
million pound. In accordance with health and beauty market monitoring, it has been determined
that bath and skin care aspect of Boots Plc have pushed volume growth by 4 to 5 million packs
of Bath toiletries (soaps, shampoos, etc.). Further, the analysis represents bathroom products
hold 698 of product share which is almost 50 % of all merchandises. Thus, market monitoring
states that there is great fluctuation of sector share of firm but still company managed increase in
all three aspects that is expenditure by 0.6%, number of units by 0.4 % and average price per unit
of good by 0.2 %.
4
expensive as compared to other software’s.
SECTION 2
1. Biggest income booster for Boots Plc and its overall percentage in organisation
Figure 1: Performance of Boots in 2017
Source: (May, 2018)
In accordance with market monitor of Boost Plc, it has been determined that the firm has
remarked its performance by differing growth rates in all aspect of business. The biggest income
earner of company is its bathroom segment which is part of non-grocer sector. The retail week
data represents growth and increasing sales of Bathroom toiletries which was noted at 19.3
million pound. In accordance with health and beauty market monitoring, it has been determined
that bath and skin care aspect of Boots Plc have pushed volume growth by 4 to 5 million packs
of Bath toiletries (soaps, shampoos, etc.). Further, the analysis represents bathroom products
hold 698 of product share which is almost 50 % of all merchandises. Thus, market monitoring
states that there is great fluctuation of sector share of firm but still company managed increase in
all three aspects that is expenditure by 0.6%, number of units by 0.4 % and average price per unit
of good by 0.2 %.
4
⊘ This is a preview!⊘
Do you want full access?
Subscribe today to unlock all pages.
Trusted by 1+ million students worldwide
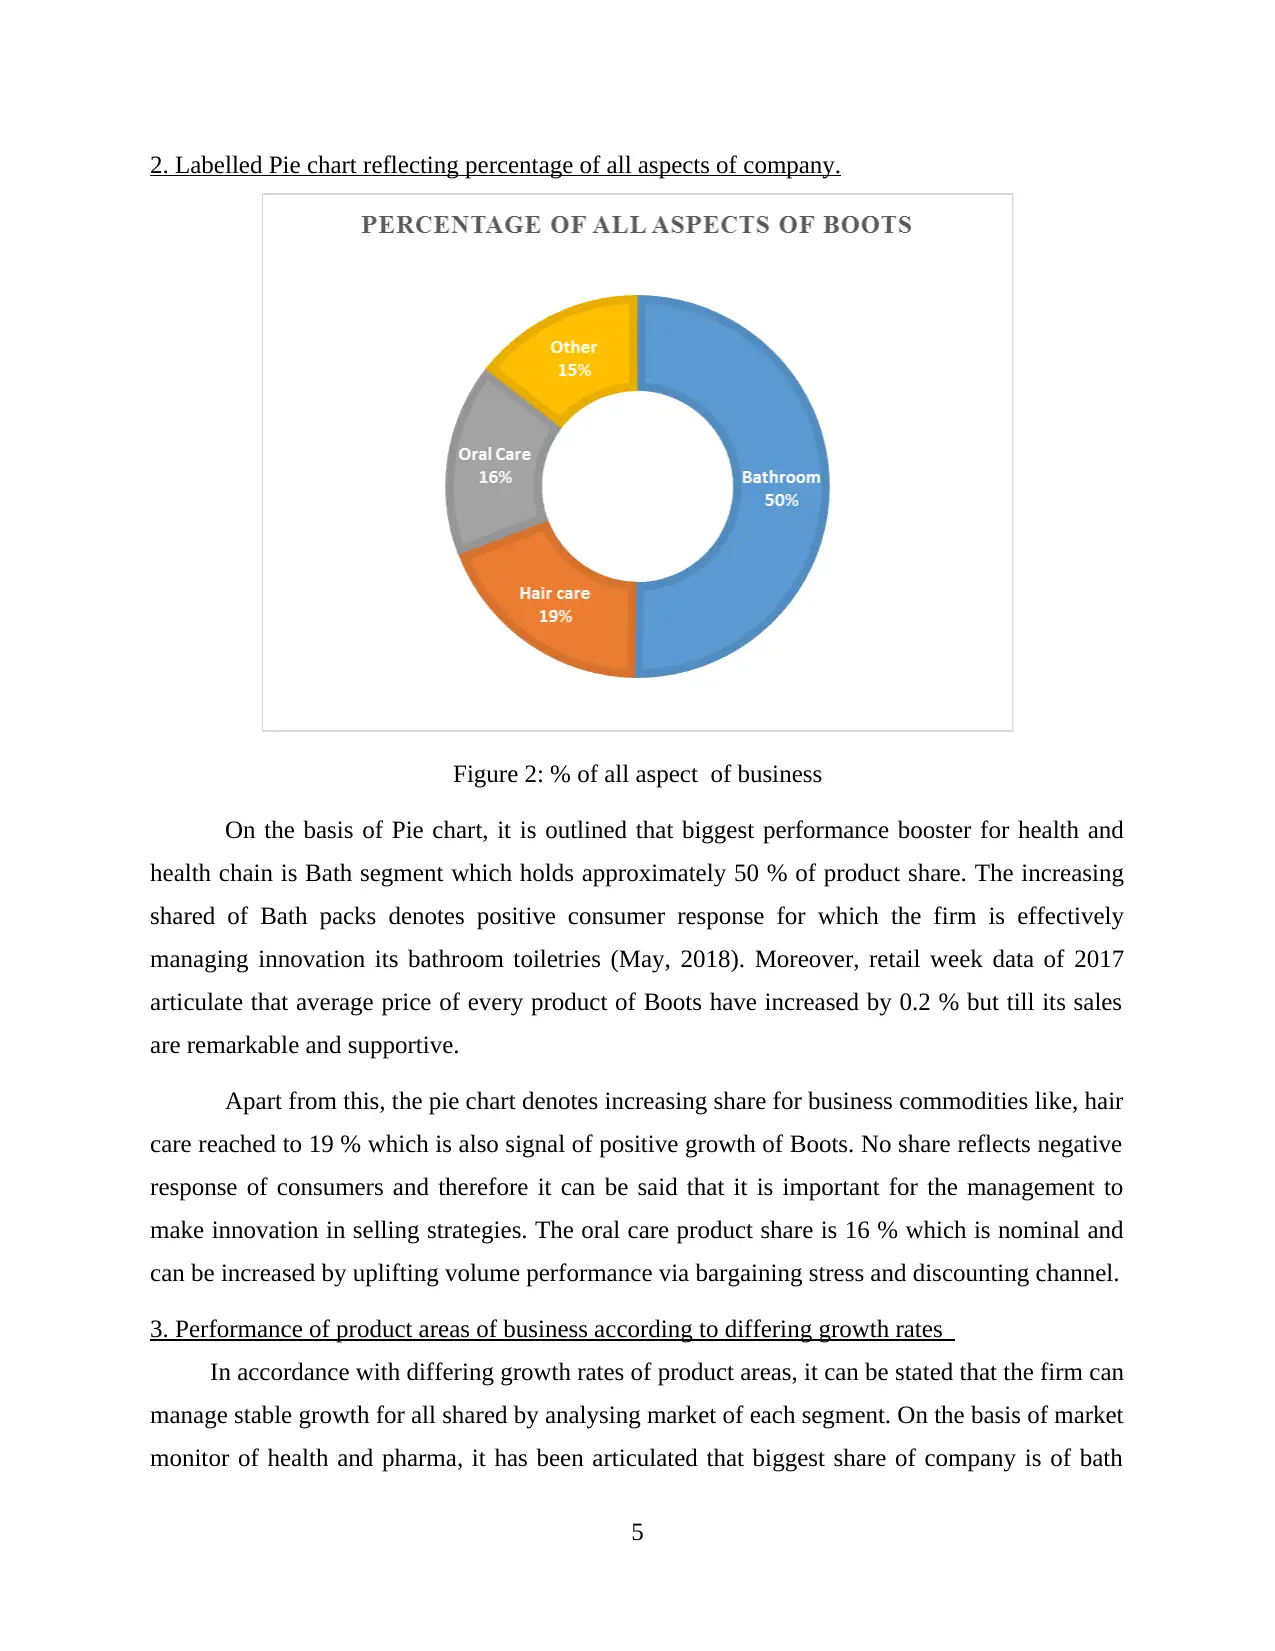
2. Labelled Pie chart reflecting percentage of all aspects of company.
Figure 2: % of all aspect of business
On the basis of Pie chart, it is outlined that biggest performance booster for health and
health chain is Bath segment which holds approximately 50 % of product share. The increasing
shared of Bath packs denotes positive consumer response for which the firm is effectively
managing innovation its bathroom toiletries (May, 2018). Moreover, retail week data of 2017
articulate that average price of every product of Boots have increased by 0.2 % but till its sales
are remarkable and supportive.
Apart from this, the pie chart denotes increasing share for business commodities like, hair
care reached to 19 % which is also signal of positive growth of Boots. No share reflects negative
response of consumers and therefore it can be said that it is important for the management to
make innovation in selling strategies. The oral care product share is 16 % which is nominal and
can be increased by uplifting volume performance via bargaining stress and discounting channel.
3. Performance of product areas of business according to differing growth rates
In accordance with differing growth rates of product areas, it can be stated that the firm can
manage stable growth for all shared by analysing market of each segment. On the basis of market
monitor of health and pharma, it has been articulated that biggest share of company is of bath
5
Paraphrase This Document
Need a fresh take? Get an instant paraphrase of this document with our AI Paraphraser
toiletries from which purchase of 4 to 5 million packs of bath and skin have increased in
comparison to sales of 2016. Further, as per retail week monitoring Boots is biggest contributor
to skin care market and has managed rise in sales by 13 million pound by selling 11 million
products.
The segment division of Boots are proportional to each other like where non grocer share
increased by 47 % and non-grocer decreased by 53%. As per sector share it is clear that non
grocer market of firm has increased by 1.5 % whereas grocer share increased by -1.5 %. Apart
from this, non-grocer sector is divided into subdivision which had great fluctuation in segments
like Chemist share increased by 0.9 % whereas drug stores decreased by -0.2 %. On the other
hand, hard discounter commodity shares of business increased by 0.2 % and other non-grocers
rose by 0.7 %. The reason behind differing growth rate of products of retail chain is its selling
strategy like the firm has local pharmacy which is focused on health (Taube and Minner, 2018).
The company owns community based health care outlets. The stores are located at convenient
location in order to reach maximum numbers of buyers.
In consequence with product share, it can be articulated that calculating product share is
the most important criteria to indicate success and growth. As per market monitor of health and
pharmacy commodity share of Boots Plc has managed remarkable growth in shares like bath
products has grabbed almost 50 percent which is 698. In addition, hair care is recorded at 2663
while oral care is at 227. The labelling denotes increasing share of segments which is beneficial
for the revenue management and growth of retail chain. Consequently, it can be argued that
majority contributor in growth of Boots Plc are skin and bath packs which are offered at bargain
stores and discounted channel.
Accordingly, buyers of health and pharma chain are retained even after average increase in
per unit by 0.2% because of its loyalty cards programme. In this consumer holds special benefits
over buying products and therefore these are known as advantage cards. As per retail week data,
it has been determined that there is continuous increase in expenditure by 0.6 % and number of
units by 0.4 % is the core reason behind different growth rates of different products. In
accordance with this, it is analysed that improving online presence has boosted demand of
products of Boots Plc. Thus, from the discussion it outlined that strategies for improving e-
commerce capabilities have enable growth opportunities to retailer, which is the reason behind
6
fluctuation in growth rate and boosting performance of product areas (Morgan, Tallontire and
Foxon, 2017).
4. Recommendation of strategy to Boots for consolidating position in market
As per market monitor data of Boots PLC, it has been identified that firm is facing rapid
fluctuation on growth rates. Recommendation on consolidating market positioning will based on
firm strategy of offering products. Retail chain offers packs at bargain stores, discounted
channel, flagship stores where the management offers specialised care services like, hearing and
optical. Further, Boots have enhanced its in store experience by providing free Wi-Fi and own
radio station (Superbrands case studies – Boots, 2008). This supports store environment of health
pharma retail chain and also assist company in promotion and campaigning. It is essential for
retail chain to have sense of stability in profits, income, and business operations by
amalgamating its market position
In accordance with all these changes in health and Pharma organisation, it can be
suggested that firm should focus on uniting its position in market by focusing on its both type of
markets that is grocers and non-grocer. There is not a great decease in grocer sector share of
Boots and therefore it can be managed by implementing use of different market positioning
strategy like, competitor approach with the help of which Boots will be able to analyse strengths
and weakness of rivalry firm (Nagle and Müller, 2017). Determining flaw and assets of
competitors is strategic approach to target opportunities. The market positioning strategy will
help health and pharma retail chain in evaluating needs of improvement in its grocer sector. On
the other hand, it will help the business in stabilising it non grocer market is growing at fast pace.
Apart from this, the firm should make use of product class approach which is best strategy
of unity market position. The approach provides company opportunity to segment is products in
order to offer easy buying experience to consumers. As per this strategy the firm will be able to
segregate its wide range of variety products which will easier of consumers to target (Wang and
et.al., 2018). For example, bath products will be further segregated into cleansing segment which
will comprise products like, shampoos, soaps, etc. On the other hand, there will be segment of
health which will comprise medicine and treatments like sugar free gums, nicotine therapy, etc.
The division of products on the basis product user approach will be useful for Boots because it
will categorise product share according to buyers buying needs. Moreover, the approach is
7
⊘ This is a preview!⊘
Do you want full access?
Subscribe today to unlock all pages.
Trusted by 1+ million students worldwide
effective because classification of sector and product share will help the firm in clearly defining
the needs of improvement in particular area.
Similarly, Boots should implement the use of competitive pricing strategy and price quality
approach which will aid the company in gaining consumer attention. The strategic management
is the best option which will helps the business in uniting market position for its both sectors that
is grocer and non-grocer. Like, for non-grocer market which is increasing the company can focus
on price quality with the help of which the business will able to consolidate its non-grocer
product market (Foss, Foss and Klein, 2018). However, competitive pricing will be effective for
grocer sector of Boots because it will derive buyers shift, as in this organisation charged low
price of competitive commodity to gain consumer interest and attention. Hence, it can be
outlined that it is necessary for Boots Plc to implement the use of market positioning strategies to
consolidate its market position.
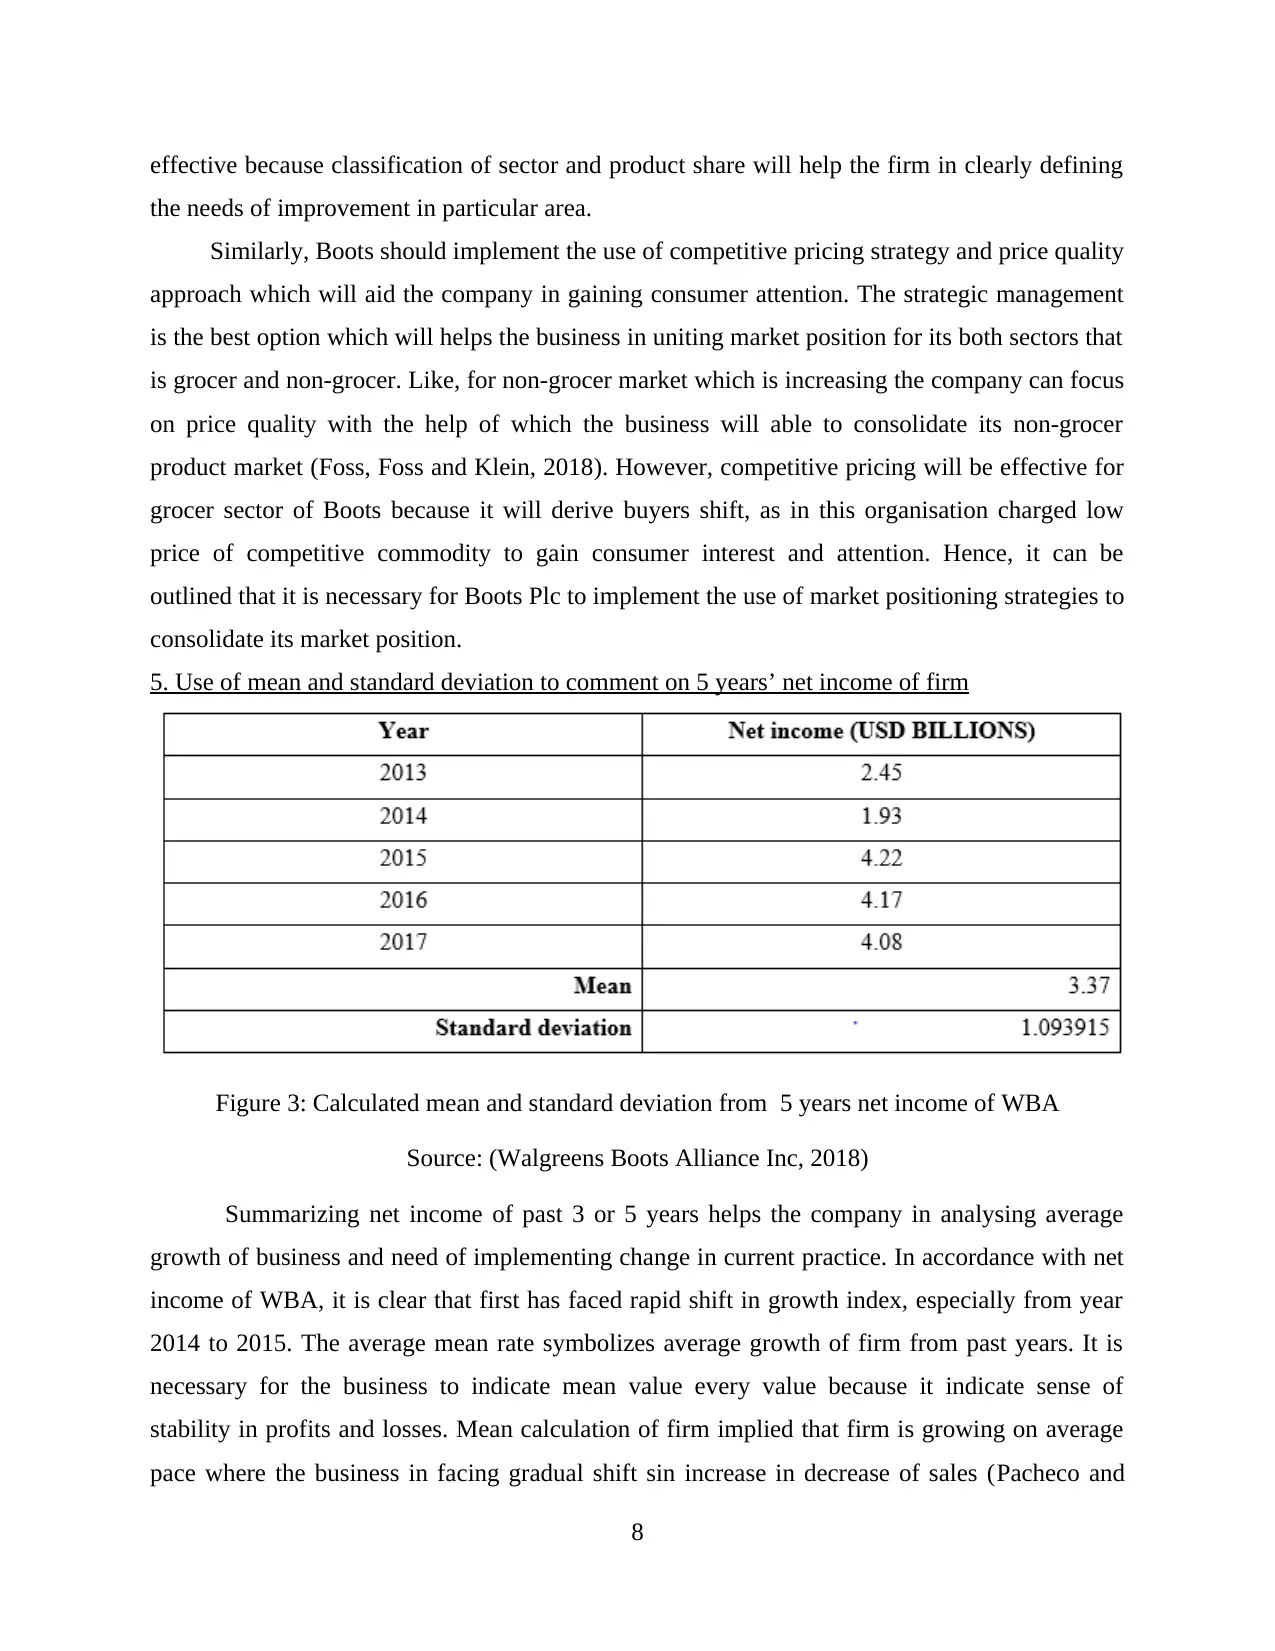
5. Use of mean and standard deviation to comment on 5 years’ net income of firm
Figure 3: Calculated mean and standard deviation from 5 years net income of WBA
Source: (Walgreens Boots Alliance Inc, 2018)
Summarizing net income of past 3 or 5 years helps the company in analysing average
growth of business and need of implementing change in current practice. In accordance with net
income of WBA, it is clear that first has faced rapid shift in growth index, especially from year
2014 to 2015. The average mean rate symbolizes average growth of firm from past years. It is
necessary for the business to indicate mean value every value because it indicate sense of
stability in profits and losses. Mean calculation of firm implied that firm is growing on average
pace where the business in facing gradual shift sin increase in decrease of sales (Pacheco and
8
the needs of improvement in particular area.
Similarly, Boots should implement the use of competitive pricing strategy and price quality
approach which will aid the company in gaining consumer attention. The strategic management
is the best option which will helps the business in uniting market position for its both sectors that
is grocer and non-grocer. Like, for non-grocer market which is increasing the company can focus
on price quality with the help of which the business will able to consolidate its non-grocer
product market (Foss, Foss and Klein, 2018). However, competitive pricing will be effective for
grocer sector of Boots because it will derive buyers shift, as in this organisation charged low
price of competitive commodity to gain consumer interest and attention. Hence, it can be
outlined that it is necessary for Boots Plc to implement the use of market positioning strategies to
consolidate its market position.
5. Use of mean and standard deviation to comment on 5 years’ net income of firm
Figure 3: Calculated mean and standard deviation from 5 years net income of WBA
Source: (Walgreens Boots Alliance Inc, 2018)
Summarizing net income of past 3 or 5 years helps the company in analysing average
growth of business and need of implementing change in current practice. In accordance with net
income of WBA, it is clear that first has faced rapid shift in growth index, especially from year
2014 to 2015. The average mean rate symbolizes average growth of firm from past years. It is
necessary for the business to indicate mean value every value because it indicate sense of
stability in profits and losses. Mean calculation of firm implied that firm is growing on average
pace where the business in facing gradual shift sin increase in decrease of sales (Pacheco and
8
Paraphrase This Document
Need a fresh take? Get an instant paraphrase of this document with our AI Paraphraser
Krohling, 2018). 3.37 mean values denoted that there is sense of balance in revenue generation
and profits of WBA. In accordance with financial of 5 years, it is clear the average income and
balance in income is on the basis of increase and decrease in 2015, 2016, and 2017 which is 4.27,
4.17 and 4.08. Consequently, it is important for WBA to manage stability in business operations
in order to manage growth and incline of income.
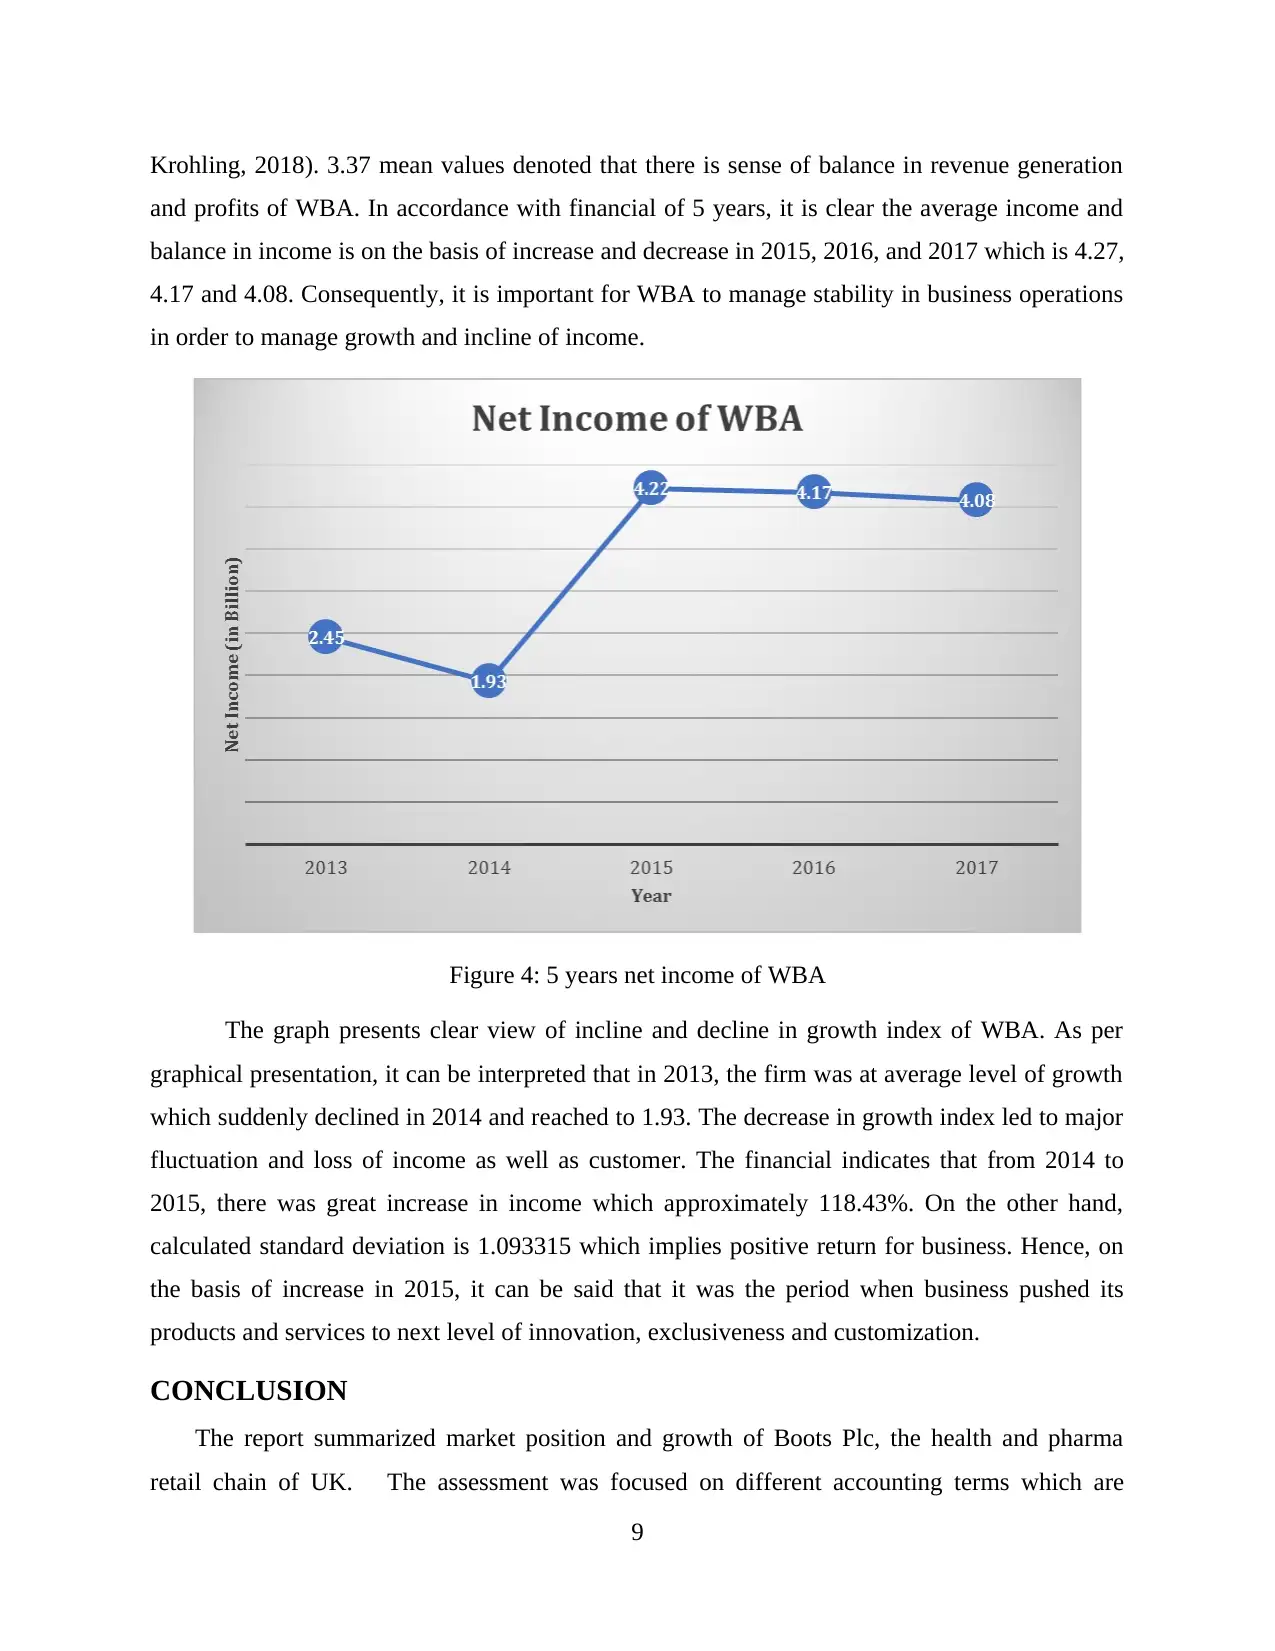
Figure 4: 5 years net income of WBA
The graph presents clear view of incline and decline in growth index of WBA. As per
graphical presentation, it can be interpreted that in 2013, the firm was at average level of growth
which suddenly declined in 2014 and reached to 1.93. The decrease in growth index led to major
fluctuation and loss of income as well as customer. The financial indicates that from 2014 to
2015, there was great increase in income which approximately 118.43%. On the other hand,
calculated standard deviation is 1.093315 which implies positive return for business. Hence, on
the basis of increase in 2015, it can be said that it was the period when business pushed its
products and services to next level of innovation, exclusiveness and customization.
CONCLUSION
The report summarized market position and growth of Boots Plc, the health and pharma
retail chain of UK. The assessment was focused on different accounting terms which are
9
and profits of WBA. In accordance with financial of 5 years, it is clear the average income and
balance in income is on the basis of increase and decrease in 2015, 2016, and 2017 which is 4.27,
4.17 and 4.08. Consequently, it is important for WBA to manage stability in business operations
in order to manage growth and incline of income.
Figure 4: 5 years net income of WBA
The graph presents clear view of incline and decline in growth index of WBA. As per
graphical presentation, it can be interpreted that in 2013, the firm was at average level of growth
which suddenly declined in 2014 and reached to 1.93. The decrease in growth index led to major
fluctuation and loss of income as well as customer. The financial indicates that from 2014 to
2015, there was great increase in income which approximately 118.43%. On the other hand,
calculated standard deviation is 1.093315 which implies positive return for business. Hence, on
the basis of increase in 2015, it can be said that it was the period when business pushed its
products and services to next level of innovation, exclusiveness and customization.
CONCLUSION
The report summarized market position and growth of Boots Plc, the health and pharma
retail chain of UK. The assessment was focused on different accounting terms which are
9
beneficial for evaluating financial position of business like, cash flow and income statement.
Moreover, it outlined retail week data and labelled pie chart demonstrating product share of
company. Besides, it derived performance of merchandise in accordance with differing growth
rates from which it has been determined that bath packs of Boots are denoting positive consumer
response. Thus, report concluded by indicating average mean and standard deviation of WBA, by
calculating 5 years’ net income.
10
⊘ This is a preview!⊘
Do you want full access?
Subscribe today to unlock all pages.
Trusted by 1+ million students worldwide
1 out of 14
Related Documents


Your All-in-One AI-Powered Toolkit for Academic Success.
+13062052269
info@desklib.com
Available 24*7 on WhatsApp / Email
![[object Object]](/_next/static/media/star-bottom.7253800d.svg)
Unlock your academic potential
Copyright © 2020–2026 A2Z Services. All Rights Reserved. Developed and managed by ZUCOL.