BOB’s BOOZIN’ BOBBER: Market Segmentation, KPI, and Customer Analysis

Verified

Added on  2022/08/13

|14
|333
|17
Presentation
AI Summary
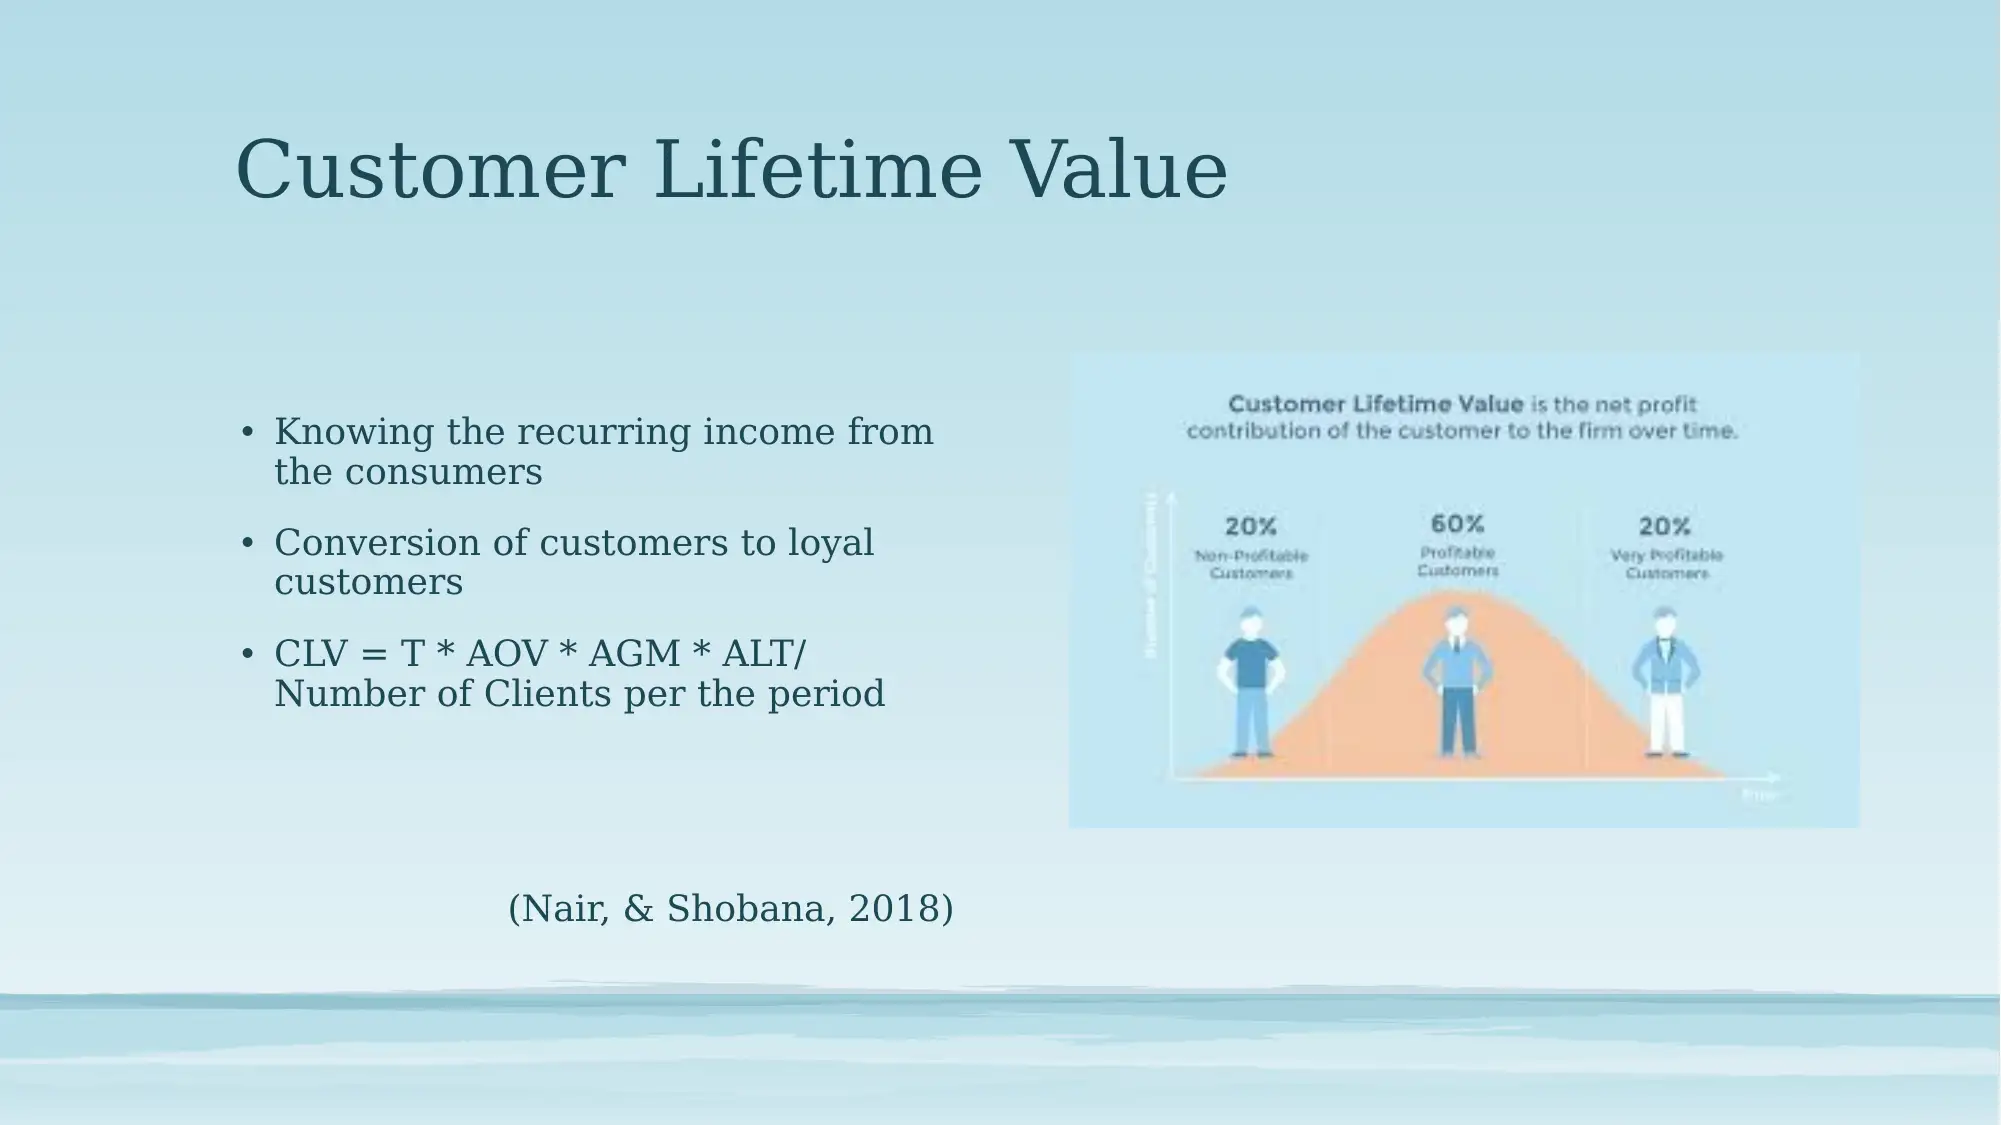
This presentation analyzes Bob's Booze Boat, a company offering party boat services with alcohol, food, and entertainment. It begins with an introduction to market segmentation and its importance, followed by a detailed analysis of the target market, including singles aged 21-35, tourists, college students, and vacationers. The presentation explores various market segments and identifies customer pain points. It also discusses Key Performance Indicators (KPIs) such as revenue, cost per lead, customer lifetime value, and organic traffic, explaining their significance in measuring marketing effectiveness. The analysis includes references to relevant academic sources to support the findings and recommendations for improving the business's marketing strategies. The presentation aims to provide insights into how Bob's Booze Boat can better target its market and improve its overall performance.
tabler-icon-diamond-filled.svg

Contribute Materials

Your contribution can guide someone’s learning journey. Share your documents today.
Document Page
BOB’s BOOZING
BOBBER
tabler-icon-diamond-filled.svg

Secure Best Marks with AI Grader

Need help grading? Try our AI Grader for instant feedback on your assignments.
Document Page
Sales Projection
Document Page
Particulars Q1 Q2 Q3 Q4 Year 1
Forecasted Unit sales 300.00 350.00 400.00 $ 450.00 1,500
Per Unit $1,500 $1,500 $1,500 $1,500 $ 6,000
Total gross sales $450,000 $525,000 $600,000 $675,000 $ 2,250,000
Sales discounts and allowances $10,000 $12,000 $14,000 $16,000 $ 52,000
Total net sales $440,000 $513,000 $586,000 $659,000 $ 2,198,000
Document Page
Particulars Q1 Q2 Q3 Q4 Year 2
Forecasted Unit sales 500.00 600.00 700.00 800 2,600.00
Per Unit $1,700 $1,700 $1,700
$
1,700 $ 6,800.00
Total gross sales $850,000 $1,020,000 $1,190,000
$
1,360,000 $ 4,420,000.00
Sales discounts and allowances $12,000 $14,000 $20,000
$
3,000 $ 49,000.00
Total net sales $838,000 $1,006,000 $1,170,000
$
1,357,000 $4,371,000
tabler-icon-diamond-filled.svg

Secure Best Marks with AI Grader

Need help grading? Try our AI Grader for instant feedback on your assignments.
Document Page
Particulars Q1 Q2 Q3 Q4 Year 3
Forecasted Unit sales 700.00 750.00 800.00 850.00 3,100
Per Unit $2,000 $2,000 $2,000 $2,000 $ 8,000
Total gross sales $1,400,000 $1,500,000 $1,600,000 $1,700,000 $ 6,200,000
Sales discounts and allowances $15,000 $18,000 $20,000 $22,000 $ 75,000
Total net sales $1,385,000 $1,482,000 $1,580,000 $1,678,000 $ 6,125,000
Document Page
Measuring KPI
Document Page
Key Performance Indicator
It is used to measure the effectiveness of a company
Higher level means more focus on the overall performance
Low levels means focus on process in departments
KPI must be SMART
tabler-icon-diamond-filled.svg

Paraphrase This Document

Need a fresh take? Get an instant paraphrase of this document with our AI Paraphraser
Document Page
Sales Revenue
The revenue brought by the inbound
marketing campaign
Measuring the effectiveness of the inbound
marketing campaign
It can be increased by training the
employees and making them aware of the
goals
(Hillebrandt, Ivens & Krey, 2016)
Document Page
Cost Per Lead
Helps in calculating the customer acquisition cost
The cost of advertisement
The marketing distribution
(Martínez-Rolán, X & Piñeiro-Otero, 2019)
Document Page
Customer Lifetime Value
Knowing the recurring income from
the consumers
Conversion of customers to loyal
customers
CLV = T * AOV * AGM * ALT/
Number of Clients per the period
(Nair, & Shobana, 2018)
tabler-icon-diamond-filled.svg

Secure Best Marks with AI Grader

Need help grading? Try our AI Grader for instant feedback on your assignments.
Document Page
Organic Traffic
The traffic generated from organic
marketing
The ROI that is generated from the
marketing tactics.
(Saura, Palos-Sánchez & Cerdá
Suárez, 2017)
Document Page
References
Hillebrandt, I., Ivens, B. S., & Krey, N. (2016). Key Performance
Indicators for Measuring Employer Brand Success. In Marketing
Challenges in a Turbulent Business Environment (pp. 351-351).
Springer, Cham.
Martínez-Rolán, X., & Piñeiro-Otero, T. (2019). 6 Marketing Analytics:
Why Measuring Web and Social Media Matters. Business Intelligence
and Analytics in Small and Medium Enterprises, 75-88.
Nair, S., & Shobana, S. (2018). Measuring Digital Marketing
Performance: Key Performance Indicators and Metrics. Journal of
Management, 5(6).
Saura, J. R., Palos-Sánchez, P., & Cerdá Suárez, L. M. (2017).
Understanding the digital marketing environment with KPIs and web
analytics. Future Internet, 9(4), 76.
Document Page
tabler-icon-diamond-filled.svg

Paraphrase This Document

Need a fresh take? Get an instant paraphrase of this document with our AI Paraphraser
Document Page
chevron_up_icon
1 out of 14
circle_padding
hide_on_mobile
zoom_out_icon
logo.png

Your All-in-One AI-Powered Toolkit for Academic Success.

Available 24*7 on WhatsApp / Email

[object Object]