Finance for Managers: Boral Limited Capital Structure Analysis Report
VerifiedAdded on 2022/11/11
|13
|2449
|128
Report
AI Summary
This report analyzes the capital structure and payout policies of Boral Limited, an ASX-listed construction materials company. The report begins with an introduction to capital structure, differentiating between debt and equity, and payout policies, which guide dividend distribution. An overview of Boral Limited's operations and financial position is provided, including its capital structure with debt and equity levels, and historical dividend per share and payout ratios. The report evaluates Boral's capital structure, finding the equity level higher than the debt level, and its payout policy, concluding that the company follows a relevant dividend policy by distributing a large share of its profits to shareholders. The report also includes an analysis of an investment opportunity, evaluating a new project's financial projections, including sales, variable costs, and net present value calculations. The conclusion summarizes Boral Limited's financial performance, highlighting areas for improvement in financial policies and structure. The report provides a detailed analysis of the company's financial strategies and performance.
Running Head: Finance for Managers
1
Project Report: Finance for Managers
1
Project Report: Finance for Managers
Paraphrase This Document
Need a fresh take? Get an instant paraphrase of this document with our AI Paraphraser
Finance for Managers
2
Contents
Task 1................................................................................................................................3
Introduction...................................................................................................................3
Company overview.......................................................................................................3
Capital structure and payout policy..............................................................................3
Evaluation of capital structure policy...........................................................................5
Evaluation of payout policy..........................................................................................5
Conclusion....................................................................................................................6
Task 2................................................................................................................................7
References.......................................................................................................................10
Appendix.........................................................................................................................11
Finance for Managers
3
Task 1:
Introduction:
Capital structure is a financial item which contains the various sources through which
funds have been raised by the company in order to maintain the position and liquidity level of
the business. Capital structure determines how an organization raises and manages the funds
to run the overall growth and operations through considering the source of funds of the
business. Usually, capital structure consist debt and equity level. Debt comes in form of long
term and short term bonds, notes payable. On the other hand, equity could be common stock,
retained earnings and preferred stock of the business (Soltani, Nayebzadeh and Moeinaddin,
2014). It becomes important for an organization and its management to manage better
proportion of debt and equity in order to manage the solvency level and cost of capital of the
business.
Along with that, the report also focuses over payout policy. Payout policies are
guidelines prepared for the organization and management. These policies help the
management to decide the dividend payout ratio for the shareholders of the business. Payout
policies are of many types and it is prepared by the business through considering various
factors.
Company overview:
In the report, Boral limited has been takes into consideration. Boral limited is an ASX
listed company which is running its business at overseas market as well. Main operations of
the company consist of manufacturing and supplying the construction and building material
in the Australian market as well as overseas market. The products which includes in the
building and construction materials are concrete, cement, roofing, placing of concrete and
software timber operations. Headquarter of Boral limited is in Sydney, Australia. Three
divisions are run by the company i.e. Boral Australia, USG Boral ad Boral North America
(Home, 2019).
Capital structure and payout policy:
Capital structure in corporate finance depicts about a way in which assets and projects
of the company are finance through raising the funds from equity and debt capital. In other
words, capital structure is a financial item which contains raises and manages the funds to run
⊘ This is a preview!⊘
Do you want full access?
Subscribe today to unlock all pages.
Trusted by 1+ million students worldwide
Finance for Managers
4
the overall growth and operations. It is the combination of debt and equity level. Debt comes
in form of long term and short term bonds, notes payable (Madura, 2011). On the other hand,
equity could be common stock, retained earnings and preferred stock of the business.
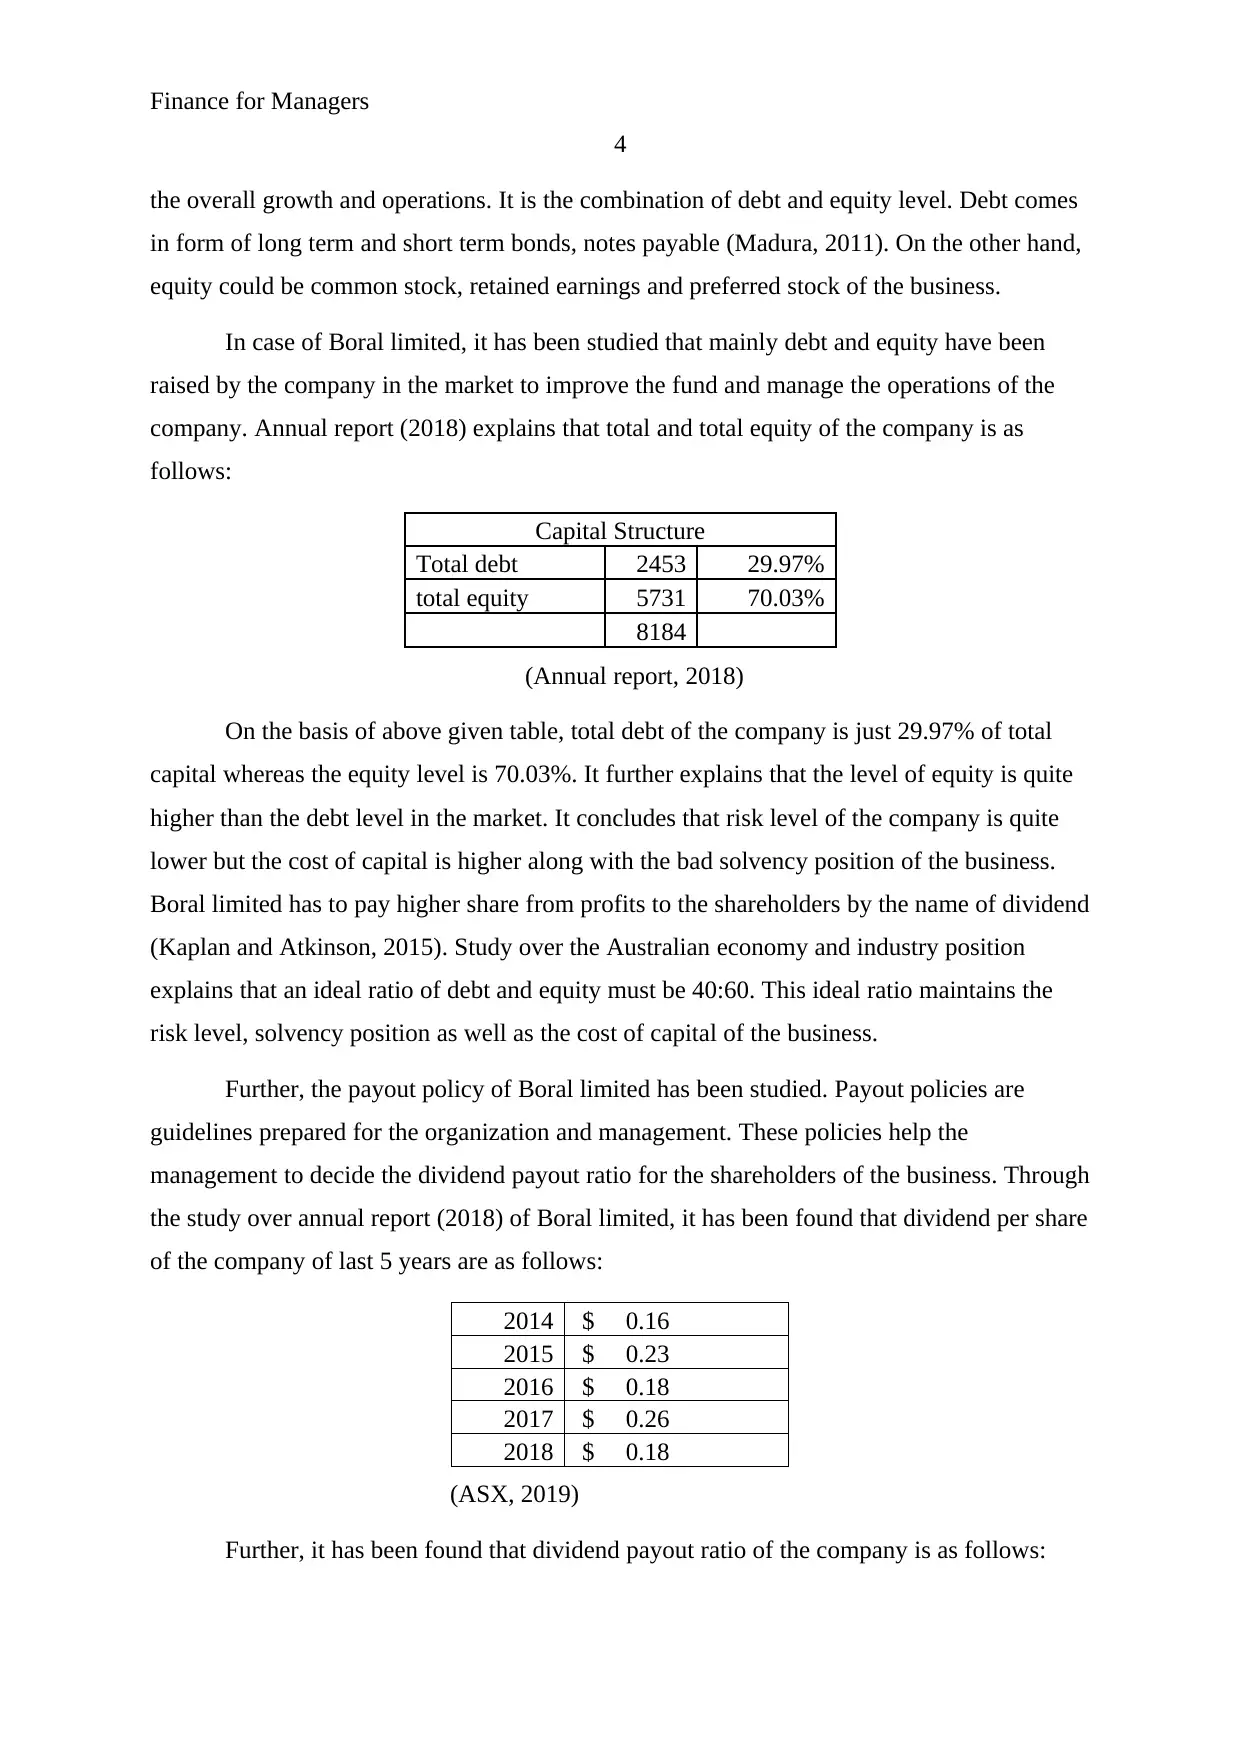
In case of Boral limited, it has been studied that mainly debt and equity have been
raised by the company in the market to improve the fund and manage the operations of the
company. Annual report (2018) explains that total and total equity of the company is as
follows:
Capital Structure
Total debt 2453 29.97%
total equity 5731 70.03%
8184
(Annual report, 2018)
On the basis of above given table, total debt of the company is just 29.97% of total
capital whereas the equity level is 70.03%. It further explains that the level of equity is quite
higher than the debt level in the market. It concludes that risk level of the company is quite
lower but the cost of capital is higher along with the bad solvency position of the business.
Boral limited has to pay higher share from profits to the shareholders by the name of dividend
(Kaplan and Atkinson, 2015). Study over the Australian economy and industry position
explains that an ideal ratio of debt and equity must be 40:60. This ideal ratio maintains the
risk level, solvency position as well as the cost of capital of the business.
Further, the payout policy of Boral limited has been studied. Payout policies are
guidelines prepared for the organization and management. These policies help the
management to decide the dividend payout ratio for the shareholders of the business. Through
the study over annual report (2018) of Boral limited, it has been found that dividend per share
of the company of last 5 years are as follows:
2014 $ 0.16
2015 $ 0.23
2016 $ 0.18
2017 $ 0.26
2018 $ 0.18
(ASX, 2019)
Further, it has been found that dividend payout ratio of the company is as follows:
4
the overall growth and operations. It is the combination of debt and equity level. Debt comes
in form of long term and short term bonds, notes payable (Madura, 2011). On the other hand,
equity could be common stock, retained earnings and preferred stock of the business.
In case of Boral limited, it has been studied that mainly debt and equity have been
raised by the company in the market to improve the fund and manage the operations of the
company. Annual report (2018) explains that total and total equity of the company is as
follows:
Capital Structure
Total debt 2453 29.97%
total equity 5731 70.03%
8184
(Annual report, 2018)
On the basis of above given table, total debt of the company is just 29.97% of total
capital whereas the equity level is 70.03%. It further explains that the level of equity is quite
higher than the debt level in the market. It concludes that risk level of the company is quite
lower but the cost of capital is higher along with the bad solvency position of the business.
Boral limited has to pay higher share from profits to the shareholders by the name of dividend
(Kaplan and Atkinson, 2015). Study over the Australian economy and industry position
explains that an ideal ratio of debt and equity must be 40:60. This ideal ratio maintains the
risk level, solvency position as well as the cost of capital of the business.
Further, the payout policy of Boral limited has been studied. Payout policies are
guidelines prepared for the organization and management. These policies help the
management to decide the dividend payout ratio for the shareholders of the business. Through
the study over annual report (2018) of Boral limited, it has been found that dividend per share
of the company of last 5 years are as follows:
2014 $ 0.16
2015 $ 0.23
2016 $ 0.18
2017 $ 0.26
2018 $ 0.18
(ASX, 2019)
Further, it has been found that dividend payout ratio of the company is as follows:
Paraphrase This Document
Need a fresh take? Get an instant paraphrase of this document with our AI Paraphraser
Finance for Managers
5
Calculation of Dividend payout
Dividend per
share
Earnings per
share
Dividend
payout
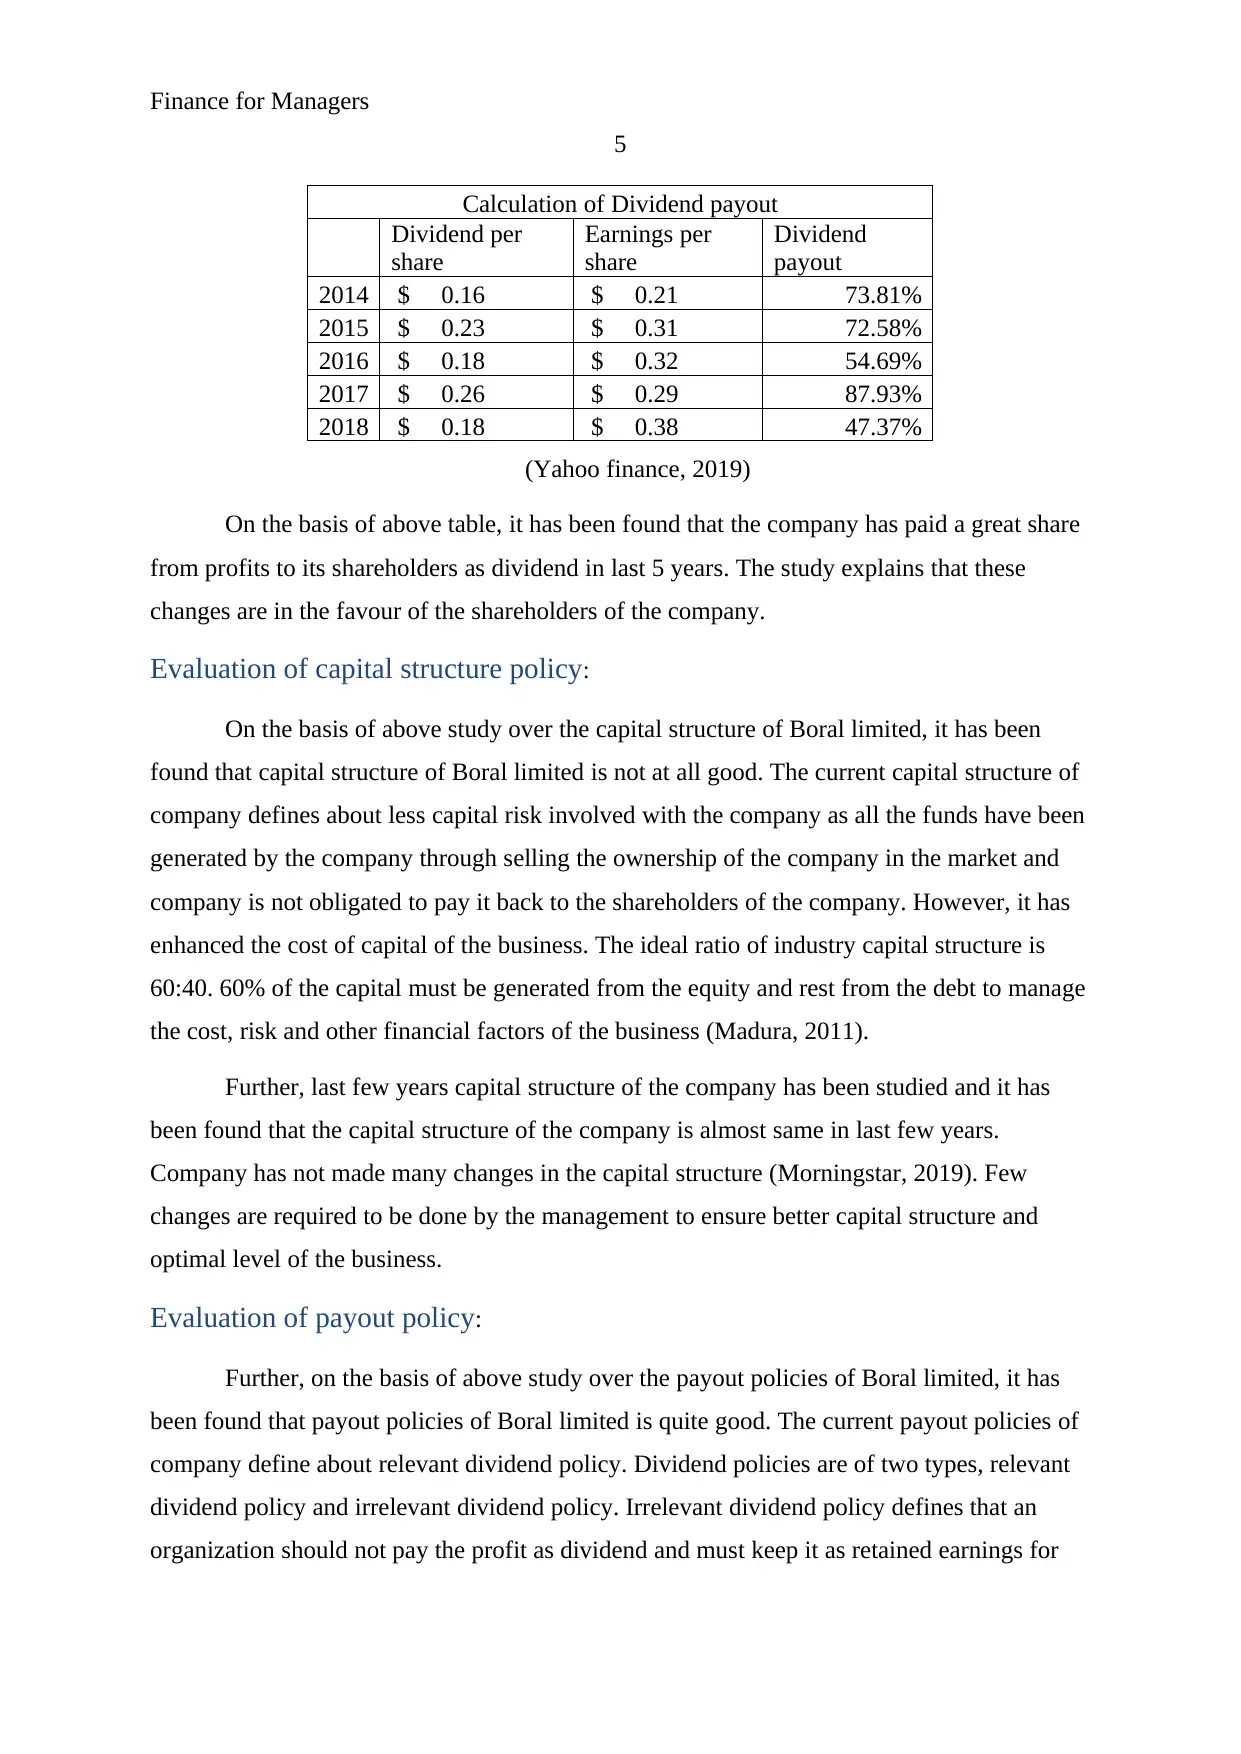
2014 $ 0.16 $ 0.21 73.81%
2015 $ 0.23 $ 0.31 72.58%
2016 $ 0.18 $ 0.32 54.69%
2017 $ 0.26 $ 0.29 87.93%
2018 $ 0.18 $ 0.38 47.37%
(Yahoo finance, 2019)
On the basis of above table, it has been found that the company has paid a great share
from profits to its shareholders as dividend in last 5 years. The study explains that these
changes are in the favour of the shareholders of the company.
Evaluation of capital structure policy:
On the basis of above study over the capital structure of Boral limited, it has been
found that capital structure of Boral limited is not at all good. The current capital structure of
company defines about less capital risk involved with the company as all the funds have been
generated by the company through selling the ownership of the company in the market and
company is not obligated to pay it back to the shareholders of the company. However, it has
enhanced the cost of capital of the business. The ideal ratio of industry capital structure is
60:40. 60% of the capital must be generated from the equity and rest from the debt to manage
the cost, risk and other financial factors of the business (Madura, 2011).
Further, last few years capital structure of the company has been studied and it has
been found that the capital structure of the company is almost same in last few years.
Company has not made many changes in the capital structure (Morningstar, 2019). Few
changes are required to be done by the management to ensure better capital structure and
optimal level of the business.
Evaluation of payout policy:
Further, on the basis of above study over the payout policies of Boral limited, it has
been found that payout policies of Boral limited is quite good. The current payout policies of
company define about relevant dividend policy. Dividend policies are of two types, relevant
dividend policy and irrelevant dividend policy. Irrelevant dividend policy defines that an
organization should not pay the profit as dividend and must keep it as retained earnings for
5
Calculation of Dividend payout
Dividend per
share
Earnings per
share
Dividend
payout
2014 $ 0.16 $ 0.21 73.81%
2015 $ 0.23 $ 0.31 72.58%
2016 $ 0.18 $ 0.32 54.69%
2017 $ 0.26 $ 0.29 87.93%
2018 $ 0.18 $ 0.38 47.37%
(Yahoo finance, 2019)
On the basis of above table, it has been found that the company has paid a great share
from profits to its shareholders as dividend in last 5 years. The study explains that these
changes are in the favour of the shareholders of the company.
Evaluation of capital structure policy:
On the basis of above study over the capital structure of Boral limited, it has been
found that capital structure of Boral limited is not at all good. The current capital structure of
company defines about less capital risk involved with the company as all the funds have been
generated by the company through selling the ownership of the company in the market and
company is not obligated to pay it back to the shareholders of the company. However, it has
enhanced the cost of capital of the business. The ideal ratio of industry capital structure is
60:40. 60% of the capital must be generated from the equity and rest from the debt to manage
the cost, risk and other financial factors of the business (Madura, 2011).
Further, last few years capital structure of the company has been studied and it has
been found that the capital structure of the company is almost same in last few years.
Company has not made many changes in the capital structure (Morningstar, 2019). Few
changes are required to be done by the management to ensure better capital structure and
optimal level of the business.
Evaluation of payout policy:
Further, on the basis of above study over the payout policies of Boral limited, it has
been found that payout policies of Boral limited is quite good. The current payout policies of
company define about relevant dividend policy. Dividend policies are of two types, relevant
dividend policy and irrelevant dividend policy. Irrelevant dividend policy defines that an
organization should not pay the profit as dividend and must keep it as retained earnings for
Finance for Managers
6
further requirement of the business. Shareholders could earn the profits through selling the
stock in the market (Miller and Modigliani, 1961). However, relevant dividend policy defines
that an organization should pay a large share of profit as dividend to the stockholders of the
company. It would attract the investors to invest more in the company.
In case of Boral limited, it has been found that a large share of profit is given to the
shareholders of the company which means company is following relevant dividend policy.
The company attracts more investors towards investment in the company because of higher
dividend payout and better return in the stocks of the company (Soltani, Nayebzadeh and
Moeinaddin, 2014).
Further, last few years dividend payout policy of the company has been studied and it
has been found that the dividend payout policy of the company is almost same in last few
years (Annual report, 2018). Company has not made many changes in the payout structure.
And the current level of payout structure is quite good.
Conclusion:
To conclude, Boral limited is performing well in the Australian market. The financial
position of the company is enough strong. However, few changes into the financial policies
and structure could improve the performance of the company at a great extent. Now it
becomes important for the company to manage the risk level as well as cost level of the
company to improve the overall position in the industry and the capital market. Also, the
payout policy of the company is quite strong and attracts the investors to invest more in the
company.
⊘ This is a preview!⊘
Do you want full access?
Subscribe today to unlock all pages.
Trusted by 1+ million students worldwide
Finance for Managers
7
Task 2:
To: One pack’s CEO
From: Financial Analyst
Subject: Analysis over investment opportunity
Dear Sir,
On the basis of your given data, capital budgeting study has been done over one pack’s
new investment proposal. The study explains that company is looking for few environmental
ways to reduce the energy cost and impact over the environment. On the basis of study it has
been found that financial projection over recycling sachet waste explains that economically
and socially, it is a good step by the company. But in terms of finance, company could have
faced few issues.
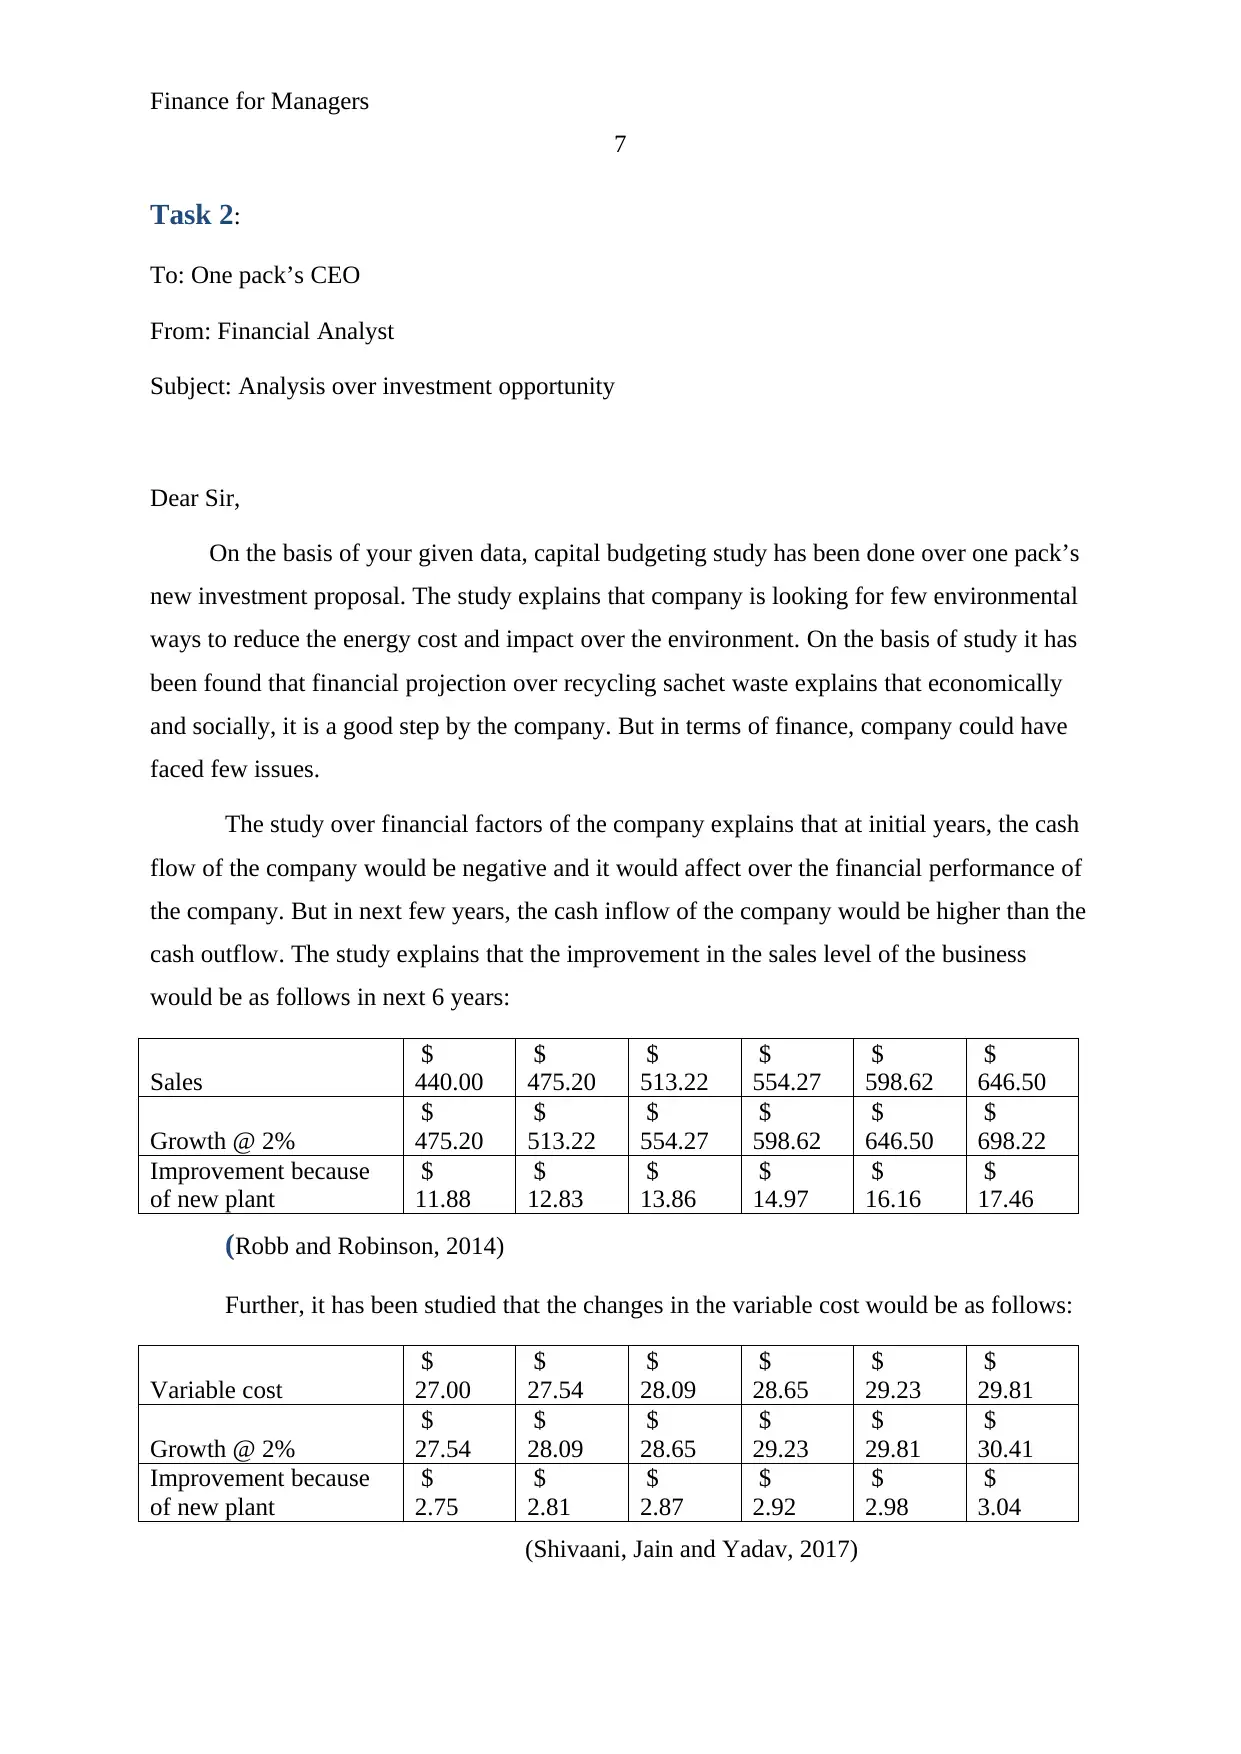
The study over financial factors of the company explains that at initial years, the cash
flow of the company would be negative and it would affect over the financial performance of
the company. But in next few years, the cash inflow of the company would be higher than the
cash outflow. The study explains that the improvement in the sales level of the business
would be as follows in next 6 years:
Sales
$
440.00
$
475.20
$
513.22
$
554.27
$
598.62
$
646.50
Growth @ 2%
$
475.20
$
513.22
$
554.27
$
598.62
$
646.50
$
698.22
Improvement because
of new plant
$
11.88
$
12.83
$
13.86
$
14.97
$
16.16
$
17.46
(Robb and Robinson, 2014)
Further, it has been studied that the changes in the variable cost would be as follows:
Variable cost
$
27.00
$
27.54
$
28.09
$
28.65
$
29.23
$
29.81
Growth @ 2%
$
27.54
$
28.09
$
28.65
$
29.23
$
29.81
$
30.41
Improvement because
of new plant
$
2.75
$
2.81
$
2.87
$
2.92
$
2.98
$
3.04
(Shivaani, Jain and Yadav, 2017)
7
Task 2:
To: One pack’s CEO
From: Financial Analyst
Subject: Analysis over investment opportunity
Dear Sir,
On the basis of your given data, capital budgeting study has been done over one pack’s
new investment proposal. The study explains that company is looking for few environmental
ways to reduce the energy cost and impact over the environment. On the basis of study it has
been found that financial projection over recycling sachet waste explains that economically
and socially, it is a good step by the company. But in terms of finance, company could have
faced few issues.
The study over financial factors of the company explains that at initial years, the cash
flow of the company would be negative and it would affect over the financial performance of
the company. But in next few years, the cash inflow of the company would be higher than the
cash outflow. The study explains that the improvement in the sales level of the business
would be as follows in next 6 years:
Sales
$
440.00
$
475.20
$
513.22
$
554.27
$
598.62
$
646.50
Growth @ 2%
$
475.20
$
513.22
$
554.27
$
598.62
$
646.50
$
698.22
Improvement because
of new plant
$
11.88
$
12.83
$
13.86
$
14.97
$
16.16
$
17.46
(Robb and Robinson, 2014)
Further, it has been studied that the changes in the variable cost would be as follows:
Variable cost
$
27.00
$
27.54
$
28.09
$
28.65
$
29.23
$
29.81
Growth @ 2%
$
27.54
$
28.09
$
28.65
$
29.23
$
29.81
$
30.41
Improvement because
of new plant
$
2.75
$
2.81
$
2.87
$
2.92
$
2.98
$
3.04
(Shivaani, Jain and Yadav, 2017)
Paraphrase This Document
Need a fresh take? Get an instant paraphrase of this document with our AI Paraphraser
Finance for Managers
8
Along with that, it has been studied that interest expenses of the company are
included in the cost of capital of the business and hence, it has not been determined in the
capital budgeting cash flows of the business. Also, the sales of old machineries are investing
activity cash flow and hence, it has not been added into the cash flow of the business.
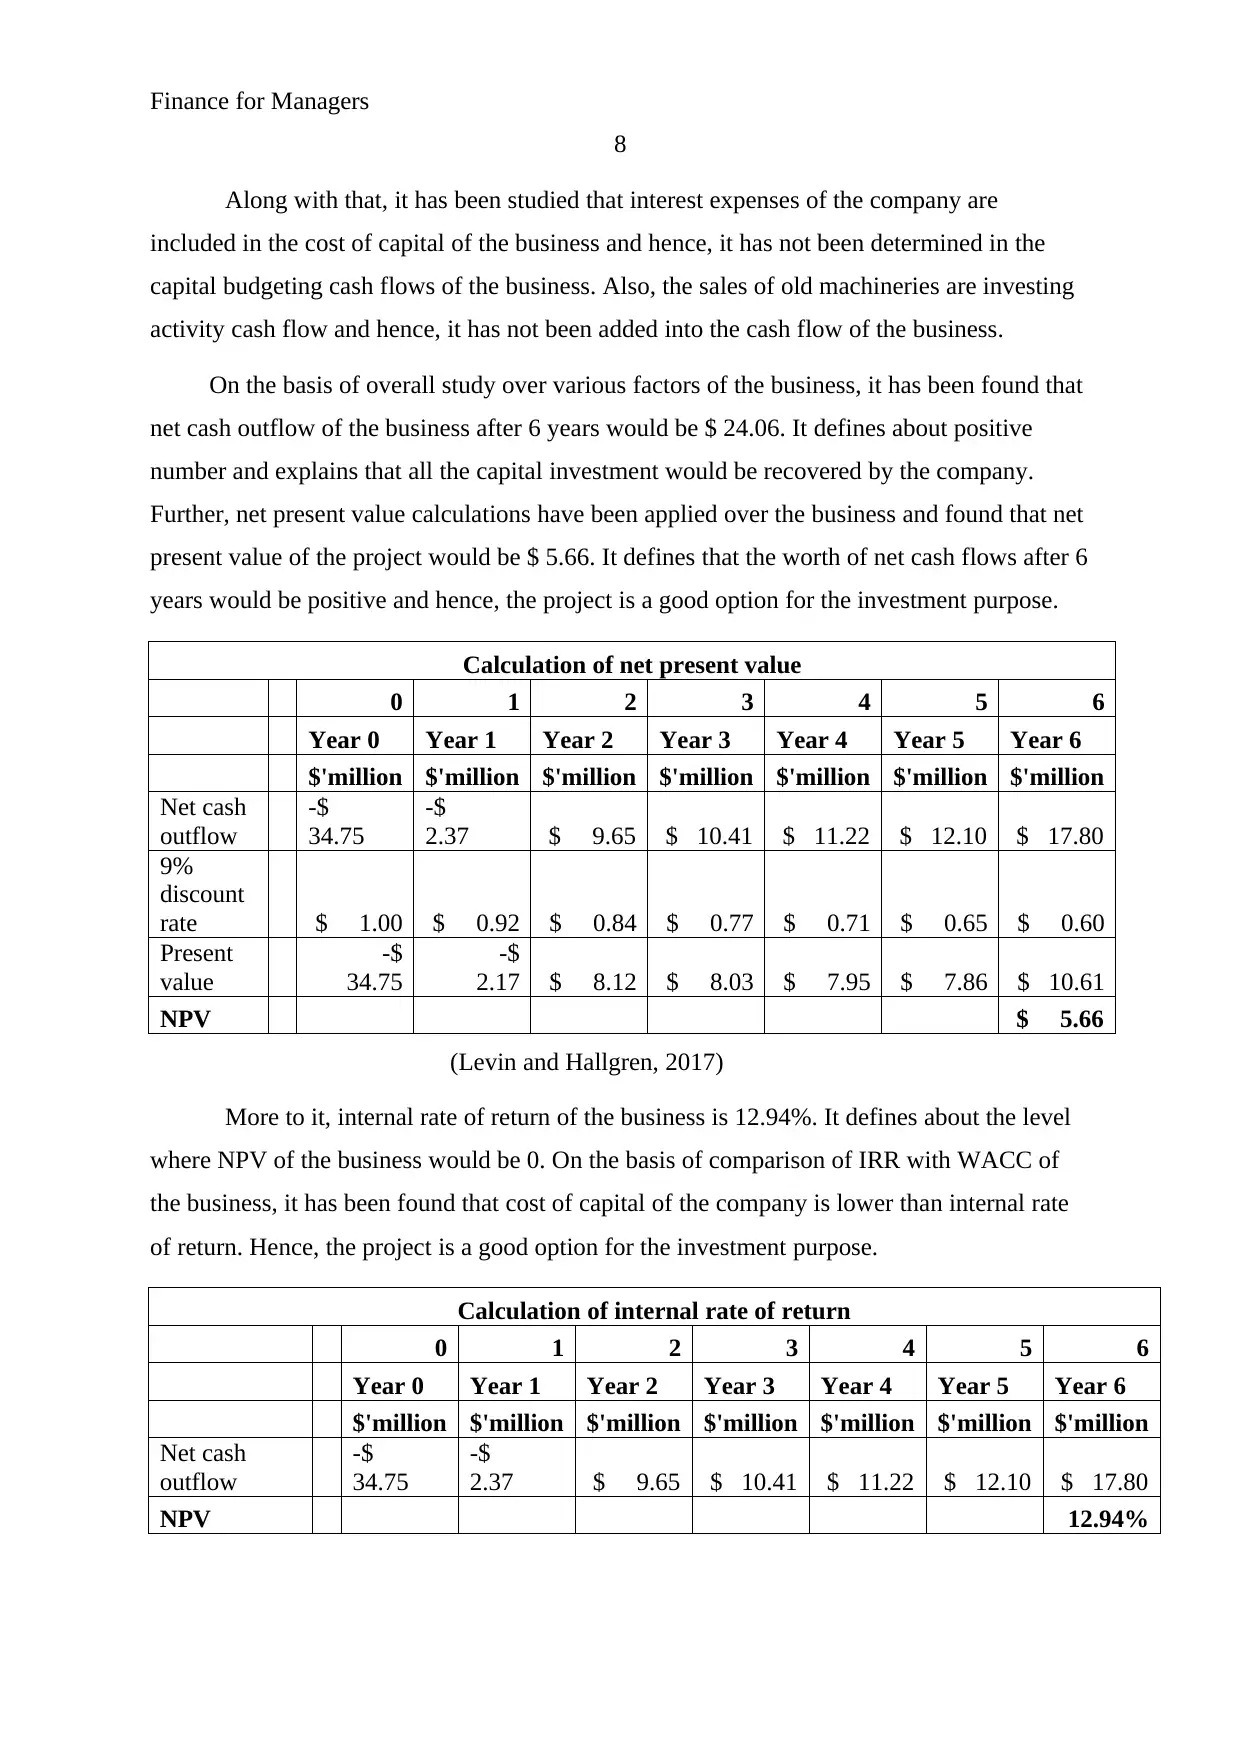
On the basis of overall study over various factors of the business, it has been found that
net cash outflow of the business after 6 years would be $ 24.06. It defines about positive
number and explains that all the capital investment would be recovered by the company.
Further, net present value calculations have been applied over the business and found that net
present value of the project would be $ 5.66. It defines that the worth of net cash flows after 6
years would be positive and hence, the project is a good option for the investment purpose.
Calculation of net present value
0 1 2 3 4 5 6
Year 0 Year 1 Year 2 Year 3 Year 4 Year 5 Year 6
$'million $'million $'million $'million $'million $'million $'million
Net cash
outflow
-$
34.75
-$
2.37 $ 9.65 $ 10.41 $ 11.22 $ 12.10 $ 17.80
9%
discount
rate $ 1.00 $ 0.92 $ 0.84 $ 0.77 $ 0.71 $ 0.65 $ 0.60
Present
value
-$
34.75
-$
2.17 $ 8.12 $ 8.03 $ 7.95 $ 7.86 $ 10.61
NPV $ 5.66
(Levin and Hallgren, 2017)
More to it, internal rate of return of the business is 12.94%. It defines about the level
where NPV of the business would be 0. On the basis of comparison of IRR with WACC of
the business, it has been found that cost of capital of the company is lower than internal rate
of return. Hence, the project is a good option for the investment purpose.
Calculation of internal rate of return
0 1 2 3 4 5 6
Year 0 Year 1 Year 2 Year 3 Year 4 Year 5 Year 6
$'million $'million $'million $'million $'million $'million $'million
Net cash
outflow
-$
34.75
-$
2.37 $ 9.65 $ 10.41 $ 11.22 $ 12.10 $ 17.80
NPV 12.94%
8
Along with that, it has been studied that interest expenses of the company are
included in the cost of capital of the business and hence, it has not been determined in the
capital budgeting cash flows of the business. Also, the sales of old machineries are investing
activity cash flow and hence, it has not been added into the cash flow of the business.
On the basis of overall study over various factors of the business, it has been found that
net cash outflow of the business after 6 years would be $ 24.06. It defines about positive
number and explains that all the capital investment would be recovered by the company.
Further, net present value calculations have been applied over the business and found that net
present value of the project would be $ 5.66. It defines that the worth of net cash flows after 6
years would be positive and hence, the project is a good option for the investment purpose.
Calculation of net present value
0 1 2 3 4 5 6
Year 0 Year 1 Year 2 Year 3 Year 4 Year 5 Year 6
$'million $'million $'million $'million $'million $'million $'million
Net cash
outflow
-$
34.75
-$
2.37 $ 9.65 $ 10.41 $ 11.22 $ 12.10 $ 17.80
9%
discount
rate $ 1.00 $ 0.92 $ 0.84 $ 0.77 $ 0.71 $ 0.65 $ 0.60
Present
value
-$
34.75
-$
2.17 $ 8.12 $ 8.03 $ 7.95 $ 7.86 $ 10.61
NPV $ 5.66
(Levin and Hallgren, 2017)
More to it, internal rate of return of the business is 12.94%. It defines about the level
where NPV of the business would be 0. On the basis of comparison of IRR with WACC of
the business, it has been found that cost of capital of the company is lower than internal rate
of return. Hence, the project is a good option for the investment purpose.
Calculation of internal rate of return
0 1 2 3 4 5 6
Year 0 Year 1 Year 2 Year 3 Year 4 Year 5 Year 6
$'million $'million $'million $'million $'million $'million $'million
Net cash
outflow
-$
34.75
-$
2.37 $ 9.65 $ 10.41 $ 11.22 $ 12.10 $ 17.80
NPV 12.94%
Finance for Managers
9
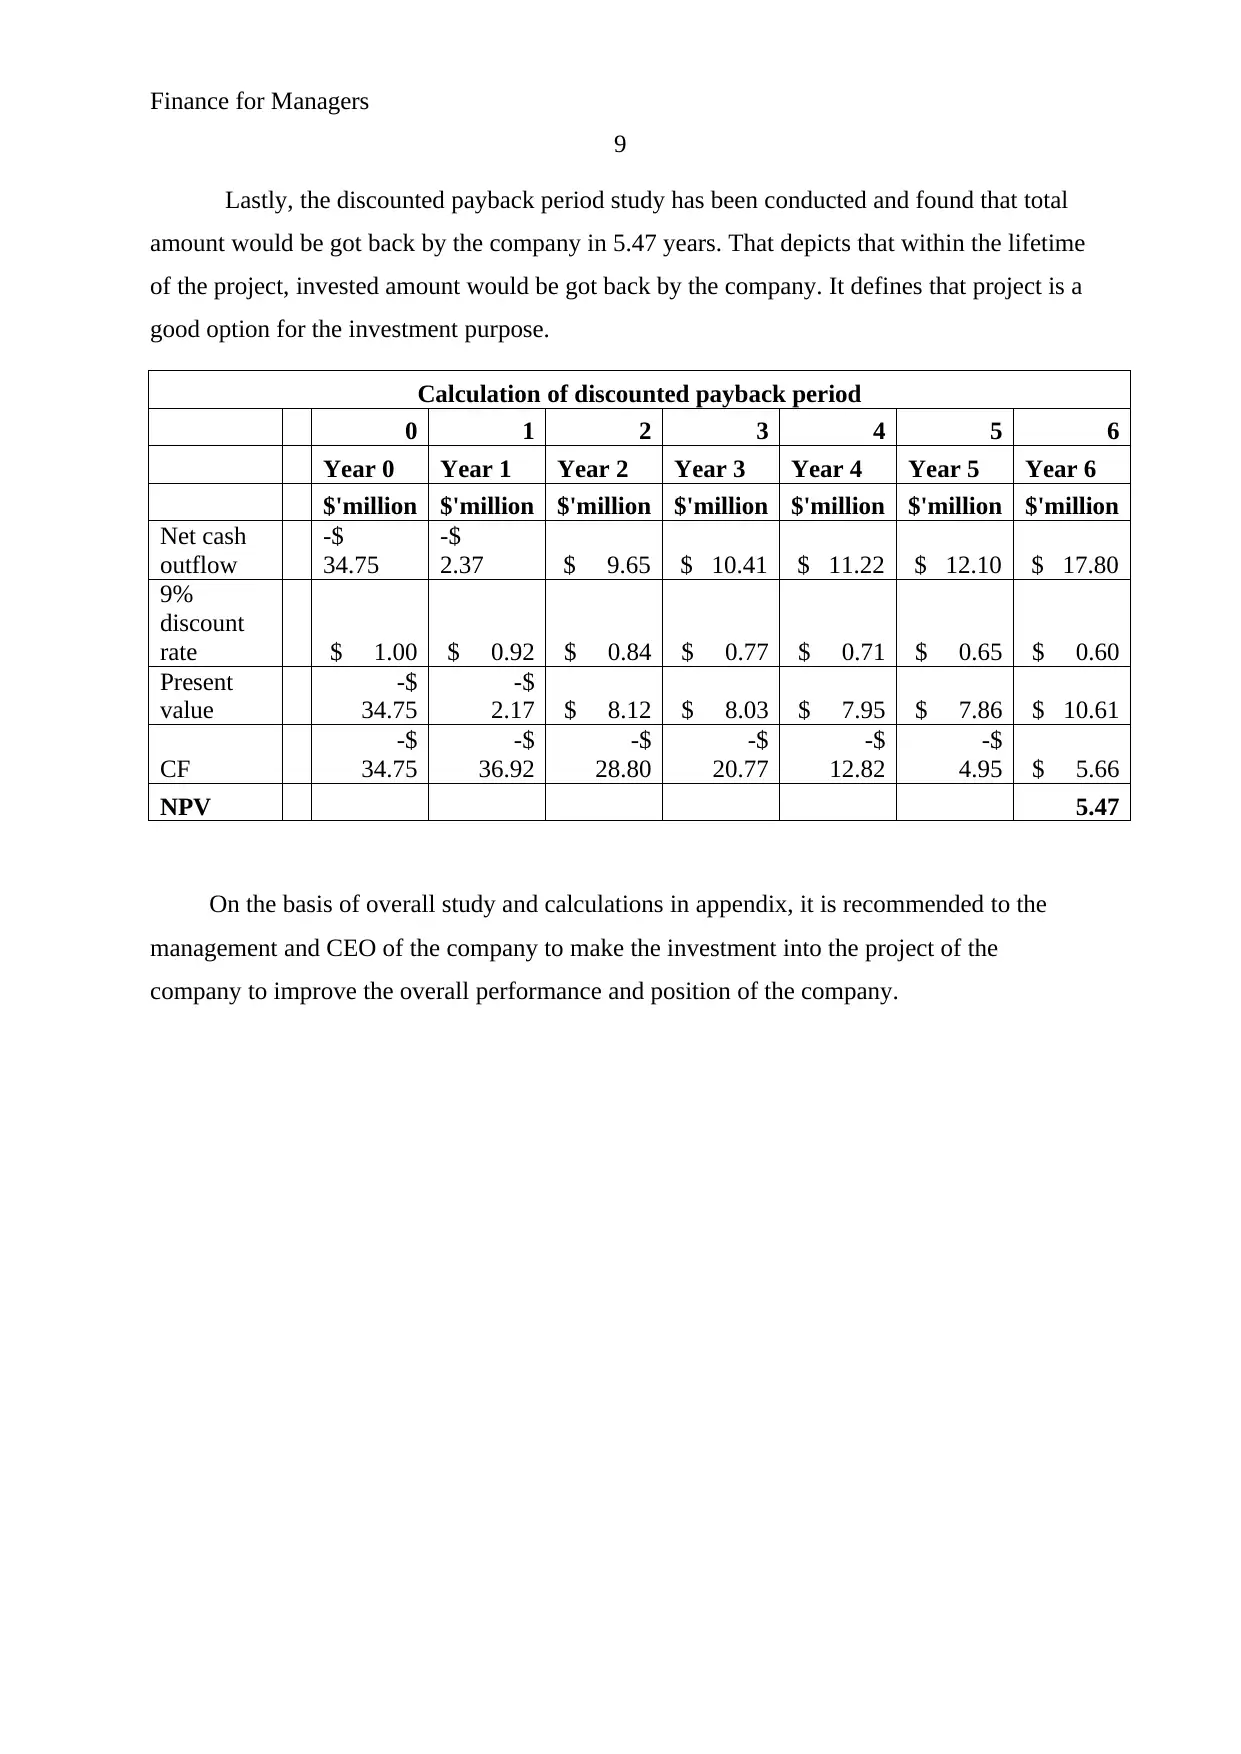
Lastly, the discounted payback period study has been conducted and found that total
amount would be got back by the company in 5.47 years. That depicts that within the lifetime
of the project, invested amount would be got back by the company. It defines that project is a
good option for the investment purpose.
Calculation of discounted payback period
0 1 2 3 4 5 6
Year 0 Year 1 Year 2 Year 3 Year 4 Year 5 Year 6
$'million $'million $'million $'million $'million $'million $'million
Net cash
outflow
-$
34.75
-$
2.37 $ 9.65 $ 10.41 $ 11.22 $ 12.10 $ 17.80
9%
discount
rate $ 1.00 $ 0.92 $ 0.84 $ 0.77 $ 0.71 $ 0.65 $ 0.60
Present
value
-$
34.75
-$
2.17 $ 8.12 $ 8.03 $ 7.95 $ 7.86 $ 10.61
CF
-$
34.75
-$
36.92
-$
28.80
-$
20.77
-$
12.82
-$
4.95 $ 5.66
NPV 5.47
On the basis of overall study and calculations in appendix, it is recommended to the
management and CEO of the company to make the investment into the project of the
company to improve the overall performance and position of the company.
9
Lastly, the discounted payback period study has been conducted and found that total
amount would be got back by the company in 5.47 years. That depicts that within the lifetime
of the project, invested amount would be got back by the company. It defines that project is a
good option for the investment purpose.
Calculation of discounted payback period
0 1 2 3 4 5 6
Year 0 Year 1 Year 2 Year 3 Year 4 Year 5 Year 6
$'million $'million $'million $'million $'million $'million $'million
Net cash
outflow
-$
34.75
-$
2.37 $ 9.65 $ 10.41 $ 11.22 $ 12.10 $ 17.80
9%
discount
rate $ 1.00 $ 0.92 $ 0.84 $ 0.77 $ 0.71 $ 0.65 $ 0.60
Present
value
-$
34.75
-$
2.17 $ 8.12 $ 8.03 $ 7.95 $ 7.86 $ 10.61
CF
-$
34.75
-$
36.92
-$
28.80
-$
20.77
-$
12.82
-$
4.95 $ 5.66
NPV 5.47
On the basis of overall study and calculations in appendix, it is recommended to the
management and CEO of the company to make the investment into the project of the
company to improve the overall performance and position of the company.
⊘ This is a preview!⊘
Do you want full access?
Subscribe today to unlock all pages.
Trusted by 1+ million students worldwide
Finance for Managers
10
References:
Annual Report. 2018. Boral Limited. [Online]. Available at:
https://www.boral.com/sites/corporate/files/media/field_document/Boral-Annual-Report-
2018.pdf [Retrieved on 5th June 2019].
ASX. 2019. Boral Limited. [Online]. Available at: https://www.asx.com.au/asx/share-price-
research/company/BLD [Accessed on 5th June 2019].
Home. 2019. Boral Limited. [Online]. Available at: https://www.boral.com.au/ [Accessed on
5th June 2019].
Kaplan, R.S. and Atkinson, A.A., 2015. Advanced management accounting. PHI Learning.
Levin, V. and Hallgren, A., 2017. The choice of capital budgeting techniques: a human
capital approach.
Madura, J. 2011. International financial management. Cengage Learning.
Miller, M. and Modigliani, F. 1961. Dividend policy, growth and the valuation of shares.
Chcago Journals, Vol 4.p.p. 411-433.
Morningstar. 2019. Boral Limited. [Online]. Available at:
http://financials.morningstar.com/balance-sheet/bs.html?t=BLD®ion=aus&culture=en-US
[Accessed on 5th June 2019].
Robb, A.M. and Robinson, D.T., 2014. The capital structure decisions of new firms. The
Review of Financial Studies, 27(1), pp.153-179.
Shivaani, M.V., Jain, P.K. and Yadav, S.S., 2017. Perceptual Mapping of Capital Budgeting
Techniques: Empirical Evidence from Corporate Enterprises in India. Research
Bulletin, 42(4), pp.106-112.
Soltani, S., Nayebzadeh, S. and Moeinaddin, M., 2014. The Impact Examination of the
Techniques of Management Accounting on the Performance of Tile Companies of
Yazd. International Journal of Academic Research in Accounting, Finance and Management
Sciences, 4(1), pp.382-389.
Yahoo finance. 2018. Boral Limited. [Online]. Available at:
https://finance.yahoo.com/quote/bld.ax?ltr=1 [Accessed on 5th June 2019].
Paraphrase This Document
Need a fresh take? Get an instant paraphrase of this document with our AI Paraphraser

Finance for Managers
11
11
Finance for Managers
12
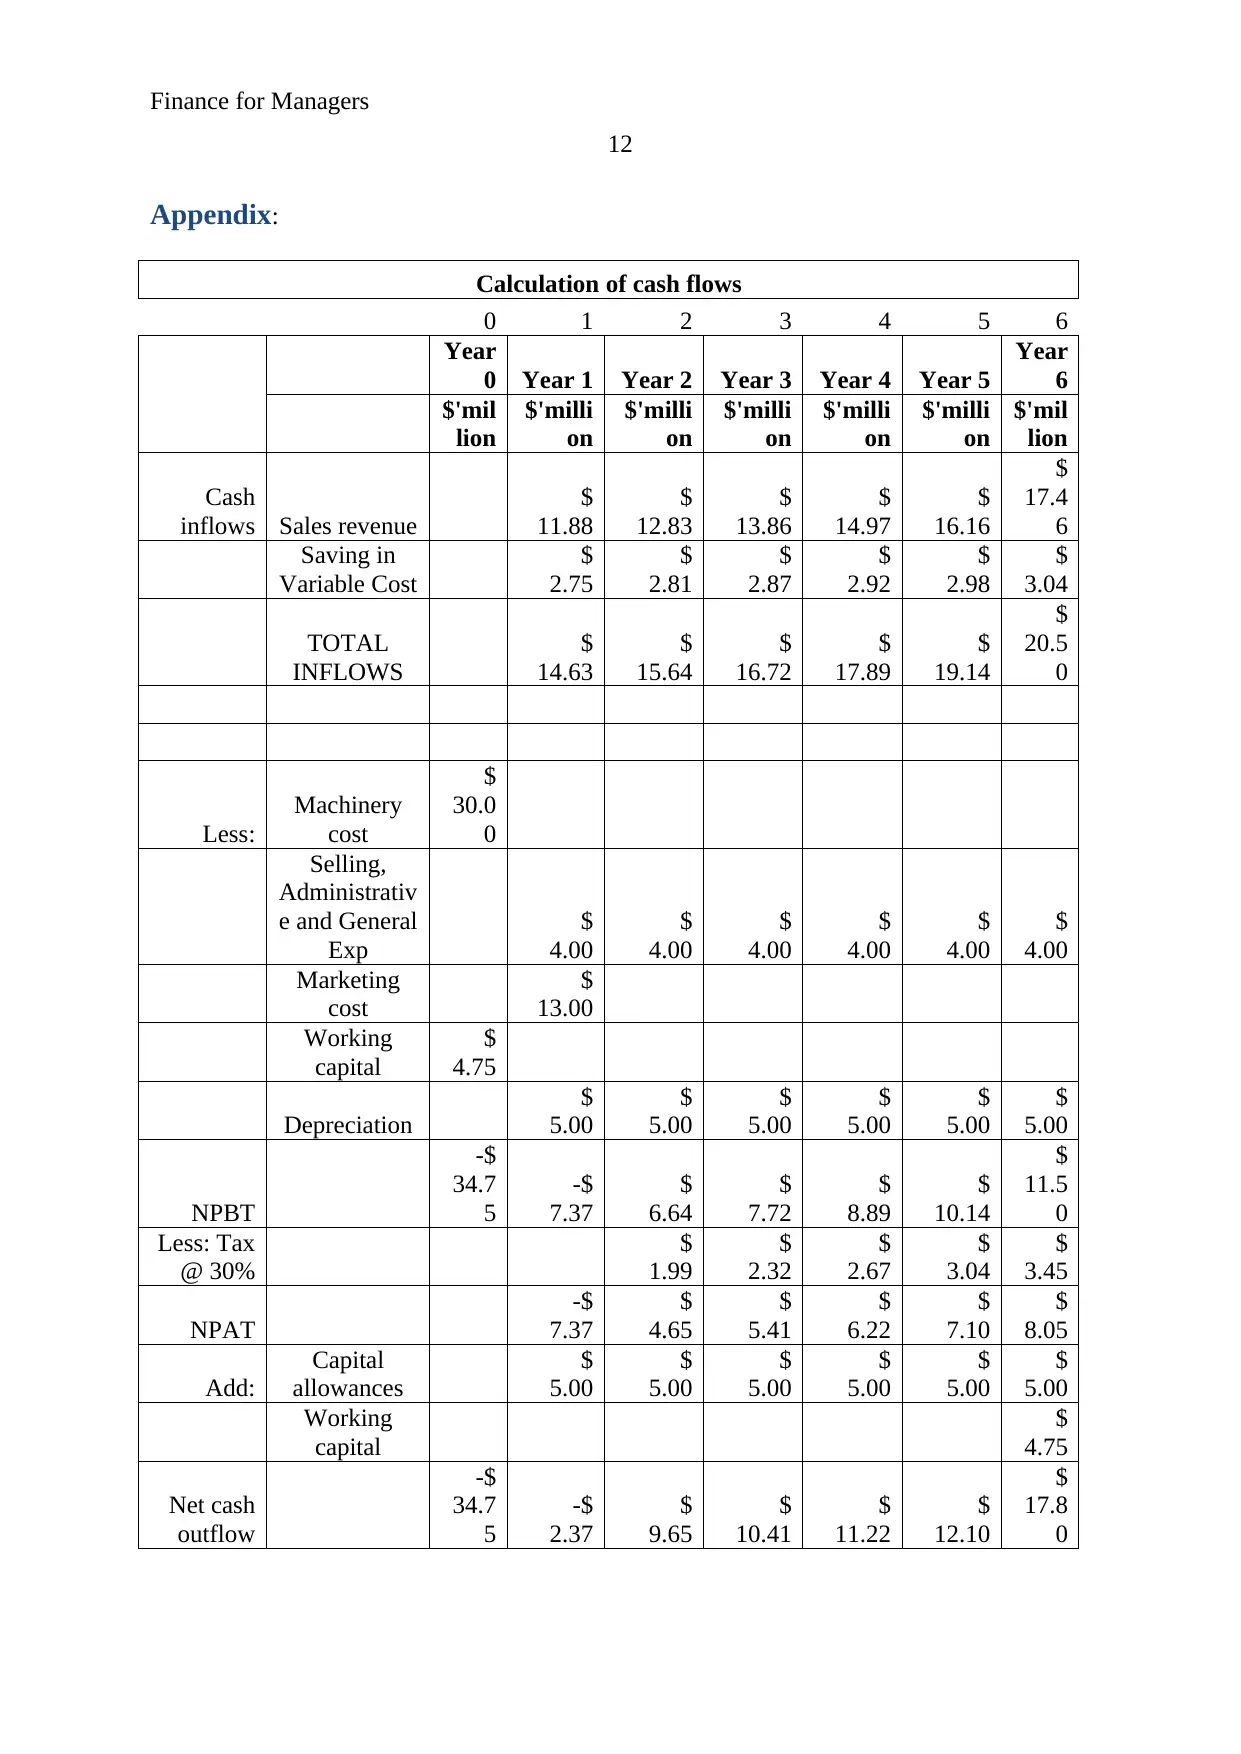
Appendix:
Calculation of cash flows
0 1 2 3 4 5 6
Year
0 Year 1 Year 2 Year 3 Year 4 Year 5
Year
6
$'mil
lion
$'milli
on
$'milli
on
$'milli
on
$'milli
on
$'milli
on
$'mil
lion
Cash
inflows Sales revenue
$
11.88
$
12.83
$
13.86
$
14.97
$
16.16
$
17.4
6
Saving in
Variable Cost
$
2.75
$
2.81
$
2.87
$
2.92
$
2.98
$
3.04
TOTAL
INFLOWS
$
14.63
$
15.64
$
16.72
$
17.89
$
19.14
$
20.5
0
Less:
Machinery
cost
$
30.0
0
Selling,
Administrativ
e and General
Exp
$
4.00
$
4.00
$
4.00
$
4.00
$
4.00
$
4.00
Marketing
cost
$
13.00
Working
capital
$
4.75
Depreciation
$
5.00
$
5.00
$
5.00
$
5.00
$
5.00
$
5.00
NPBT
-$
34.7
5
-$
7.37
$
6.64
$
7.72
$
8.89
$
10.14
$
11.5
0
Less: Tax
@ 30%
$
1.99
$
2.32
$
2.67
$
3.04
$
3.45
NPAT
-$
7.37
$
4.65
$
5.41
$
6.22
$
7.10
$
8.05
Add:
Capital
allowances
$
5.00
$
5.00
$
5.00
$
5.00
$
5.00
$
5.00
Working
capital
$
4.75
Net cash
outflow
-$
34.7
5
-$
2.37
$
9.65
$
10.41
$
11.22
$
12.10
$
17.8
0
12
Appendix:
Calculation of cash flows
0 1 2 3 4 5 6
Year
0 Year 1 Year 2 Year 3 Year 4 Year 5
Year
6
$'mil
lion
$'milli
on
$'milli
on
$'milli
on
$'milli
on
$'milli
on
$'mil
lion
Cash
inflows Sales revenue
$
11.88
$
12.83
$
13.86
$
14.97
$
16.16
$
17.4
6
Saving in
Variable Cost
$
2.75
$
2.81
$
2.87
$
2.92
$
2.98
$
3.04
TOTAL
INFLOWS
$
14.63
$
15.64
$
16.72
$
17.89
$
19.14
$
20.5
0
Less:
Machinery
cost
$
30.0
0
Selling,
Administrativ
e and General
Exp
$
4.00
$
4.00
$
4.00
$
4.00
$
4.00
$
4.00
Marketing
cost
$
13.00
Working
capital
$
4.75
Depreciation
$
5.00
$
5.00
$
5.00
$
5.00
$
5.00
$
5.00
NPBT
-$
34.7
5
-$
7.37
$
6.64
$
7.72
$
8.89
$
10.14
$
11.5
0
Less: Tax
@ 30%
$
1.99
$
2.32
$
2.67
$
3.04
$
3.45
NPAT
-$
7.37
$
4.65
$
5.41
$
6.22
$
7.10
$
8.05
Add:
Capital
allowances
$
5.00
$
5.00
$
5.00
$
5.00
$
5.00
$
5.00
Working
capital
$
4.75
Net cash
outflow
-$
34.7
5
-$
2.37
$
9.65
$
10.41
$
11.22
$
12.10
$
17.8
0
⊘ This is a preview!⊘
Do you want full access?
Subscribe today to unlock all pages.
Trusted by 1+ million students worldwide
1 out of 13
Related Documents


Your All-in-One AI-Powered Toolkit for Academic Success.
+13062052269
info@desklib.com
Available 24*7 on WhatsApp / Email
![[object Object]](/_next/static/media/star-bottom.7253800d.svg)
Unlock your academic potential
Copyright © 2020–2026 A2Z Services. All Rights Reserved. Developed and managed by ZUCOL.