MAN7MFI - Investment Analysis: Bovis Plc & Carillion Plc - UK Stock
VerifiedAdded on 2023/04/10
|25
|3442
|255
Report
AI Summary
This report provides an investment analysis of Bovis Plc and Carillion Plc, two UK construction firms, using financial ratios to inform portfolio restructuring decisions. The analysis includes current ratio, quick ratio, operating cash flow, net and gross profit margins, operating profit margin, working capital cycle, return on capital employed, return on total assets, debt to equity ratio, and return on equity. The report justifies the divestment decision based on these ratios, conducts a SWOT analysis, and examines the reasons for Carillion Plc's liquidation in 2018. Ultimately, the analysis suggests that Bovis Plc is a more suitable investment compared to Carillion Plc, indicating that Carillion Plc’s shares should be considered for divestment due to its relatively lower profitability and higher risk.
Running head: INVESTMENT ANALYSIS
INVESTMENT ANALYSIS
Name of the student:
Name of the university:
Author Note:
INVESTMENT ANALYSIS
Name of the student:
Name of the university:
Author Note:
Paraphrase This Document
Need a fresh take? Get an instant paraphrase of this document with our AI Paraphraser
INVESTMENT ANALYSIS 1
Executive Summary:
The project is about the investment analysis of the Bovis Plc. and Carillion Plc. through use
of financial ratios. In this assignment, deep appraisal has been made for the investing decision
that the investor will take into consideration for investment purpose. The assignment is
prepared to show the finding of financial performance analysis based on which portfolio
restructuring consisting of shares of both the company is made. The assignment is also
evaluated reasons for the collapse of the Carillion Plc., which was one of the major
liquidation in UK in the year 2018.
The finding of the collapse has been interpreted in such a way that it will help the strategy of
portfolio restructuring. The major collapse has singled major insights and failure of financial
statement to report financial distress.
INVESTMENT ANALYSIS 2
Table of Contents
1. Introduction:...........................................................................................................................4
2. Analysis of financial data for investment purpose:................................................................5
2.1 Current ratio:....................................................................................................................5
2.2 Quick Ratio:.....................................................................................................................6
2.3 Operating cash flow:........................................................................................................6
2.4 Net profit margin:.............................................................................................................6
2.5 Gross profit margin:.........................................................................................................6
2.6 Operating Profit Margin...................................................................................................7
2.7 Working Capital Cycle.....................................................................................................7
2.7 Return on Capital Employed............................................................................................8
2.8 Return on Total Assets.....................................................................................................8
2.9 Debt to equity ratio:.........................................................................................................8
2.11 Return on equity:............................................................................................................9
3. Justification of decision taken above:..................................................................................10
4. SWOT Analysis...............................................................................................................11
5. Liquidation of Carillion Plc. :..............................................................................................12
6. Conclusion:..........................................................................................................................13
7. References:...........................................................................................................................14
7. Appendix:.............................................................................................................................17
⊘ This is a preview!⊘
Do you want full access?
Subscribe today to unlock all pages.
Trusted by 1+ million students worldwide

INVESTMENT ANALYSIS 3
Paraphrase This Document
Need a fresh take? Get an instant paraphrase of this document with our AI Paraphraser
INVESTMENT ANALYSIS 4
1. Introduction:
The whole assignment is prepared to show the strategic portfolio management
consisting of shares of two companies namely Bovis Plc. and Carillion Plc. with the
calculation of ratios from the data derived from the financial statements of both the company.
Portfolio restructuring plays a vital role in mitigating risk and assuring optimal rate of return
to the portfolio. The portfolio restructuring involves continuous analysis of performance of
the company whether from financial point of view or market perception point of view. Both
the company namely Bovis Plc. and Carillion Plc. is engaged in the business of construction
and the person has acquired shares of both the company. The Bovis Plc. is the one of the
largest company of the United Kingdom whereas the Carillion Plc. is ranked 2nd in terms of
market share holding. Since, the investor has made investment in both the companies. Now
the investor is considering to divestment from one of the company. The divestment process
can be done with the deep analysis of key financial ratios such as Gross profit margin, Net
profit margin and Return on equity. (Brown, and Panibratov 2016.)
INVESTMENT ANALYSIS 5
2. Analysis of financial data for investment purpose:
The reliability of investment decision is the result of deep analysis of the financial
statement using different techniques such as ratio analysis, growth factors and dividend
policy adopted by the company. The more efficient the analysis is the more effective decision
can be made. These all factors are more dependent on the company performance and effected
by the relevant market forces, which leads investor to restructure their portfolio as to
maximize return (Acosta-González, Fernández-Rodríguez, and Ganga 2019). The decision to
choose any company for divestment purpose is mainly dependent on the ratios of the
company. The following ratios are the main indicator of financial health of the company
based on which portfolio restructuring decision can be made:
2.1 Current ratio:
It shows the capacity of the company to pay its debt obligation within a short span of
time i.e. within an accounting period. It is the major indicator of the debt paying capacity of
the company. Through use of current ratio, investor analyze whether the company has healthy
cash operating cycle or not. A low ratio indicates company’s inability to pay its short-term
debt obligation unless there is appropriate additional cash flow. A high ratio indicates that the
company has more cash & cash equivalent holdings but it fails to invest the same in
innovation and growth.
The current ratio of Bovis Plc. is 3.54 and Carillion Plc. is 0.82, which shows that the
Bovis Plc. has enough funds to pay its short-term obligations whereas the Carillion Plc. has
running short of fund. Based on current ratio, it is advisable to sell the shares of Carillion Plc.
(See Appendix)
⊘ This is a preview!⊘
Do you want full access?
Subscribe today to unlock all pages.
Trusted by 1+ million students worldwide
INVESTMENT ANALYSIS 6
2.2 Quick Ratio:
The quick ratio helps the company in understanding the ability of the company to pay
its immediate liabilities. It indicates the ability of the company to meet the short term
obligations by using the most liquid assets. The ideal quick ratio is 1:1 whereas the quick
ratio of Bovis Plc. and Carillion Plc. 0.28 and 0.79. This indicates that the quick ratio of
Carillion Plc. is better than Bovis Plc. and Carillion Plc. is better in handling short term
obligations.
2.3 Operating cash flow:
It shows that how the company is generating cash from its day-to-day activities. The
financial experts generally analyze operating cash flow to find whether the company is
paying its expenses through operating cash flows or it needs external financing to cope with
the expenses. The Bovis Plc. has operating cash flow of £ 61.80 million whereas Carillion
Plc. has operating cash flow of £ 73.30 million, which shows that the Carillion Plc. has
generated more operating cash flow as compared to the later. Therefore, based on above the
shares of the Bovis Plc. can be sold but decision cannot be based on above only.
2.4 Net profit margin:
It shows the capacity of the company to convert revenue into profit. A higher
percentage indicates that the company is more profitable and vice-versa. It is the major
indicator of the performance in terms of profitability to predict the growth perspective of the
company in long-term prospect. The Net profit margin of the Bovis Plc. is 14.67% whereas
the Carillion Plc. has 3.34%. So, Carillion Plc. is less profitable as compared to the Bovis Plc.
Based on above, the shares of Carillion Plc. can be sold.
Paraphrase This Document
Need a fresh take? Get an instant paraphrase of this document with our AI Paraphraser
INVESTMENT ANALYSIS 7
2.5 Gross profit margin:
It shows that how much profit the company has earned through sales before expenses.
It is not the true indicator of profitability of the company. Gross profit margin is generally
arrived by dividing gross profit by net sales of the company. Gross profit is the result of
deducting cost of goods sold from the sales revenue. So that the company is able to analyze
the ratio to formulate policies to widen, the gap between cost of goods sold and sales revenue
to the extent it is feasible to that. The higher percentage of gross profit margin indicates that
the company has sufficient amount to pay its overheads.
Through calculation of Gross profit margin of both the companies, the Bovis Plc. has
77.66% and Carillion Plc. has 92.02% of Gross profit margin. So, from both the ratio the
Carillion Plc. is seemed to be more profitable but the argument is not yet over because the net
margin of Bovis Plc. is greater as compared to the Carillion Plc. The reason of such change
might be increased salary expenses, high production cost, depreciation and higher debt
burden on the company. Standalone decision based on this will not provide, will not provide
expected outcome or will provide outcome that is not expected to have. (See appendix)
2.6 Operating Profit Margin
Operating profit margin is the performance ratio of an organization that measures
profit percentage that the company earns from its operations before the deduction of the taxes
and the interest payments. It is obtained by dividing the operating profit by total revenue. The
company can measure the efficiency of itself in managing the operating costs. The operating
profit margin of Bovis Plc. is better than Carillion Plc. It can be rather said that Bovis Plc. is
very efficient in managing the operating expenses as they are having the operating profit
margin of 15.17% whereas the operating profit margin of Carillion Plc. is 3.31%.
INVESTMENT ANALYSIS 8
2.7 Working Capital Cycle
The calculation shows that the accounts receivable turn days of Bovis Plc. is better
than Carillion Plc. that is 2 days against 120 days. The average payment period is 72 days for
Bovis Plc. whereas for Carillion Plc. is 180 days. This means in this regard also Bovis Plc. is
performing better. Therefore any investor would prefer Bovis Plc. than Carillion Plc.
2.7 Return on Capital Employed
It shows efficiency of the company to generate profits from its capital employed. It
shows how effectively Company’s asset is performing. From the calculations done for this
purpose, Bovis Plc. has ROCE of 13.77% and Carillion Plc. has ROCE of 9.34%. Therefore,
Bovis Plc. is generating more values from its assets in terms of EBIT. So, it is considered
better for further investment purpose as compared to Carillion Plc.
2.8 Return on Total Assets
It measure the earnings of the company before its tax and interest payments with respect to
the value of the total assets. It refers to the fact that how efficiently the company uses its
assets efficiently in order to earn the maximum revenue. The return on total assets of Bovis
Plc. is 10% whereas the return on the total assets of Carillion Plc. is 4%. This states that
Bovis Plc. is very much efficient in utilizing the assets that helps them in earning the
maximum revenue. So Bovis Plc. is at a better off position than Carillion Plc.
2.9 Debt to equity ratio:
The debt equity ratio of the company is calculated by the formula Total Liabilities /
Shareholder Equity. It helps in determining the financial leverage of the company. It helps in
the understanding of how the company is financing its operations by using its debts funds.
More precisely it helps in understanding the ability of the equity of the shareholder to cover
its outstanding debts. Higher debt equity ratios are associated with higher risks and lower
⊘ This is a preview!⊘
Do you want full access?
Subscribe today to unlock all pages.
Trusted by 1+ million students worldwide
INVESTMENT ANALYSIS 9
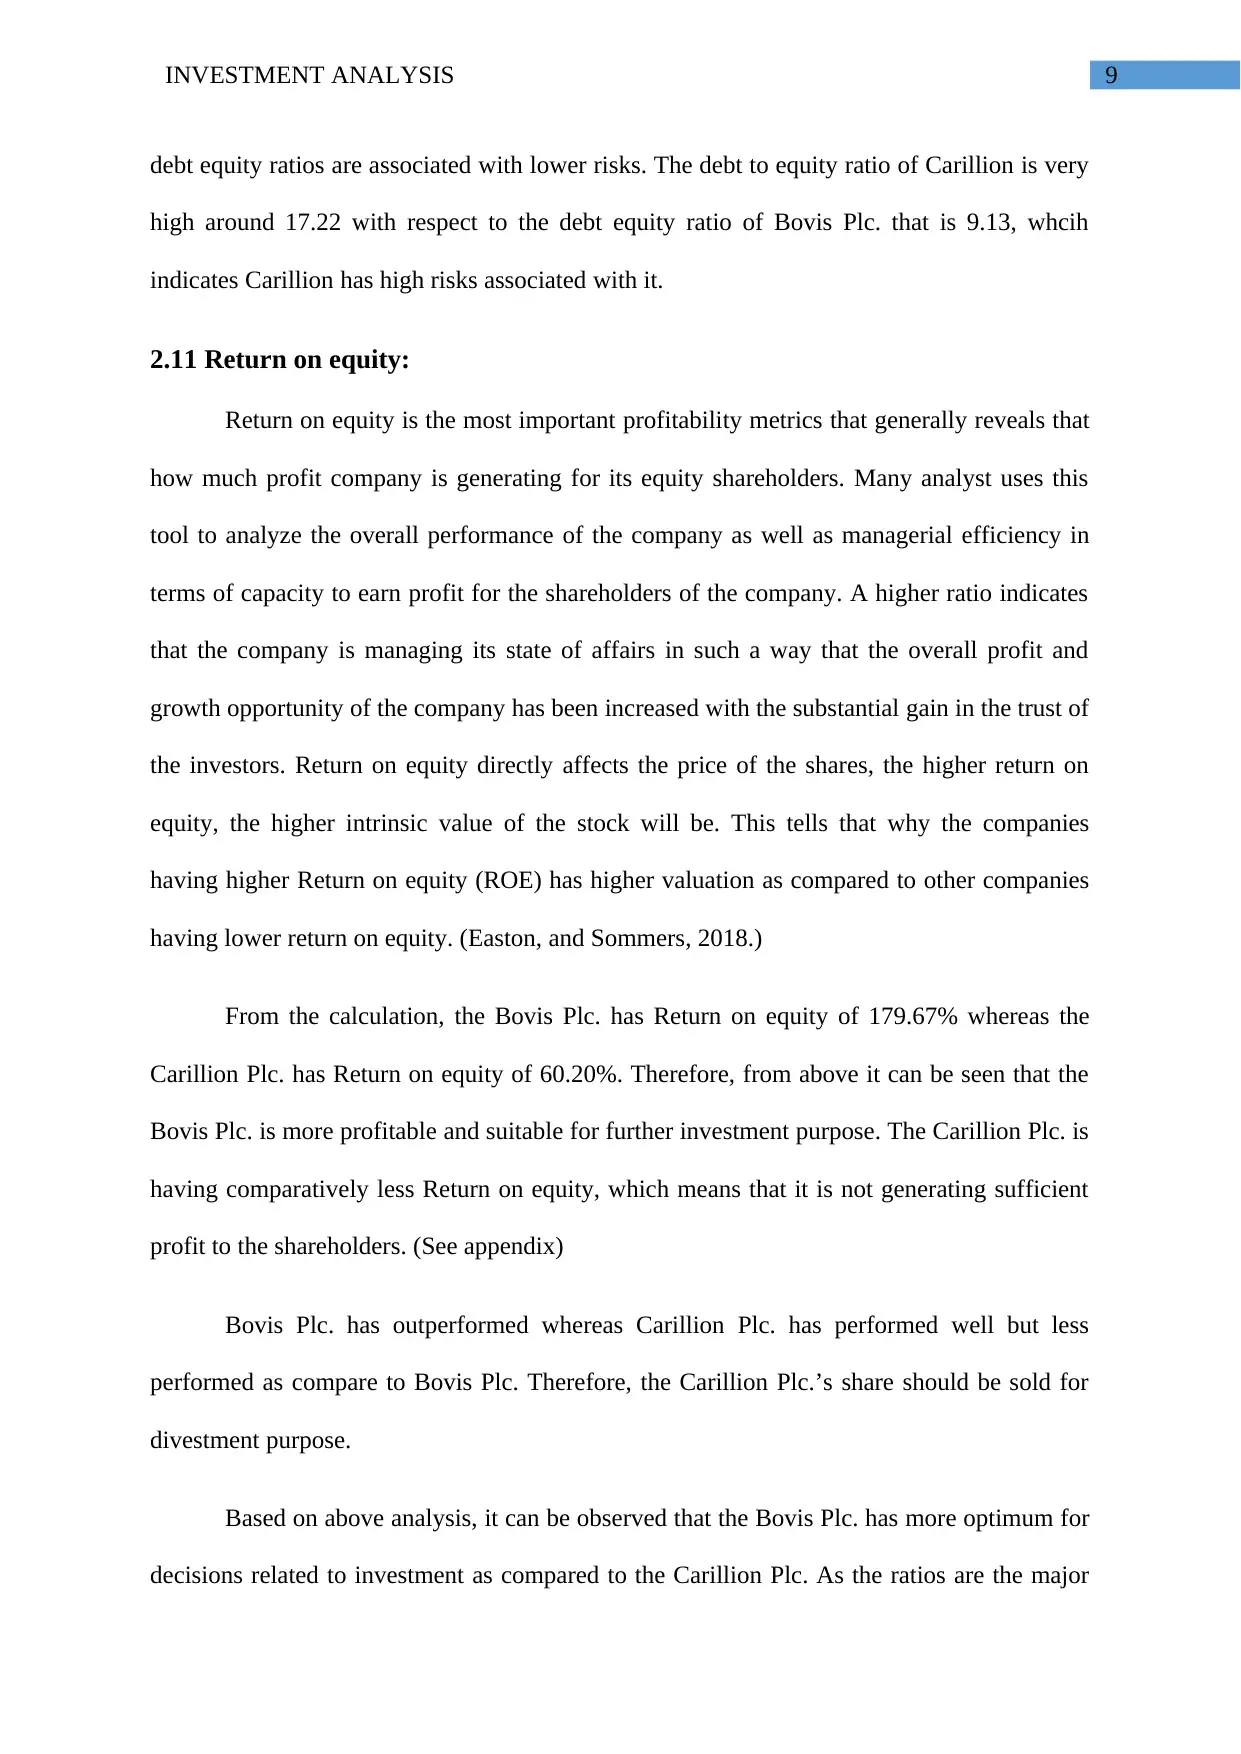
debt equity ratios are associated with lower risks. The debt to equity ratio of Carillion is very
high around 17.22 with respect to the debt equity ratio of Bovis Plc. that is 9.13, whcih
indicates Carillion has high risks associated with it.
2.11 Return on equity:
Return on equity is the most important profitability metrics that generally reveals that
how much profit company is generating for its equity shareholders. Many analyst uses this
tool to analyze the overall performance of the company as well as managerial efficiency in
terms of capacity to earn profit for the shareholders of the company. A higher ratio indicates
that the company is managing its state of affairs in such a way that the overall profit and
growth opportunity of the company has been increased with the substantial gain in the trust of
the investors. Return on equity directly affects the price of the shares, the higher return on
equity, the higher intrinsic value of the stock will be. This tells that why the companies
having higher Return on equity (ROE) has higher valuation as compared to other companies
having lower return on equity. (Easton, and Sommers, 2018.)
From the calculation, the Bovis Plc. has Return on equity of 179.67% whereas the
Carillion Plc. has Return on equity of 60.20%. Therefore, from above it can be seen that the
Bovis Plc. is more profitable and suitable for further investment purpose. The Carillion Plc. is
having comparatively less Return on equity, which means that it is not generating sufficient
profit to the shareholders. (See appendix)
Bovis Plc. has outperformed whereas Carillion Plc. has performed well but less
performed as compare to Bovis Plc. Therefore, the Carillion Plc.’s share should be sold for
divestment purpose.
Based on above analysis, it can be observed that the Bovis Plc. has more optimum for
decisions related to investment as compared to the Carillion Plc. As the ratios are the major
Paraphrase This Document
Need a fresh take? Get an instant paraphrase of this document with our AI Paraphraser
INVESTMENT ANALYSIS 10
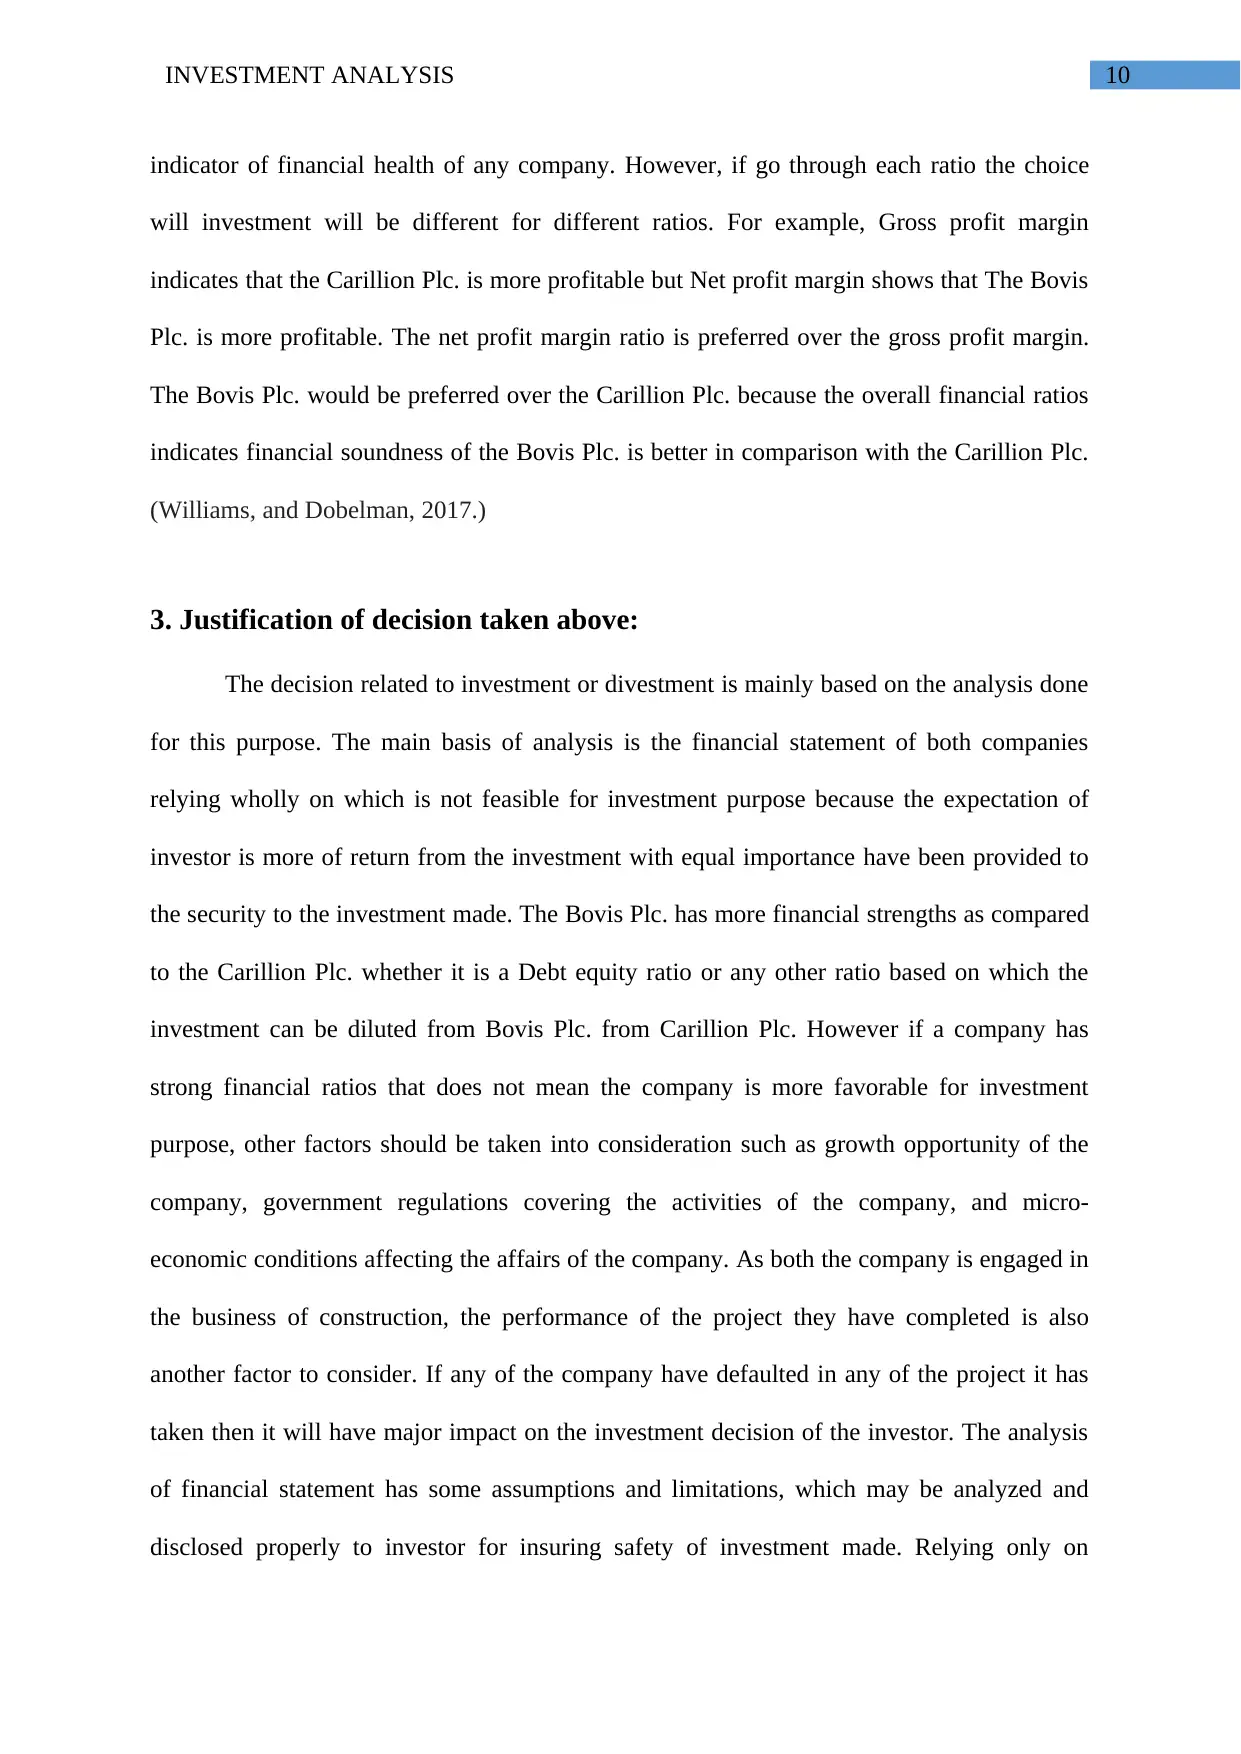
indicator of financial health of any company. However, if go through each ratio the choice
will investment will be different for different ratios. For example, Gross profit margin
indicates that the Carillion Plc. is more profitable but Net profit margin shows that The Bovis
Plc. is more profitable. The net profit margin ratio is preferred over the gross profit margin.
The Bovis Plc. would be preferred over the Carillion Plc. because the overall financial ratios
indicates financial soundness of the Bovis Plc. is better in comparison with the Carillion Plc.
(Williams, and Dobelman, 2017.)
3. Justification of decision taken above:
The decision related to investment or divestment is mainly based on the analysis done
for this purpose. The main basis of analysis is the financial statement of both companies
relying wholly on which is not feasible for investment purpose because the expectation of
investor is more of return from the investment with equal importance have been provided to
the security to the investment made. The Bovis Plc. has more financial strengths as compared
to the Carillion Plc. whether it is a Debt equity ratio or any other ratio based on which the
investment can be diluted from Bovis Plc. from Carillion Plc. However if a company has
strong financial ratios that does not mean the company is more favorable for investment
purpose, other factors should be taken into consideration such as growth opportunity of the
company, government regulations covering the activities of the company, and micro-
economic conditions affecting the affairs of the company. As both the company is engaged in
the business of construction, the performance of the project they have completed is also
another factor to consider. If any of the company have defaulted in any of the project it has
taken then it will have major impact on the investment decision of the investor. The analysis
of financial statement has some assumptions and limitations, which may be analyzed and
disclosed properly to investor for insuring safety of investment made. Relying only on
INVESTMENT ANALYSIS 11
investment will affect the overall investment and expected return from the investment. The
source of information and the data used in calculations are usually taken from the financial
statements of both the companies. (Brown, and Panibratov, 2016.)
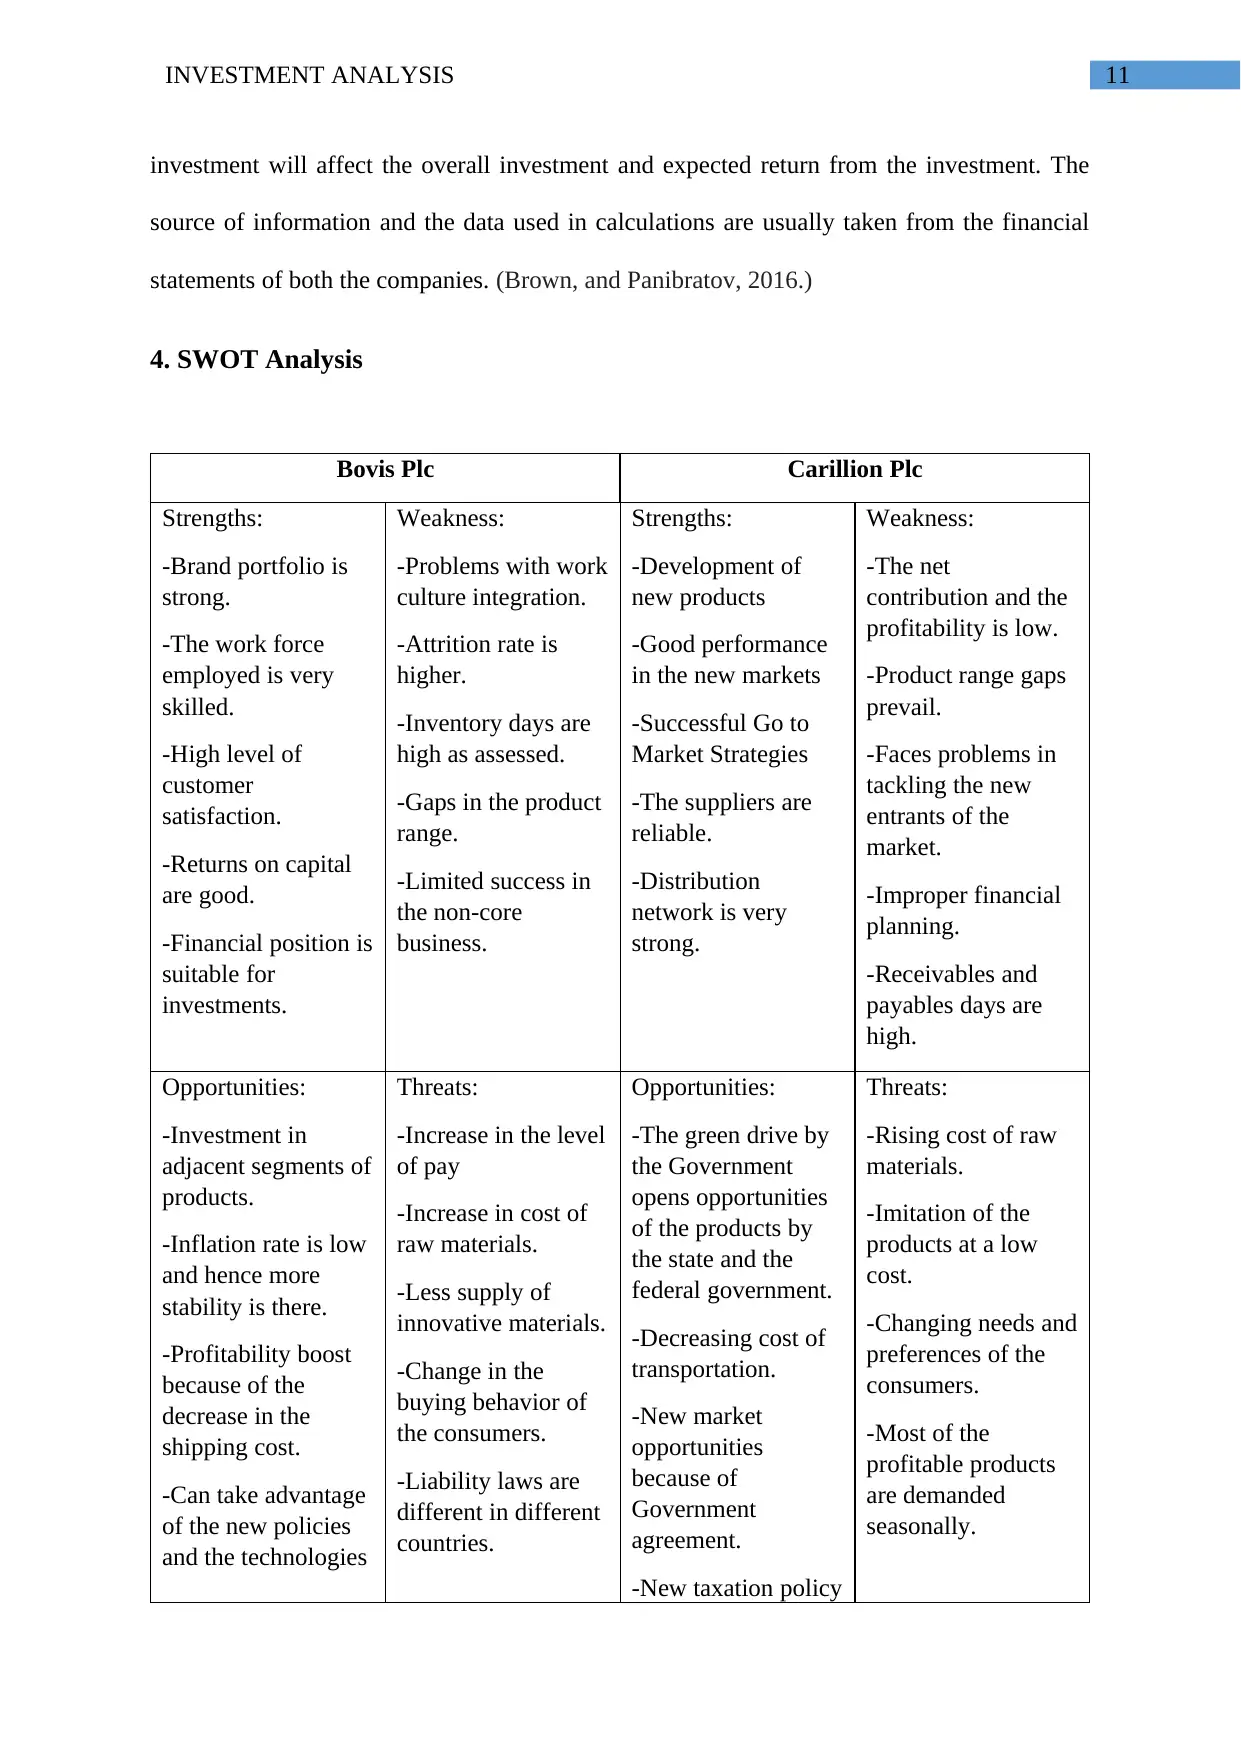
4. SWOT Analysis
Bovis Plc Carillion Plc
Strengths:
-Brand portfolio is
strong.
-The work force
employed is very
skilled.
-High level of
customer
satisfaction.
-Returns on capital
are good.
-Financial position is
suitable for
investments.
Weakness:
-Problems with work
culture integration.
-Attrition rate is
higher.
-Inventory days are
high as assessed.
-Gaps in the product
range.
-Limited success in
the non-core
business.
Strengths:
-Development of
new products
-Good performance
in the new markets
-Successful Go to
Market Strategies
-The suppliers are
reliable.
-Distribution
network is very
strong.
Weakness:
-The net
contribution and the
profitability is low.
-Product range gaps
prevail.
-Faces problems in
tackling the new
entrants of the
market.
-Improper financial
planning.
-Receivables and
payables days are
high.
Opportunities:
-Investment in
adjacent segments of
products.
-Inflation rate is low
and hence more
stability is there.
-Profitability boost
because of the
decrease in the
shipping cost.
-Can take advantage
of the new policies
and the technologies
Threats:
-Increase in the level
of pay
-Increase in cost of
raw materials.
-Less supply of
innovative materials.
-Change in the
buying behavior of
the consumers.
-Liability laws are
different in different
countries.
Opportunities:
-The green drive by
the Government
opens opportunities
of the products by
the state and the
federal government.
-Decreasing cost of
transportation.
-New market
opportunities
because of
Government
agreement.
-New taxation policy
Threats:
-Rising cost of raw
materials.
-Imitation of the
products at a low
cost.
-Changing needs and
preferences of the
consumers.
-Most of the
profitable products
are demanded
seasonally.
investment will affect the overall investment and expected return from the investment. The
source of information and the data used in calculations are usually taken from the financial
statements of both the companies. (Brown, and Panibratov, 2016.)
4. SWOT Analysis
Bovis Plc Carillion Plc
Strengths:
-Brand portfolio is
strong.
-The work force
employed is very
skilled.
-High level of
customer
satisfaction.
-Returns on capital
are good.
-Financial position is
suitable for
investments.
Weakness:
-Problems with work
culture integration.
-Attrition rate is
higher.
-Inventory days are
high as assessed.
-Gaps in the product
range.
-Limited success in
the non-core
business.
Strengths:
-Development of
new products
-Good performance
in the new markets
-Successful Go to
Market Strategies
-The suppliers are
reliable.
-Distribution
network is very
strong.
Weakness:
-The net
contribution and the
profitability is low.
-Product range gaps
prevail.
-Faces problems in
tackling the new
entrants of the
market.
-Improper financial
planning.
-Receivables and
payables days are
high.
Opportunities:
-Investment in
adjacent segments of
products.
-Inflation rate is low
and hence more
stability is there.
-Profitability boost
because of the
decrease in the
shipping cost.
-Can take advantage
of the new policies
and the technologies
Threats:
-Increase in the level
of pay
-Increase in cost of
raw materials.
-Less supply of
innovative materials.
-Change in the
buying behavior of
the consumers.
-Liability laws are
different in different
countries.
Opportunities:
-The green drive by
the Government
opens opportunities
of the products by
the state and the
federal government.
-Decreasing cost of
transportation.
-New market
opportunities
because of
Government
agreement.
-New taxation policy
Threats:
-Rising cost of raw
materials.
-Imitation of the
products at a low
cost.
-Changing needs and
preferences of the
consumers.
-Most of the
profitable products
are demanded
seasonally.
⊘ This is a preview!⊘
Do you want full access?
Subscribe today to unlock all pages.
Trusted by 1+ million students worldwide
1 out of 25
Related Documents


Your All-in-One AI-Powered Toolkit for Academic Success.
+13062052269
info@desklib.com
Available 24*7 on WhatsApp / Email
![[object Object]](/_next/static/media/star-bottom.7253800d.svg)
Unlock your academic potential
Copyright © 2020–2026 A2Z Services. All Rights Reserved. Developed and managed by ZUCOL.