Performance Analysis Report: BP and Caltex in the Oil Industry
VerifiedAdded on 2021/05/30
|12
|3249
|60
Report
AI Summary
This report provides a detailed analysis of the performance of BP and Caltex, two major players in the oil industry. It begins with an executive summary, followed by an overview of the oil industry, including its history, key players, and economic factors influencing their operations. The report then delves into the history and background of BP and Caltex individually, exploring their business models, operations, and market positions. A top-down analysis examines the broader economic context, including financial crises, interest rates, supply and demand dynamics, cost risks, and taxation. A bottom-up analysis evaluates the companies' financial performance using metrics such as liquidity, solvency, efficiency, and profitability. The report concludes with a summary of findings, recommendations, and a bibliography of cited sources.
Running Head: Performance Analysis
The Analysis on the Performance of BP and Caltex
By (Name)
(Tutor)
(University)
(Date)
The Analysis on the Performance of BP and Caltex
By (Name)
(Tutor)
(University)
(Date)
Paraphrase This Document
Need a fresh take? Get an instant paraphrase of this document with our AI Paraphraser
Performance Analysis 2
Executive Summary
The oil industry is the world’s largest industry in dollar value as its output is widely and variedly
used in households, institutions, basically every aspect of life. It has seen shifts in its operations
to deep-water drilling, introduction of drillship and a global network of tankers and pipelines.
The industry is mainly comprised of national corporations with few multinationals. In this paper
we look at BP plc. And Caltex their current performance. The industry is faced with many
factors which tend to one way or another influence their operations and performance (political,
social, economic). We however focus on the economic aspect in this case. They include interest
rates levels, supply and demand factor, costs, tax levels and the economic state (financial crisis).
This paper also looks at the financials of BP and Caltex companies to evaluate their performance.
For the financial year 2017 Caltex is seen to perform better than BP. Multinationals are advised
to conduct careful analysis when setting up operations abroad and to build sustainable
relationships with international oil and gas partners as they run the nationalization risk.
Performance Analysis 3
Table of Contents
Executive Summary.........................................................................................................................2
History.............................................................................................................................................5
BP Plc...........................................................................................................................................5
Caltex...........................................................................................................................................6
Top Down Analysis.........................................................................................................................7
Bottom up Analysis.........................................................................................................................8
Summary and Recommendations..................................................................................................11
Bibliography..................................................................................................................................12
⊘ This is a preview!⊘
Do you want full access?
Subscribe today to unlock all pages.
Trusted by 1+ million students worldwide
Performance Analysis 4
The Analysis on the Performance of BP and Caltex
Introduction
The oil industry entails the exploration, extraction, refining, transporting and marketing
of petroleum products. Fuel oil and petrol is the largest volume produced from the above
process. Over 80% of the world’s oil reserves are controlled by national oil companies. Of the
top 20 largest oil companies 15 are national companies i.e. are state owned. The seven largest
(super majors) international oil companies in order are; Exxon-Mobil, Royal Dutch Shell, BP/
Amoco, Total, Chevron and Conoco Phillips. These are publicly traded oil companies. 30 billion
barrels of oil industry products are consumed every year, making this industry the world’s largest
in dollar value. Of the total oil produced in 2007 the USA consumed 25%. (Anon, 2018).
The use of oil (unrefined) can be traced back to the early human history where it was
prominently used for fires and in warfare. Humans’ oil usage has evolved from the use of whale
oil for lighting in the 19th century and well into the 20th century, where greater industrialization
necessitated the use of coal and wood to complement whale oil as energy sources. The demand
for petroleum increased in the 20th century after it was discovered that kerosene could be
extracted from crude oil, (Halliday, 2018). The popularity of kerosene lamps led to the growth of
the oil refinery sector. Americans first oil refinery was established in 1853 by Samuel Kier. The
first oil tanker, Zoroaster, was commissioned in 1878 by Ludvig Nobel on Branobel Company
and plied the Caspian Sea. Up until the 1st quarter of the 10th century, Russia was, the leading oil
producer. It was however overtook by the USA. After WW2, the Middle East took the lead in oil
production from the USA. New techniques have been adopted in the oil industry ever since such
as deep water drilling, introduction of drill ships and a global network of tankers and pipelines.
However despite the necessity and importance of the oil industry it remains to be a source of
great environmental pollutant in all its stages leading to air pollution, acid rain, ailments etc.
Paraphrase This Document
Need a fresh take? Get an instant paraphrase of this document with our AI Paraphraser
Performance Analysis 5
History
BP Plc
“To find, develop and produce essential sources of energy and turn the sources into products
needed everywhere. We expect to be held to high standards in what we do. We strive to be a
safety leader in our country, a world class operator, a good corporate citizen, a great employer
we are BP” (Jurevicius, 2018).
VALUES; safety, respect, excellence, courage and one team.
Formerly known as British petroleum, is a multinational oil and gas company,
headquartered in London, England. It is one of the oil industry super majors. In 2012, BP was
ranked the 6th largest energy company by market capitalization and the 12th largest by revenue
turnover. It is a vertically integrated player in the oil industry, that is to say it engages in all
aspects that constitute the oil industry processes (exploration, extraction to marketing) including
petrochemicals and power generation. It offers varied products including petroleum natural gas,
motor fuels, aviation fuels and petrochemicals. Its operations extend to 72 countries and owns
about 18000 service stations. BPs largest division is BP America in the USA. Its Chairman is
Carl-Henric Svanberg and Bob Dudle is the Chief Executive Office.
BP was founded in 1908 in the name of the Anglo-Persian oil company which was a
subsidiary of Burmah Oil Company. In 1935 it was renamed the Anglo-Iranian oil company
which was a decision of new leadership. In 1951, the countries elected premier, Mossadegh
nationalized its holding shutting off an important pipeline. In 1954 the company rebranded to the
BP Company. In 1959, it expanded beyond the Middle East to Alaska where it was the first to
strike oil in the North Sea. In 1978 it acquired majority control of the Standard Oil of Ohio and
privatized it. In 1998, it merged with Amoco to become BP Amoco and acquired ARCO and
Burma Castrol and become BP plc. In 2001. (Tikkanen, 2017). In 2005, there was an explosion
in a BP, refinery killing 15 workers, in 2006 there was an oil spill of over 25000gallons leading
to a costly cleanup. Despite it’s beyond petroleum initiative it has scaled down its renewable
energy efforts. In 2012 it closed its solar energy unit.
Performance Analysis 6
Caltex
“Committed to delivering superb service and top quality products, we will rely on our
tradition of innovation to do more than satisfy customers. We intend to win their loyalty. Our
core beliefs of people, service and value are the foundation of a new Caltex-a service driven,
innovative marketer that consistently meets/ exceeds the expectations of its retail, industrial and
commercial customers this is the spirit by which we live, work and measure our performance”.
( Microsites.caltex.com.au,2018)
Caltex began in 1936 as the California Texas oil company which was a joint venture
between the Texas Company (later named Texaco) and standard oil of California (later named
chevron corporation). It aimed on developing overseas opportunities for oil refining and
marketing. Caltex suffered great losses with Japan’s invasion and confiscation of all Caltex
drilling equipment to fuel japans wartime world military. After WWII, Caltex drew resources
from chevron and Texaco to further its expansion agenda overseas where it adopted a local
hiring policy. In the 1950s Caltex, Nippon oil co and Koa oil co. and South Korean engineers
constructed the largest tanker and oil holding facilities in the world. Caltex furthered its joint
venture partnerships within Australia, New Zealand and Philippines.
In Australia, Caltex opened refineries in the 1950s and 1960s. It encountered fierce
competition from the all Australian oil importer, Ampol in the service station arena and oil
product marketing. Caltex acquired Golden Fleece. In 1995, Caltex and Ampol merged making it
the largest refiner and marketer of oil in Australia. (Companieshistory.com, 2018).
Caltex is a vertically integrated company, that is to say it is involved in exploration,
extraction, refining, transporting and marketing of petroleum products. Its supply chain involves
the use of pipelines, depots, terminals and fleets. Its marketing arm entails operation of service
stations, convenience stores (Caltex, Woolworths, and starmart), retail fuels, automotive
products (ATFs, grease and engine oils), groceries, fast foods, automotive services as well as car
wash. They offer online account management where clients can through their website access
information as regards the company, its products and services. More than 85% of its employees
are nationals of countries within which it operates. It has major presence in East Africa, East
Asia, China, Middle East, South East Asia, and South Pacific and is the only international
petroleum firm that operates in all major Asian markets.
⊘ This is a preview!⊘
Do you want full access?
Subscribe today to unlock all pages.
Trusted by 1+ million students worldwide
Performance Analysis 7
Top Down Analysis
The Australian economy is stable and people and business are optimistic as revealed by
the confidence index (8) given by the national Australian bank. Interest rates have remained low
since august 2016 and is currently 1.5% the inflation rate is 1.9% (lower than the projected 2-
3%) and is especially favorable to the non-mining business expansion. Consumer spending levels
are higher (financed by rising debt levels rather than income growth) (Riley, 2018). Inflation
remains steady. Australia is the 2nd wealthiest nation (wealth per adult) and ranks as the 13th
nation in terms of nominal GDP. (The Guardian, 2018). There are several factors as discussed
below that greatly affect this industry.
Financial crisis
In times of financial crisis, there normally follows a steep decline in the prices of goods
and services. The lower prices mean lower revenues for the industry. Also it follows that the
credit conditions are tighter forcing the players (who are usually highly leveraged) to pay higher
interest rates in raising capital, curtailing their investments in production and consequently
lowering their revenues which are already low owing to the lower prices fetched by their
products in the market (Tonby, 2009).
Interest rates
Most oil and gas industry players are heavily leveraged thus subject to interest rates. High
interest rates makes borrowing for investment very expensive as it raises the capital costs of
producers (Arora, 2011). As a result only a few engage in the production, leading to lower
production and obeying the law of demand where the quantity demanded and price are inversely
related thus consumers are required to pay higher prices. The higher interest rates on the
production end serves to raise operating costs of the companies thus lowering their revenues (as
they have to pay out higher interests on their debts) in the case that price does not rise to mitigate
the higher rates by raising the revenues. Interest rates also influence exchange rates, (Kim and
Jung, 2018)
Supply and Demand Risks
Paraphrase This Document
Need a fresh take? Get an instant paraphrase of this document with our AI Paraphraser
Performance Analysis 8
The nature of the oil industry is coupled with inflexibility such that you cannot easily
lower production or raise it as per market needs in the short term. Operations take a lot of time
and capital to get going and are not easy to shut down when with extended periods of high oil
prices consumers seek fuel efficient vehicles, reduce driving, businesses and individuals get into
energy conservation thus reduced demand for oil industry products.
Cost Risks.
These are basically operational costs. The more the regulations a company faces the
greater the costs for the company which eat deeper into their revenues (Guimaraes, 2012). The
ease of the drill determines the cost of the project. If it is difficult drilling gets costly lowering
net revenues. Payroll cost is yet another key cost. Companies will want to hold on to their key
expert employees even in low production periods who they will still pay even with reduced
production capacity even if their role is significantly reduced as at that time.
Tax
Taxes act to reduce the revenues. Higher taxes or lower tax subsidies for the oil industry
translates to higher production costs for the players. This in turn serves to lower the revenue for
the players as the higher costs eat into their earnings. High taxes on petroleum products may
reduce output which may in turn lead to higher prices. However, most nations give tax subsidies/
incentives to encourage production as it is the most common source of energy (Mark and Cussen,
2018). For instance, in the US the tax rate of the oil industry is 9% while companies in other
industries pay 25%.
Bottom up Analysis
There are various measures used in evaluating the performance of a company. They include
liquidity, solvency, efficiency and profitability.
Liquidity ratio - these show a company’s ability to meet its short term needs. Liquidity refers to
the amount of cash and easily convertible to cash assets a company has. A ratio greater than one
is an indicator of flexibility and is thus preferable
Current ratio = current assets/ current liabilities
Performance Analysis 9
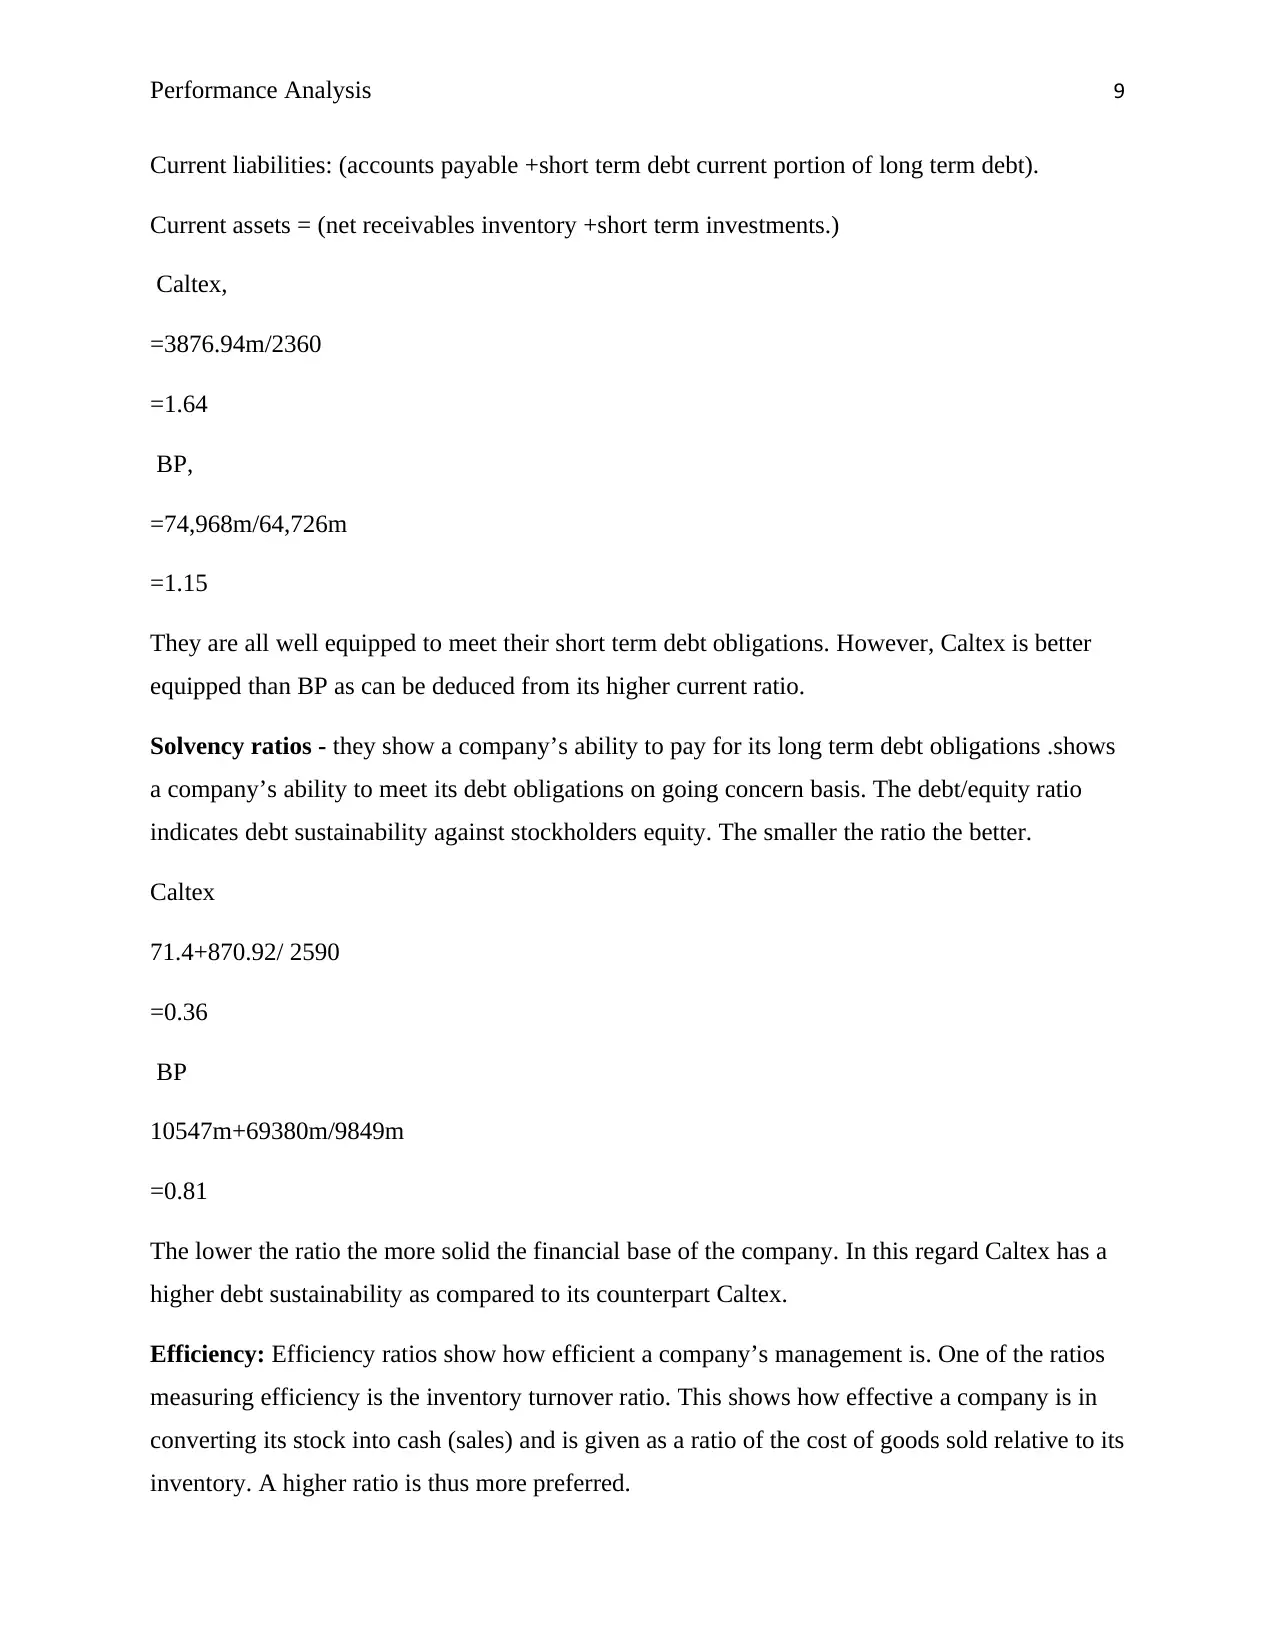
Current liabilities: (accounts payable +short term debt current portion of long term debt).
Current assets = (net receivables inventory +short term investments.)
Caltex,
=3876.94m/2360
=1.64
BP,
=74,968m/64,726m
=1.15
They are all well equipped to meet their short term debt obligations. However, Caltex is better
equipped than BP as can be deduced from its higher current ratio.
Solvency ratios - they show a company’s ability to pay for its long term debt obligations .shows
a company’s ability to meet its debt obligations on going concern basis. The debt/equity ratio
indicates debt sustainability against stockholders equity. The smaller the ratio the better.
Caltex
71.4+870.92/ 2590
=0.36
BP
10547m+69380m/9849m
=0.81
The lower the ratio the more solid the financial base of the company. In this regard Caltex has a
higher debt sustainability as compared to its counterpart Caltex.
Efficiency: Efficiency ratios show how efficient a company’s management is. One of the ratios
measuring efficiency is the inventory turnover ratio. This shows how effective a company is in
converting its stock into cash (sales) and is given as a ratio of the cost of goods sold relative to its
inventory. A higher ratio is thus more preferred.
⊘ This is a preview!⊘
Do you want full access?
Subscribe today to unlock all pages.
Trusted by 1+ million students worldwide
Performance Analysis 10
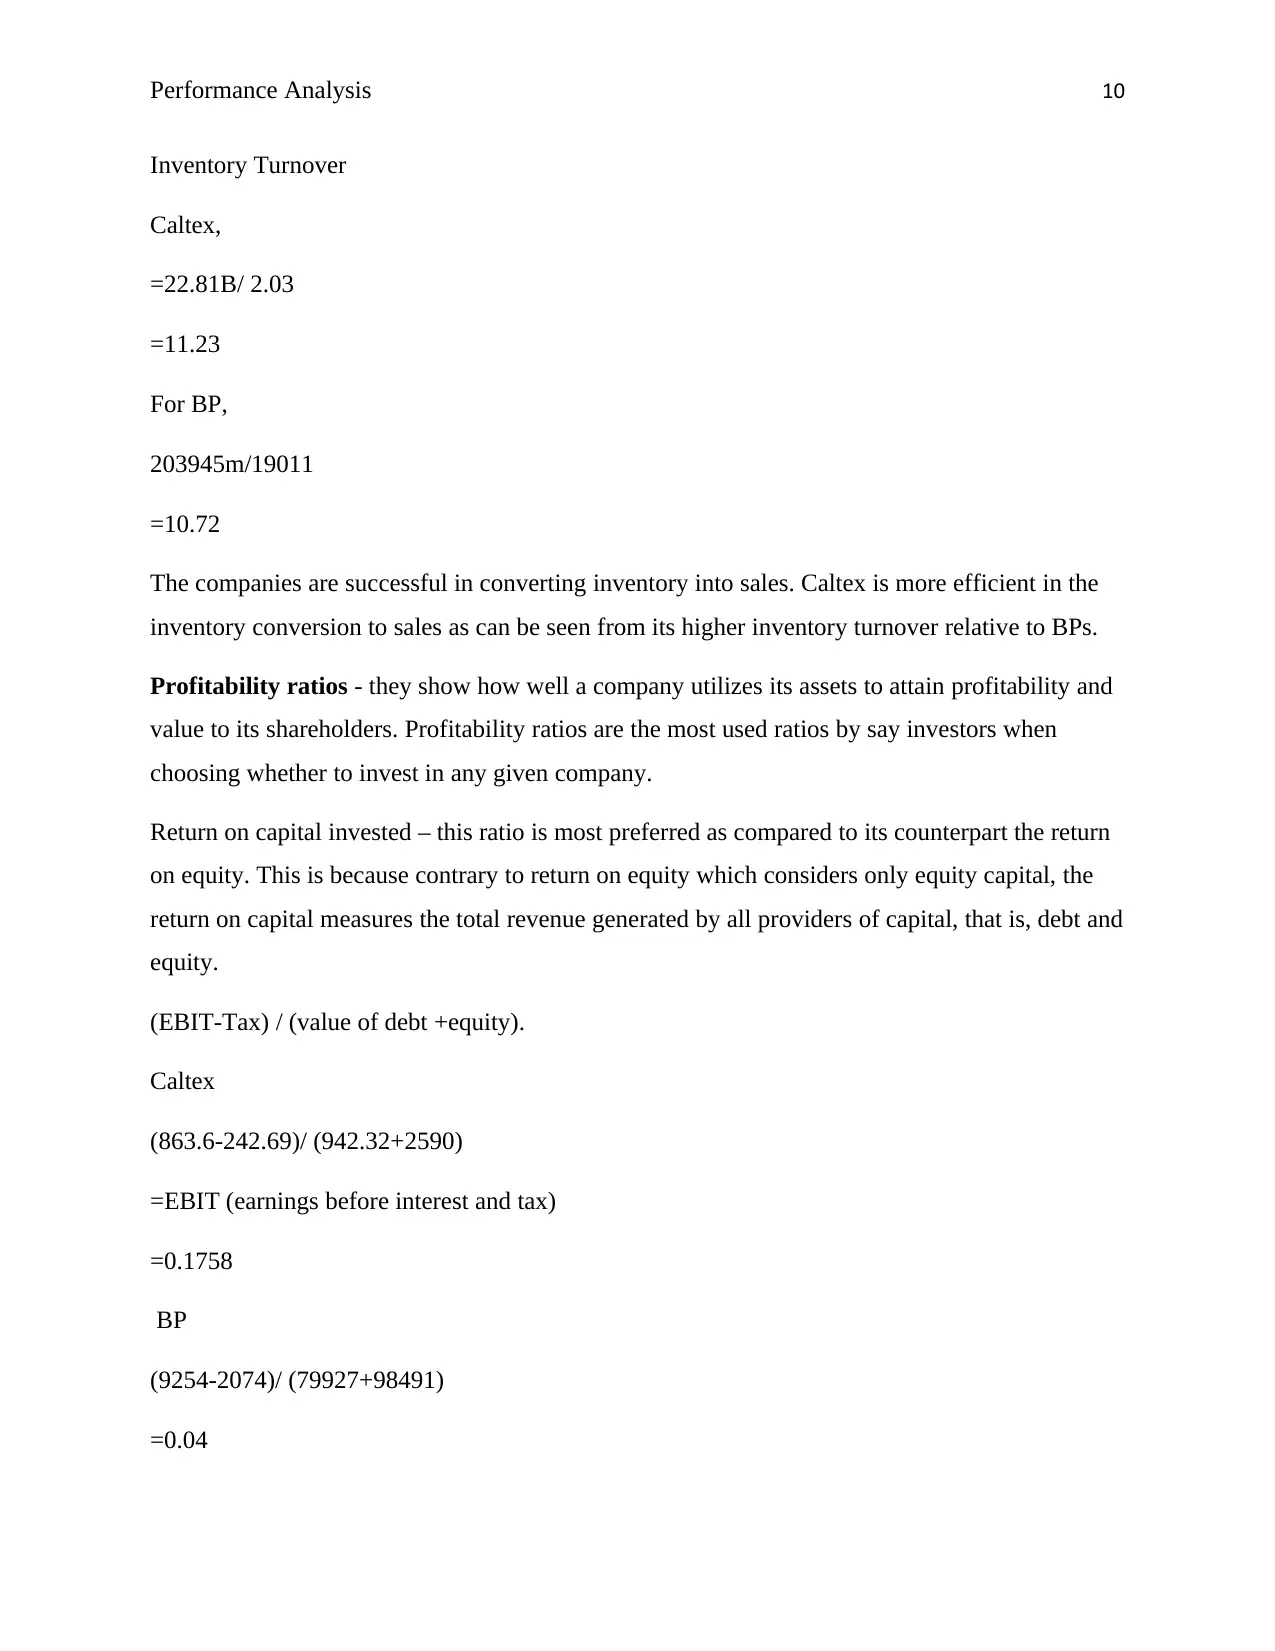
Inventory Turnover
Caltex,
=22.81B/ 2.03
=11.23
For BP,
203945m/19011
=10.72
The companies are successful in converting inventory into sales. Caltex is more efficient in the
inventory conversion to sales as can be seen from its higher inventory turnover relative to BPs.
Profitability ratios - they show how well a company utilizes its assets to attain profitability and
value to its shareholders. Profitability ratios are the most used ratios by say investors when
choosing whether to invest in any given company.
Return on capital invested – this ratio is most preferred as compared to its counterpart the return
on equity. This is because contrary to return on equity which considers only equity capital, the
return on capital measures the total revenue generated by all providers of capital, that is, debt and
equity.
(EBIT-Tax) / (value of debt +equity).
Caltex
(863.6-242.69)/ (942.32+2590)
=EBIT (earnings before interest and tax)
=0.1758
BP
(9254-2074)/ (79927+98491)
=0.04
Paraphrase This Document
Need a fresh take? Get an instant paraphrase of this document with our AI Paraphraser
Performance Analysis 11
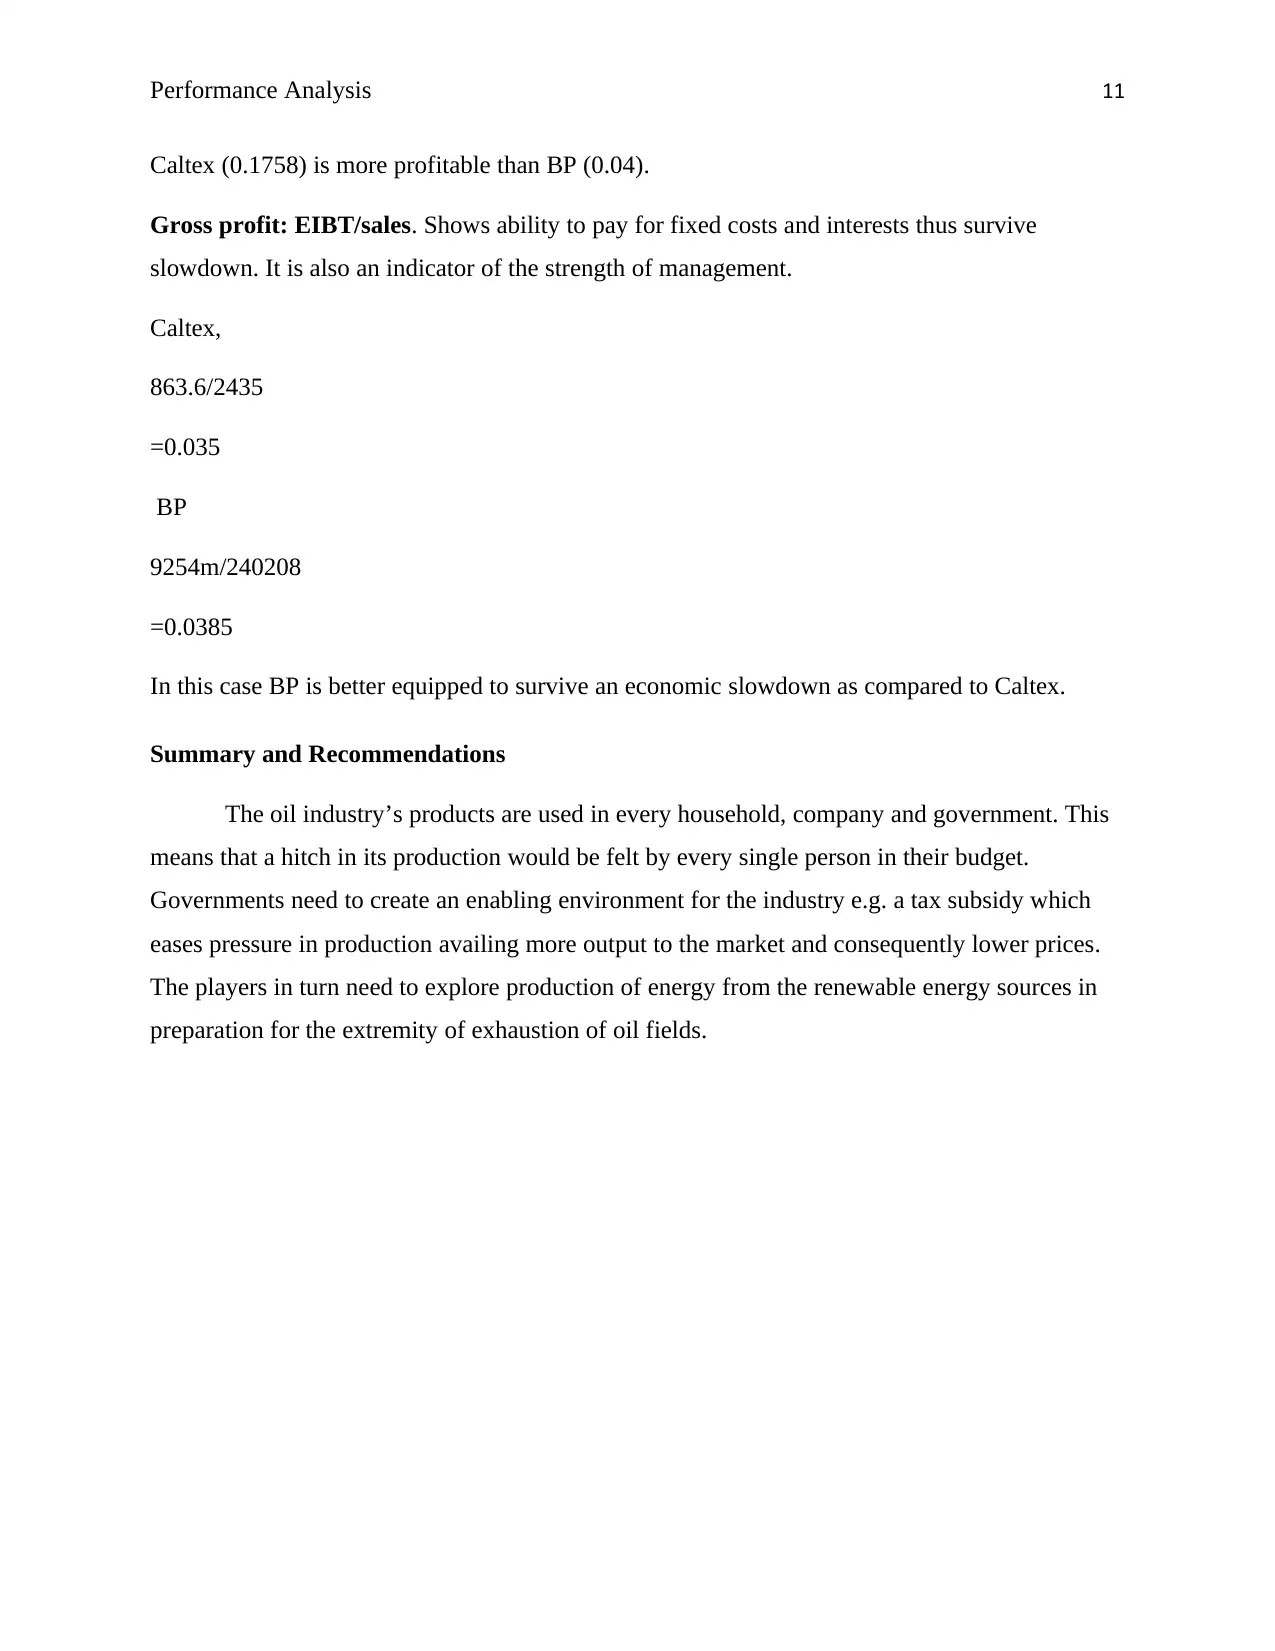
Caltex (0.1758) is more profitable than BP (0.04).
Gross profit: EIBT/sales. Shows ability to pay for fixed costs and interests thus survive
slowdown. It is also an indicator of the strength of management.
Caltex,
863.6/2435
=0.035
BP
9254m/240208
=0.0385
In this case BP is better equipped to survive an economic slowdown as compared to Caltex.
Summary and Recommendations
The oil industry’s products are used in every household, company and government. This
means that a hitch in its production would be felt by every single person in their budget.
Governments need to create an enabling environment for the industry e.g. a tax subsidy which
eases pressure in production availing more output to the market and consequently lower prices.
The players in turn need to explore production of energy from the renewable energy sources in
preparation for the extremity of exhaustion of oil fields.
Performance Analysis 12
Bibliography
Anon, (2018). [Online] Available at: Https://www.ciagovernmentlibrarypublications/the-world-
factbook [Accessed 20 May 2018].
Arora, V. (2011). Asset Value, Interest Rates and Oil Price Volatility. Economic Record, 87,
pp.45-55.
Companieshistory.com. (2018). Caltex Australia. [Online] Available at:
http://www.companieshistory.com/caltex-australia/ [Accessed 20 May 2018].
Guimaraes, M. (2012). Evaluation of Political and Regulatory Risks in the Oil Industry. The
Open Business Journal, 5(1), pp.28-36.
Halliday, F. (2018). The M.E in international relations. USA: Cambridge university press, p.270.
Jurevicius (2018). BP mission statement. [Online] Slideshare.net. Available at:
https://www.slideshare.net/sovjure/bp-mission-statement [Accessed 20 May 2018].
Kim, J. and Jung, H. (2018). Dependence Structure between Oil Prices, Exchange Rates, and
Interest Rates. The Energy Journal, 39(2).
Mark, P. and Cussen, A. (2018). Oil: A big investment with big tax breaks. [Online]
Investopedia. Available at: https://www.investopedia.com/articles/07/oil-tax-break.asp
[Accessed 25 May 2018].
Microsites.caltex.com.au. (2018). Caltex 2017 Annual Report. [Online] Available at:
http://microsites.caltex.com.au/annualreports/2017/ [Accessed 20 May 2018].
Reid, C. (2011). World Economic Factbook 2010 (17th Ed.) 2011118Euromonitor International.
World Economic Factbook 2010 (17th Ed.) London. Reference Reviews, 25(3), pp.26-26.
Riley. (2018). Inflation - Consequences of Inflation [Online] Available at:
https://www.tutor2u.net/economics/reference/inflation-consequences-of-inflation [Accessed 24
May 2018].
Tikkanen, A. (2017). BP PLC. [Online] Britannica.com. Available at:
https://www.britannica.com/topic/BP-PLC [Accessed 20 May 2018].
Tonby, O. (2009). Global financial crisis—implications for Australia's oil and gas industry. The
APPEA Journal, 49(3).
⊘ This is a preview!⊘
Do you want full access?
Subscribe today to unlock all pages.
Trusted by 1+ million students worldwide
1 out of 12
Related Documents


Your All-in-One AI-Powered Toolkit for Academic Success.
+13062052269
info@desklib.com
Available 24*7 on WhatsApp / Email
![[object Object]](/_next/static/media/star-bottom.7253800d.svg)
Unlock your academic potential
Copyright © 2020–2026 A2Z Services. All Rights Reserved. Developed and managed by ZUCOL.