University Canada West: Regression Analysis of BP Share Data
VerifiedAdded on 2022/12/30
|10
|1390
|82
Report
AI Summary
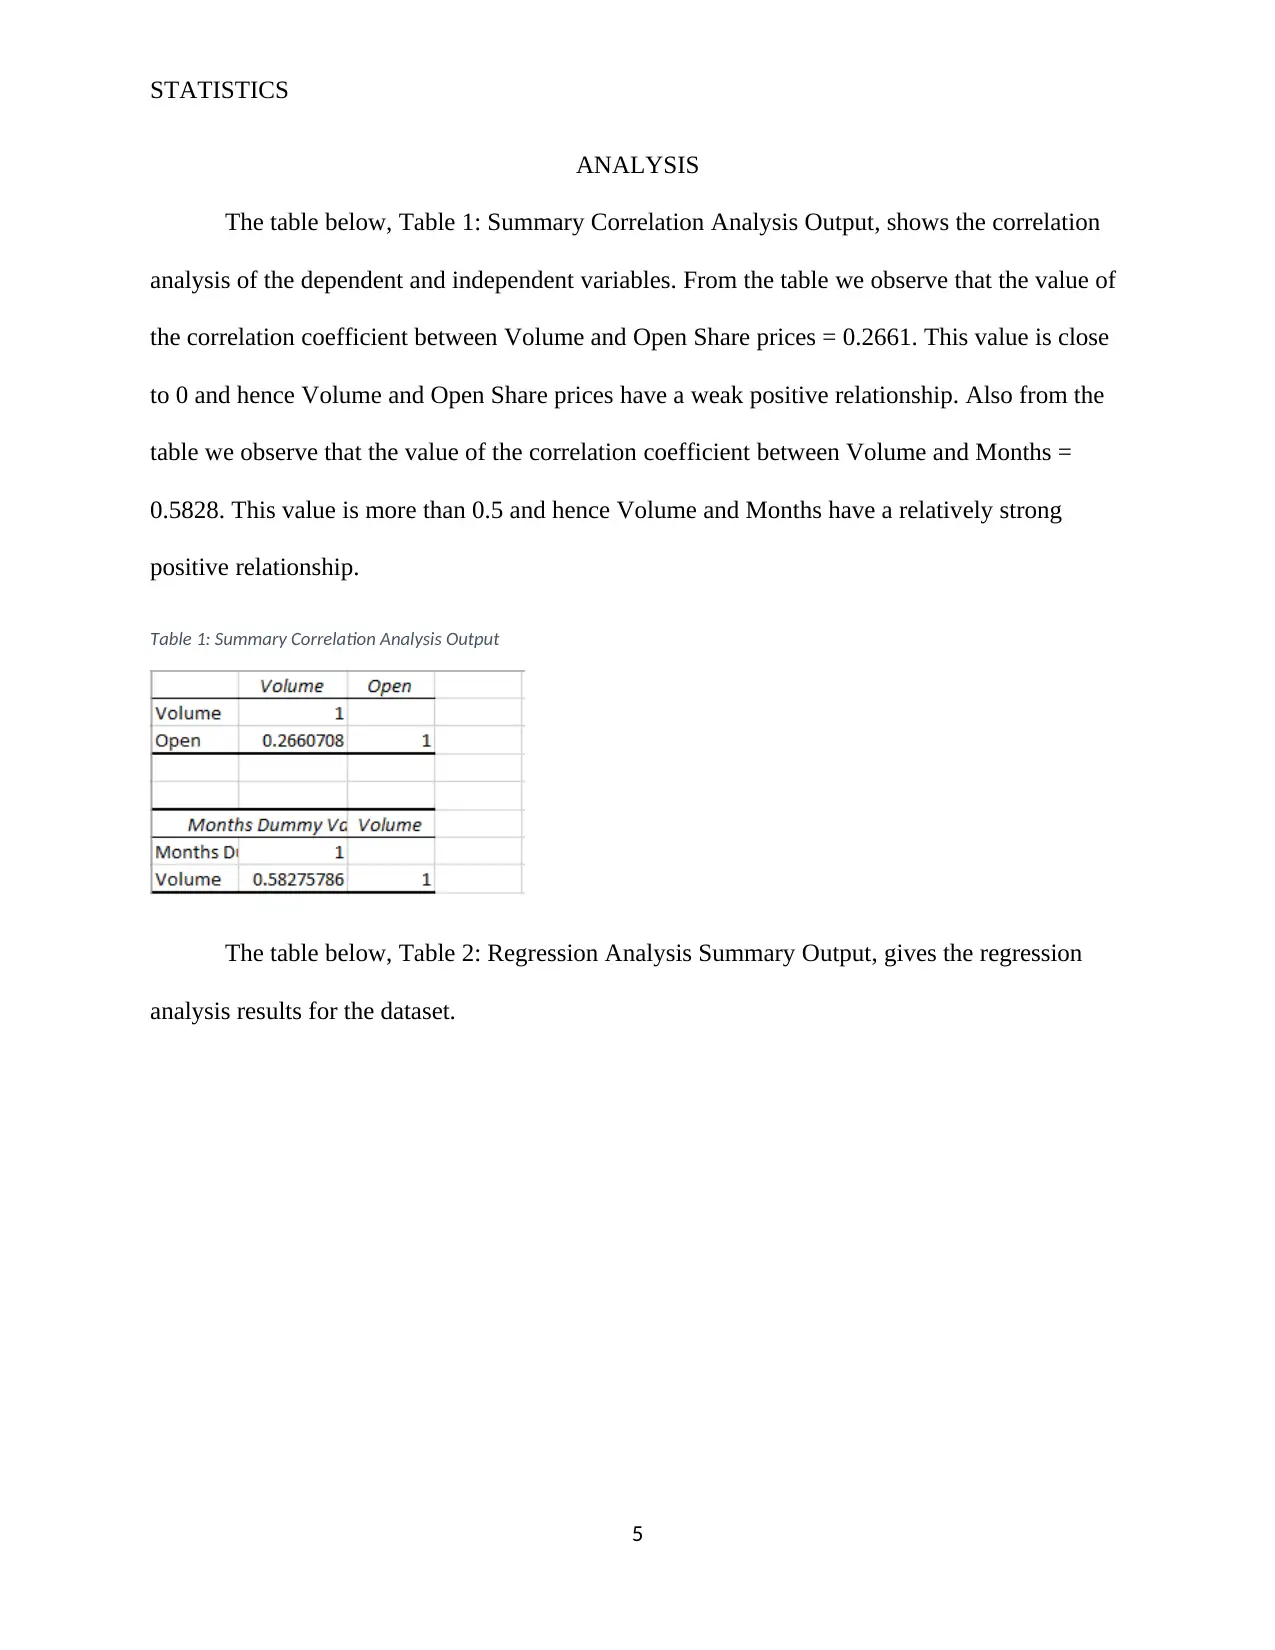
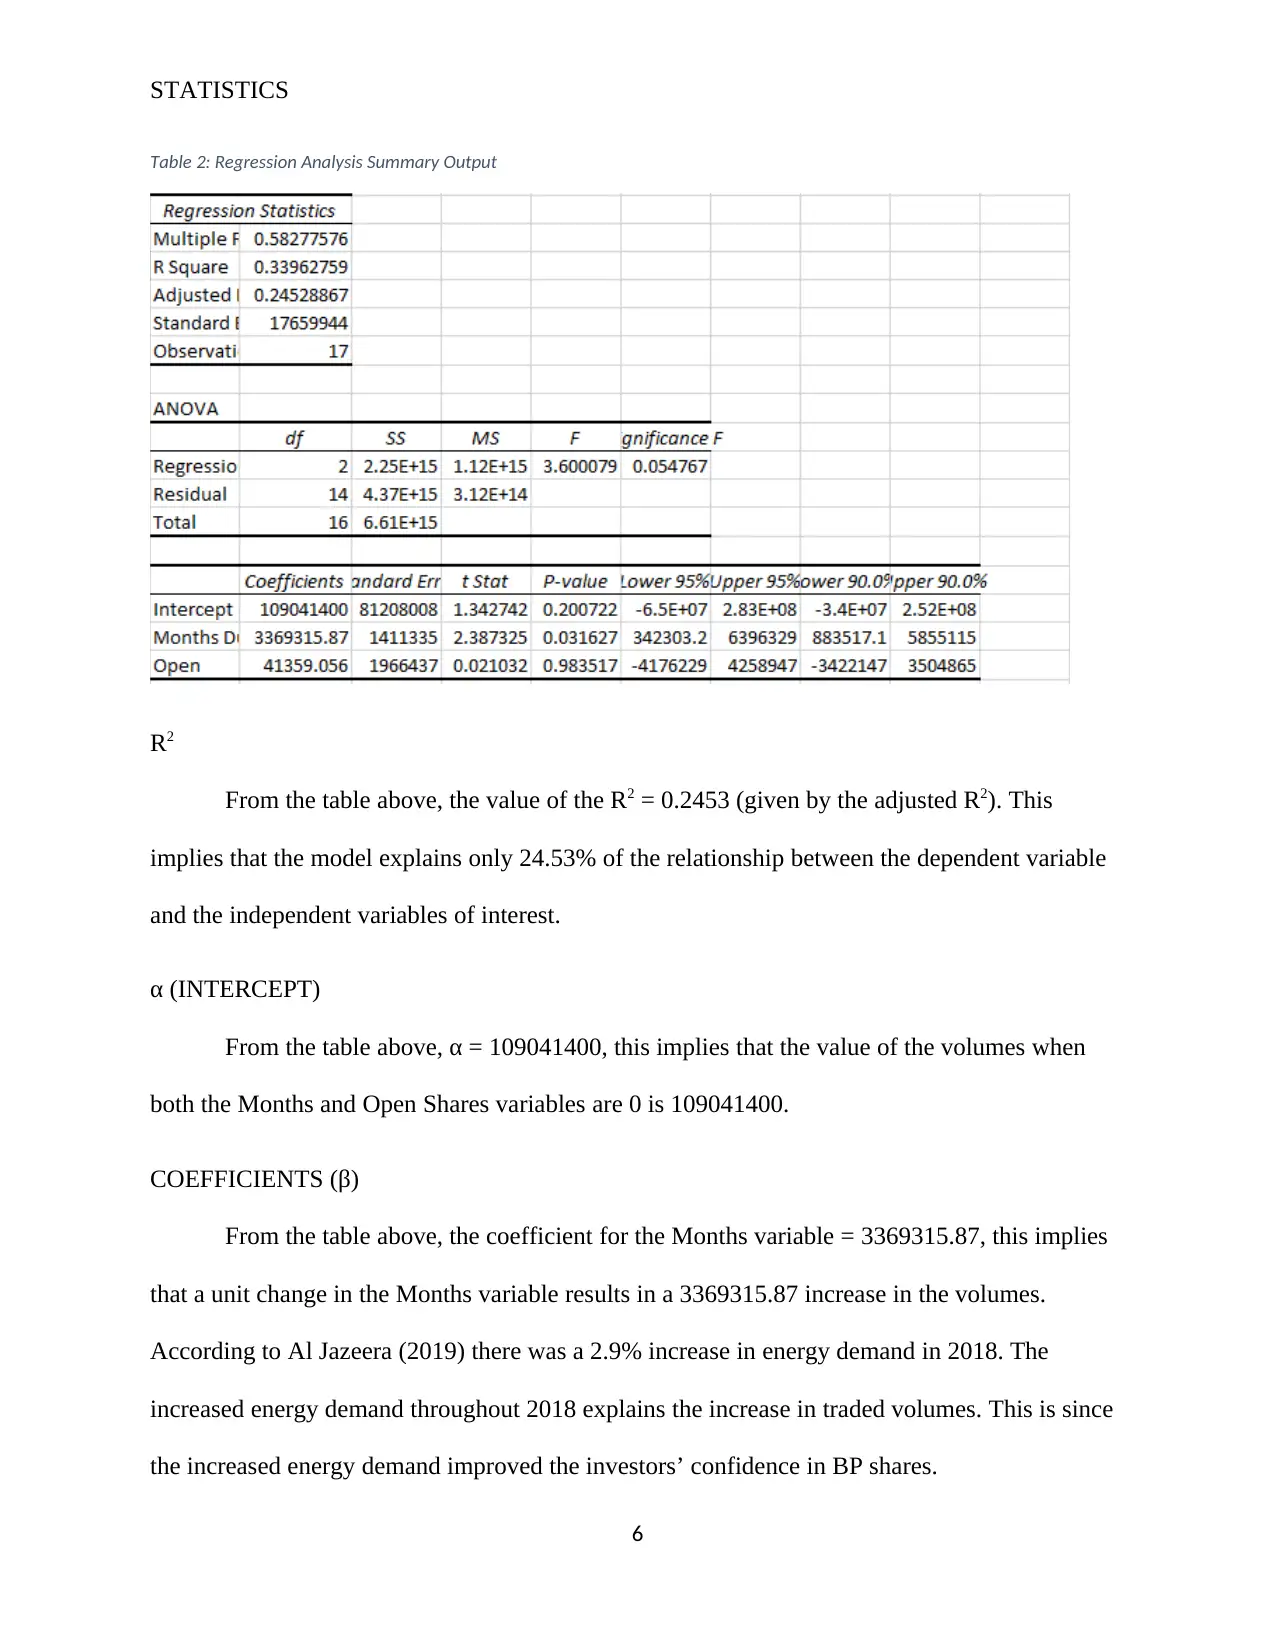
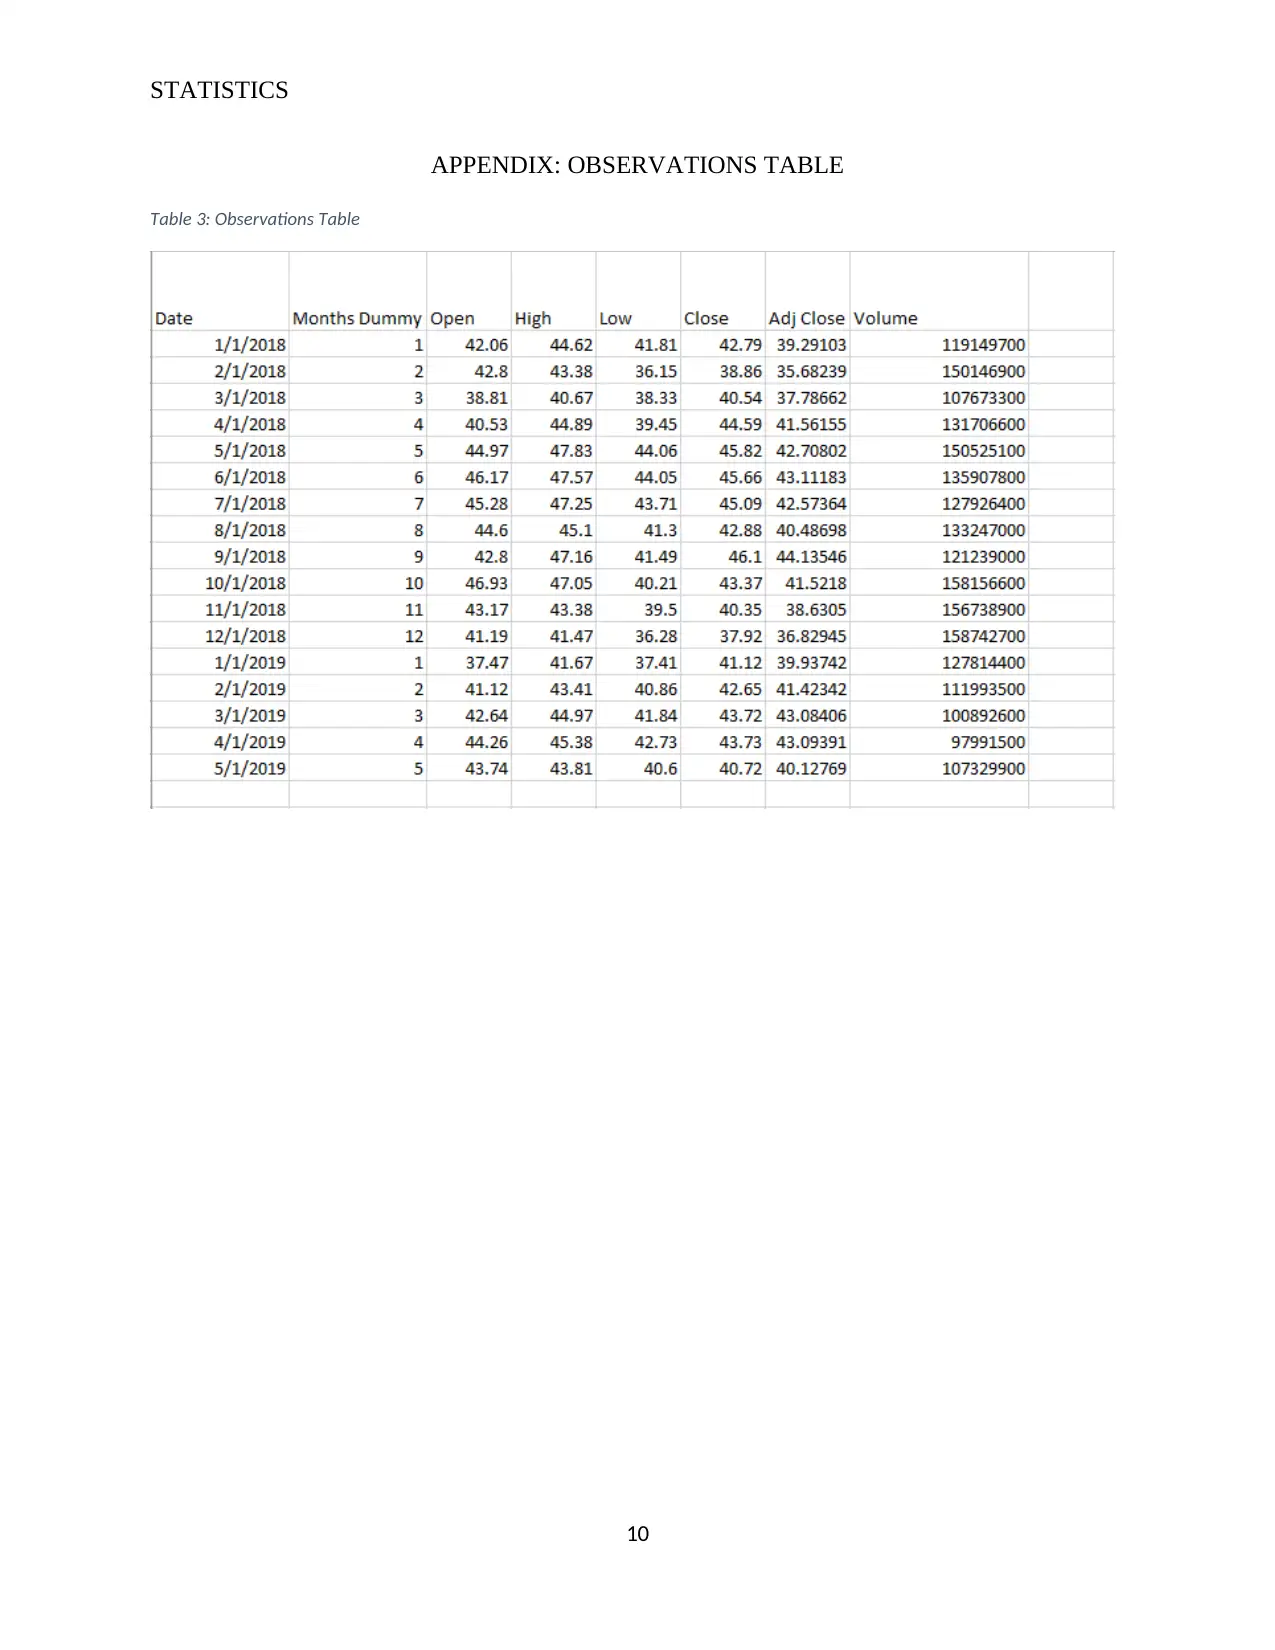
This report presents a regression analysis of British Petroleum (BP) shares, focusing on the relationship between trading volumes (dependent variable) and time period (in months) and opening share prices (independent variables). Data from Yahoo Finance was used, spanning from January 2018 to May 2019. The analysis includes correlation analysis, R-squared, intercept (α), coefficients (β), and t-statistics. The R-squared value indicates that the model explains only 24.53% of the relationship. The analysis concludes that the months of the year are a significant determinant of the traded volumes, while the opening share prices are not significant. The report also discusses the limitations of the model and suggests areas for future research, such as incorporating external factors that affect share prices to improve model accuracy. The paper follows APA style guidelines, as required by the MBAF 502 course at University Canada West.

STATISTICS
Paraphrase This Document
Need a fresh take? Get an instant paraphrase of this document with our AI Paraphraser

STATISTICS
Contents
INTRODUCTION.......................................................................................................................................3
RESEARCH ASSUMPTIONS....................................................................................................................4
DATA..........................................................................................................................................................4
ANALYSIS.................................................................................................................................................5
R2.............................................................................................................................................................6
α (INTERCEPT)......................................................................................................................................6
COEFFICIENTS (β)................................................................................................................................6
T STATISTICS.......................................................................................................................................7
CONCLUSION...........................................................................................................................................7
REFERENCES............................................................................................................................................8
APPENDIX: OBSERVATIONS TABLE...................................................................................................9
2

STATISTICS
INTRODUCTION
Regression analysis refers to a data analysis methodology that represents and gauges the
relationship that exists between variables in dataset of interest (Hosmer, 2013). The regression
analysis explains the relationship between the independent variable(s) and the dependent
variables(s) (Jorge, Angela, & Edson, 2013). This data analysis methodology can also be used
for the prediction of the dependent variable(s) using the independent variable(s) (Jaulin, 2010).
The regression analysis representation of the relationship between the independent and
dependent variables is in the form of an algebraic (mathematical) equation given below
(Freedman, 2009; O'Neil & Schutt, 2013):
yi=α + βi xi
In the equation represented above, y represents the dependent variable(s) while x
represents the independent variable(s). The α represents the intercept while β represents the
coefficients of the independent variables.
This paper focuses on the application of the regression data analysis methodology in the
determination of the relationship between variables of interest in a company. The company of
interest in the case of the analysis in this paper is the British Petroleum Company (BP). BP is a
global company with headquarters in London which operates in the energy sector, both in
exploration and sell of energy resources such as oil and natural gas. This paper will investigate
the relationship between the relevant variables in regards to the share prices of BP.
3
⊘ This is a preview!⊘
Do you want full access?
Subscribe today to unlock all pages.

Trusted by 1+ million students worldwide

STATISTICS
RESEARCH ASSUMPTIONS
The research in this paper assumes that there exists a significant relationship between the
dependent variable of interest: Trading Volumes of the shares of BP, and the independent
variables; Time period (in months) and Opening Share Prices (for every month under study).
Shares currently represent the valuations of companies around the world (Michael, Kristin,
Bernard, & C, 2018). This thus makes it important for companies to have a good understanding
of the shares trends. A critical part of this understanding is determination of the factors that
affect the different aspects of shares (French, 2017). This paper aims at providing the
understanding of the trading volumes of BP by determining the relationship between the trading
volumes and the independent variables: Time period and Opening Share Prices.
DATA
The data used in the analysis in this paper was obtained from (Yahoo Finance, 2019). The
data contains information on the shares of BP at the New York Stock Exchange (NYSE). The
data was collected for a period of 17-months from January 2018 to May 2019. The dataset
contains information on 7 variables; Date, Open, High, Low, Close, Adjusted Close and
Volumes. This paper will focus on the dependent variable; Volumes and the independent
variables: Open and Months (Dummy variable derived from the Date Variable).
4
Paraphrase This Document
Need a fresh take? Get an instant paraphrase of this document with our AI Paraphraser

STATISTICS
ANALYSIS
The table below, Table 1: Summary Correlation Analysis Output, shows the correlation
analysis of the dependent and independent variables. From the table we observe that the value of
the correlation coefficient between Volume and Open Share prices = 0.2661. This value is close
to 0 and hence Volume and Open Share prices have a weak positive relationship. Also from the
table we observe that the value of the correlation coefficient between Volume and Months =
0.5828. This value is more than 0.5 and hence Volume and Months have a relatively strong
positive relationship.
Table 1: Summary Correlation Analysis Output
The table below, Table 2: Regression Analysis Summary Output, gives the regression
analysis results for the dataset.
5

STATISTICS
Table 2: Regression Analysis Summary Output
R2
From the table above, the value of the R2 = 0.2453 (given by the adjusted R2). This
implies that the model explains only 24.53% of the relationship between the dependent variable
and the independent variables of interest.
α (INTERCEPT)
From the table above, α = 109041400, this implies that the value of the volumes when
both the Months and Open Shares variables are 0 is 109041400.
COEFFICIENTS (β)
From the table above, the coefficient for the Months variable = 3369315.87, this implies
that a unit change in the Months variable results in a 3369315.87 increase in the volumes.
According to Al Jazeera (2019) there was a 2.9% increase in energy demand in 2018. The
increased energy demand throughout 2018 explains the increase in traded volumes. This is since
the increased energy demand improved the investors’ confidence in BP shares.
6
⊘ This is a preview!⊘
Do you want full access?
Subscribe today to unlock all pages.

Trusted by 1+ million students worldwide

STATISTICS
The coefficient of the Open variables = 41359.056, this implies that a unit change in the
Open variable results in a 41359.056 increase in the volumes. BBC (2018) indicates an increase
in BP share prices by 3.9% as of October 2018. This increase in share prices likely contributed to
the increase in the traded volumes.
T STATISTICS
Considering the thumb rule with the critical value as 2, we observe from the table above
that the t statistic for Months = 2.3873 > 2, this thus implies that the Months variable is
significant. The t statistic for the Open variable = 0.021 < 2, hence the Open variable is not
significant.
CONCLUSION
From the analysis in this paper, we conclude that the Open Share prices is not a
significant determinant of the amount of shares of BP traded at the NYSE. The months of the
year on the other hand is a significant determinant of the of shares of BP traded. However, the
regression model of the traded volumes of BP shares and, Open Share prices and Time period
only explains 24.53% of this relationship and hence not fit. Further research on the BP shares
should involve the assumptions on external factors that affect the share prices, this will enable
the development of a model that has a higher accuracy.
7
Paraphrase This Document
Need a fresh take? Get an instant paraphrase of this document with our AI Paraphraser

STATISTICS
REFERENCES
Al Jazeera. (2019, June 11). Environment. Retrieved from Al Jazeera:
https://www.aljazeera.com/amp/ajimpact/extreme-weather-drove-spike-energy-demand-
emissions-bp-190611144800336.html
BBC. (2018, October 30). Business. Retrieved from BBC:
https://www.bbc.com/news/amp/business-46028712
Freedman, D. A. (2009). Statistical Models: Theory and Practice. London: Cambridge
University Press.
French, J. (2017). Asset Pricing With Investor Sentiment: On The Use of Investor Group
Behaviour to Forecast ASEAN Markets. Research in International Business and
Finance, 5(1), 124-148.
Hosmer, D. (2013). Applied Logistic Regression (1 ed.). Hoboken, New Jersey: Wiley.
Jaulin, L. (2010). Probabilistic set-membership approach for robust regression. 5(1). Journal of
Statistical Theory and Practice, 1-14.
Jorge, A. A., Angela, A., & Edson, Z. M. (2013). Robust Linear Regression Models: Use of
Stable Distribution for the Response Data. Open Journal of Statistics, 3, 3-5.
Michael, S., Kristin, D., Bernard, S., & C, Y. (2018). Trade Briefing. Industry, Labor and
Economics Group.
O'Neil, C., & Schutt, R. (2013). Doing Data Science (3rd ed.). London: O'Reily.
Yahoo Finance. (2019, May 18). History. Retrieved November 20, 2018, from Yahoo Finance:
https://finance.yahoo.com/quote/BP/history?
8

STATISTICS
period1=1514754000&period2=1560114000&interval=1mo&filter=history&frequency=
1mo
9
period1=1514754000&period2=1560114000&interval=1mo&filter=history&frequency=
1mo
9
⊘ This is a preview!⊘
Do you want full access?
Subscribe today to unlock all pages.

Trusted by 1+ million students worldwide

STATISTICS
APPENDIX: OBSERVATIONS TABLE
Table 3: Observations Table
10
APPENDIX: OBSERVATIONS TABLE
Table 3: Observations Table
10
1 out of 10