Business Planning (BPL): Financial Statement & Ratio Analysis
VerifiedAdded on 2023/06/17
|14
|3089
|212
Report
AI Summary
This report provides a comprehensive financial analysis of a business, comparing budgeted and actual performance. It includes statements of profit and loss and financial position, both budgeted and actual. Graphical analysis is used to compare budgeted and actual costs, sales, gross profit, and operating profit. The report also calculates and interprets profitability and liquidity ratios for both budgeted and actual years, providing insights into the company's financial health and performance. The analysis reveals variances between budgeted and actual figures, highlighting areas where the company exceeded or fell short of expectations, and assesses the implications for the business.
Business Planning
(BPL)
(BPL)
Paraphrase This Document
Need a fresh take? Get an instant paraphrase of this document with our AI Paraphraser
TABLE OF CONTENTS
Summary.................................................................................................................................................3
Statement of Profit & Loss A/c (Budgeted).............................................................................................4
Statement of Profit & Loss A/c (Actual)...................................................................................................4
Statement of Financial Position (Budgeted)............................................................................................5
Statement of Financial Position (ACTUAL)...............................................................................................6
A pie chart show the different relative size of budgeted reimbursement for the year. Provide a concise
comment on interpretation what the information from the graphical record means............................6
A pie chart showing actual costs for the year Compare 2 pie charts.......................................................7
The next graphs comparing the monetary fund against with the actual public presentation. Provide a
brief comment on interpretation what the data graphs and implication for the business.....................8
A graph comparison for the 12 months of fund against actual sales...................................................8
• Graph comparing Tweleve months of fund against actual gross profit.............................................9
• Graph for 12 months of monetary fund against actual operational profit......................................10
Calculation of accounting ratios including two profitability ratios and two liquidity ratios of budgeted
and actual years....................................................................................................................................11
References.................................................................................................................................................14
Books & Journals...................................................................................................................................14
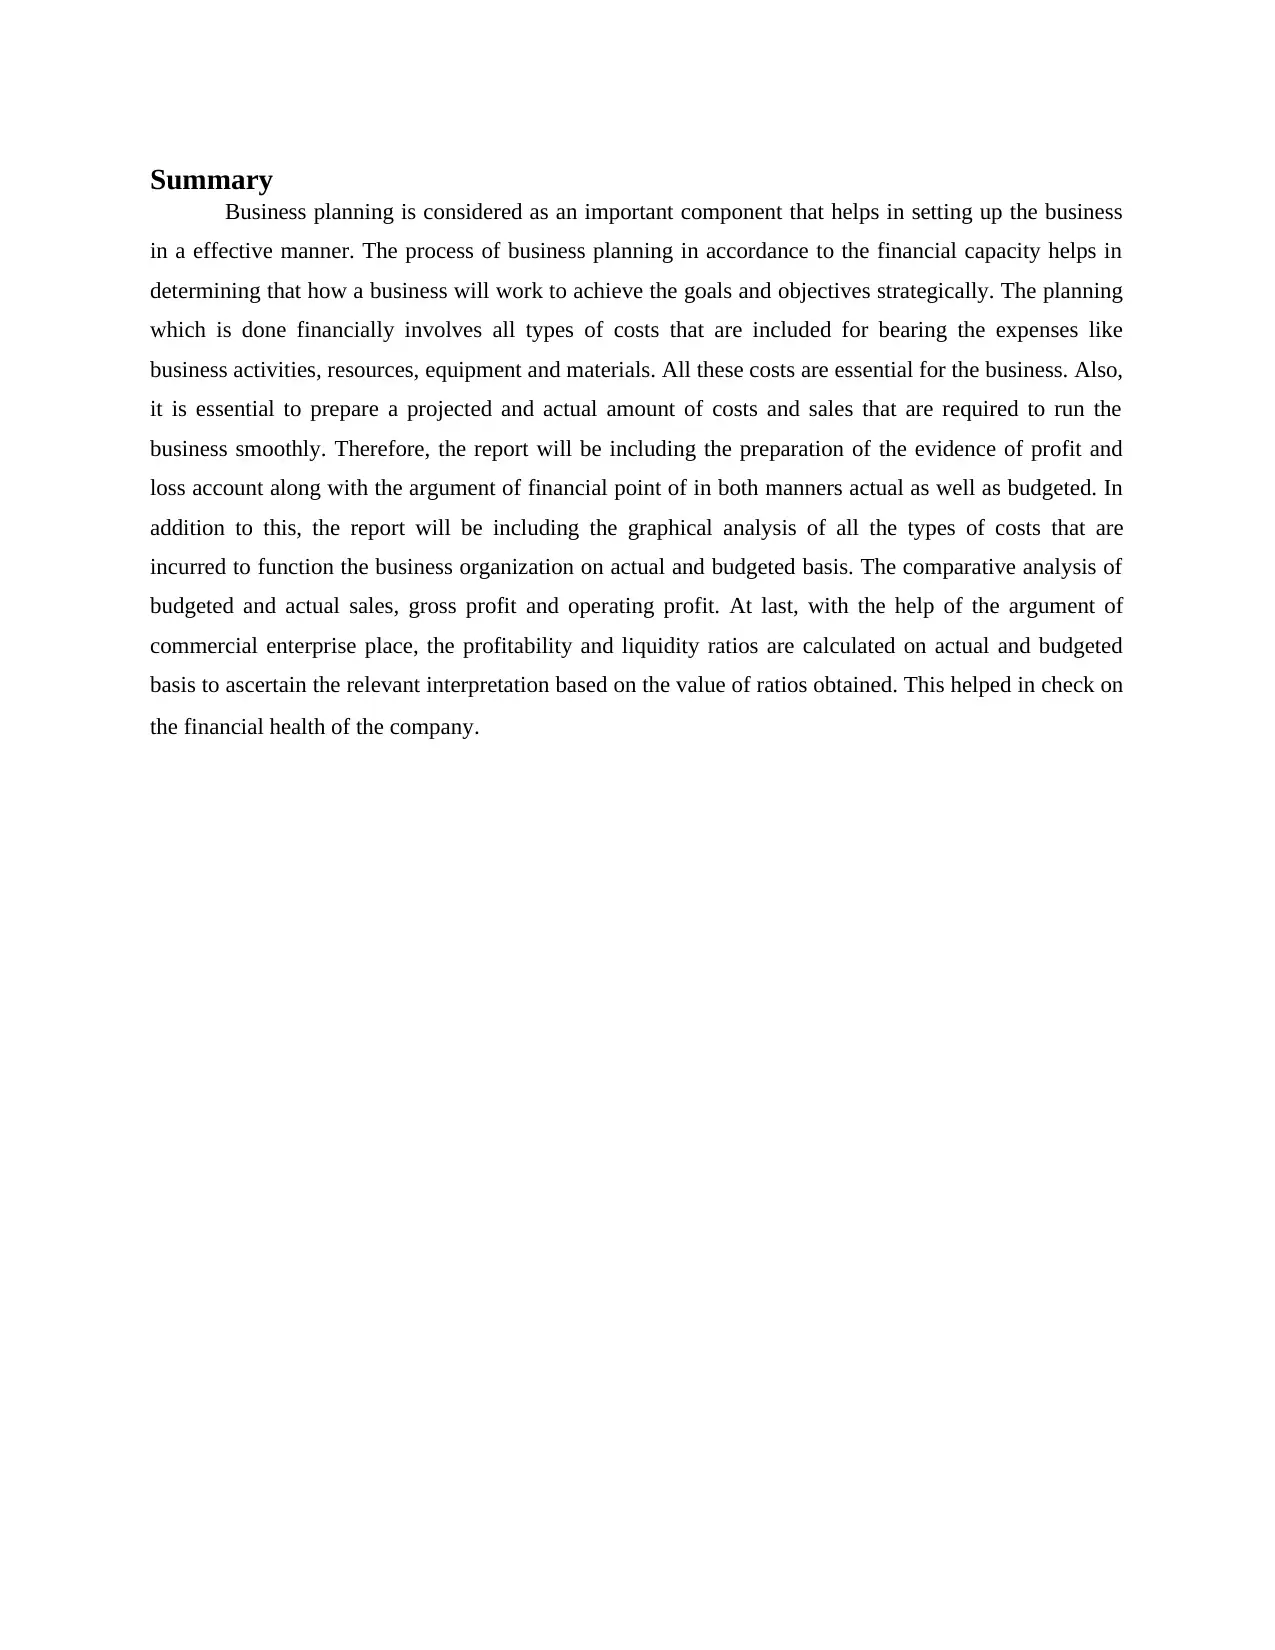
Summary
Business planning is considered as an important component that helps in setting up the business
in a effective manner. The process of business planning in accordance to the financial capacity helps in
determining that how a business will work to achieve the goals and objectives strategically. The planning
which is done financially involves all types of costs that are included for bearing the expenses like
business activities, resources, equipment and materials. All these costs are essential for the business. Also,
it is essential to prepare a projected and actual amount of costs and sales that are required to run the
business smoothly. Therefore, the report will be including the preparation of the evidence of profit and
loss account along with the argument of financial point of in both manners actual as well as budgeted. In
addition to this, the report will be including the graphical analysis of all the types of costs that are
incurred to function the business organization on actual and budgeted basis. The comparative analysis of
budgeted and actual sales, gross profit and operating profit. At last, with the help of the argument of
commercial enterprise place, the profitability and liquidity ratios are calculated on actual and budgeted
basis to ascertain the relevant interpretation based on the value of ratios obtained. This helped in check on
the financial health of the company.
⊘ This is a preview!⊘
Do you want full access?
Subscribe today to unlock all pages.
Trusted by 1+ million students worldwide
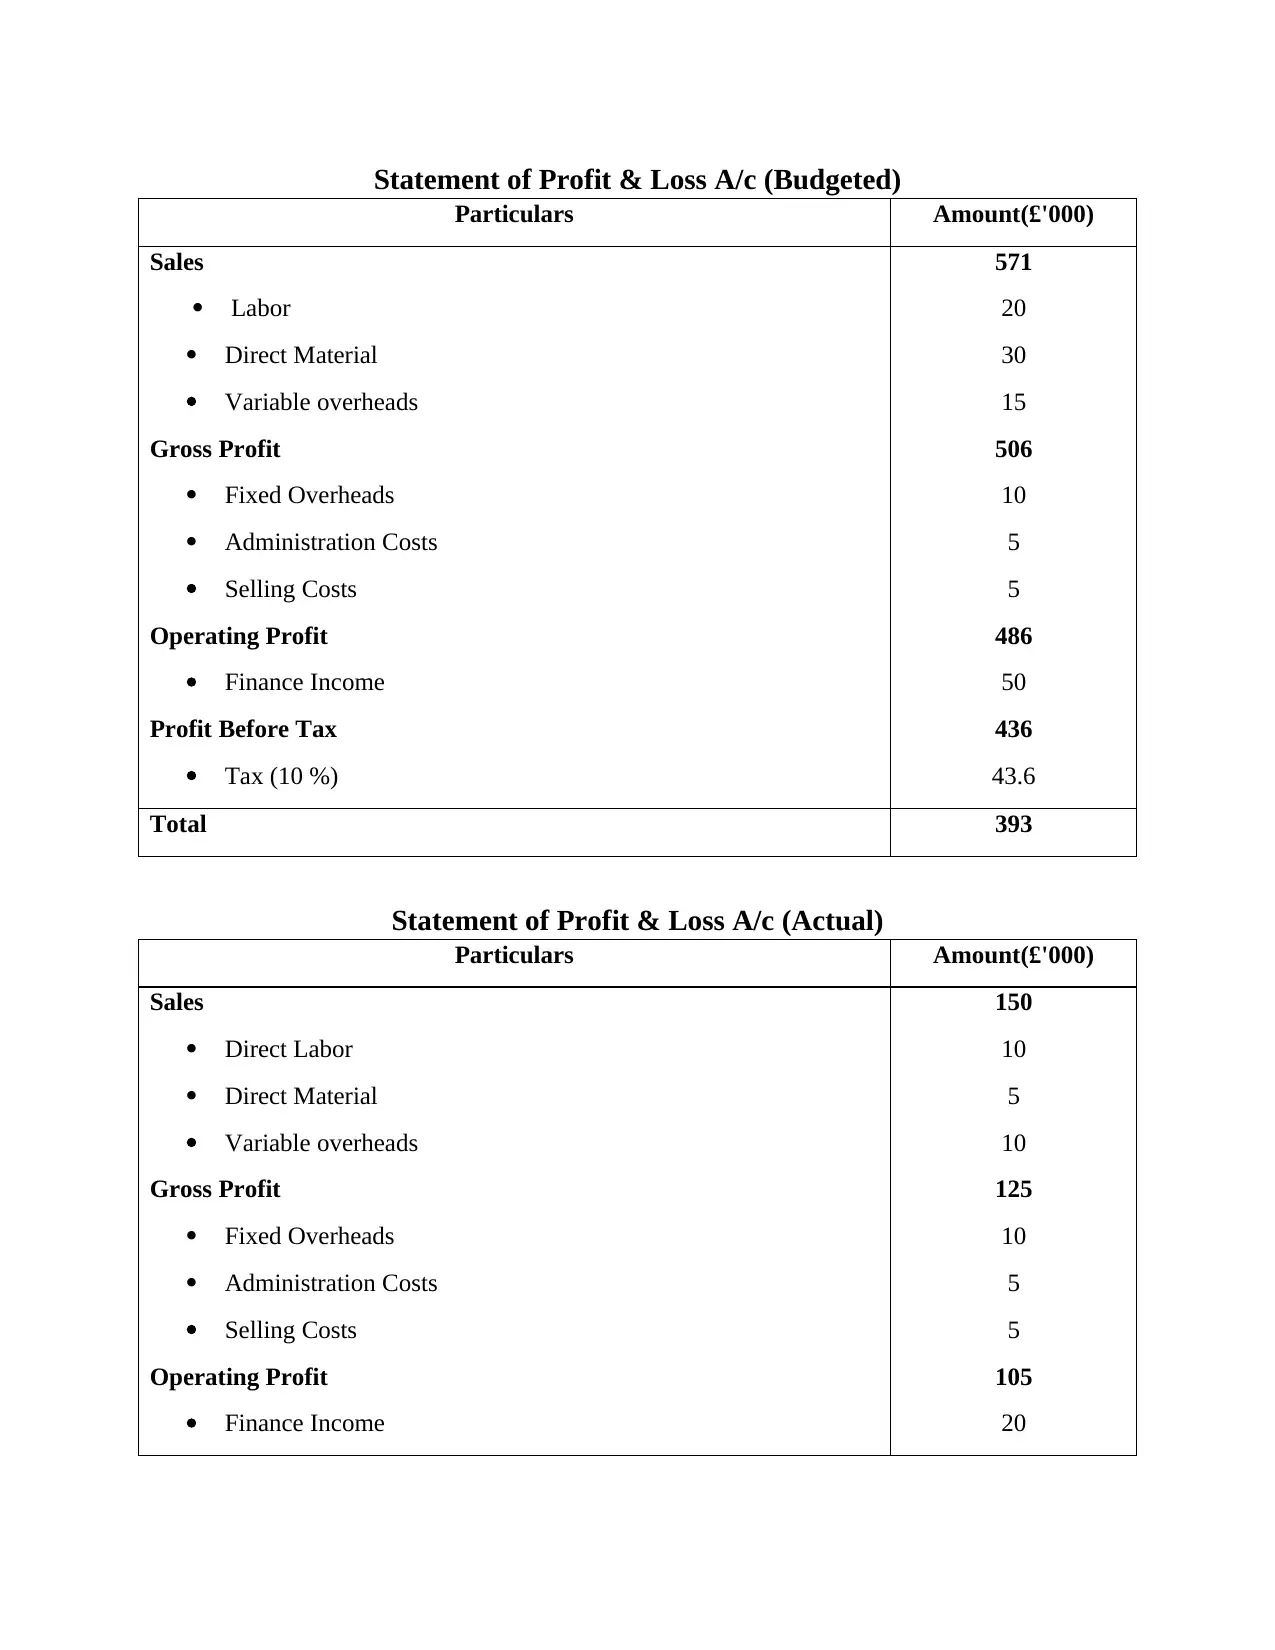
Statement of Profit & Loss A/c (Budgeted)
Particulars Amount(£'000)
Sales
Labor
Direct Material
Variable overheads
Gross Profit
Fixed Overheads
Administration Costs
Selling Costs
Operating Profit
Finance Income
Profit Before Tax
Tax (10 %)
571
20
30
15
506
10
5
5
486
50
436
43.6
Total 393
Statement of Profit & Loss A/c (Actual)
Particulars Amount(£'000)
Sales
Direct Labor
Direct Material
Variable overheads
Gross Profit
Fixed Overheads
Administration Costs
Selling Costs
Operating Profit
Finance Income
150
10
5
10
125
10
5
5
105
20
Particulars Amount(£'000)
Sales
Labor
Direct Material
Variable overheads
Gross Profit
Fixed Overheads
Administration Costs
Selling Costs
Operating Profit
Finance Income
Profit Before Tax
Tax (10 %)
571
20
30
15
506
10
5
5
486
50
436
43.6
Total 393
Statement of Profit & Loss A/c (Actual)
Particulars Amount(£'000)
Sales
Direct Labor
Direct Material
Variable overheads
Gross Profit
Fixed Overheads
Administration Costs
Selling Costs
Operating Profit
Finance Income
150
10
5
10
125
10
5
5
105
20
Paraphrase This Document
Need a fresh take? Get an instant paraphrase of this document with our AI Paraphraser
Profit Before Tax
Tax (10 %)
85
8.5
Total 76.5
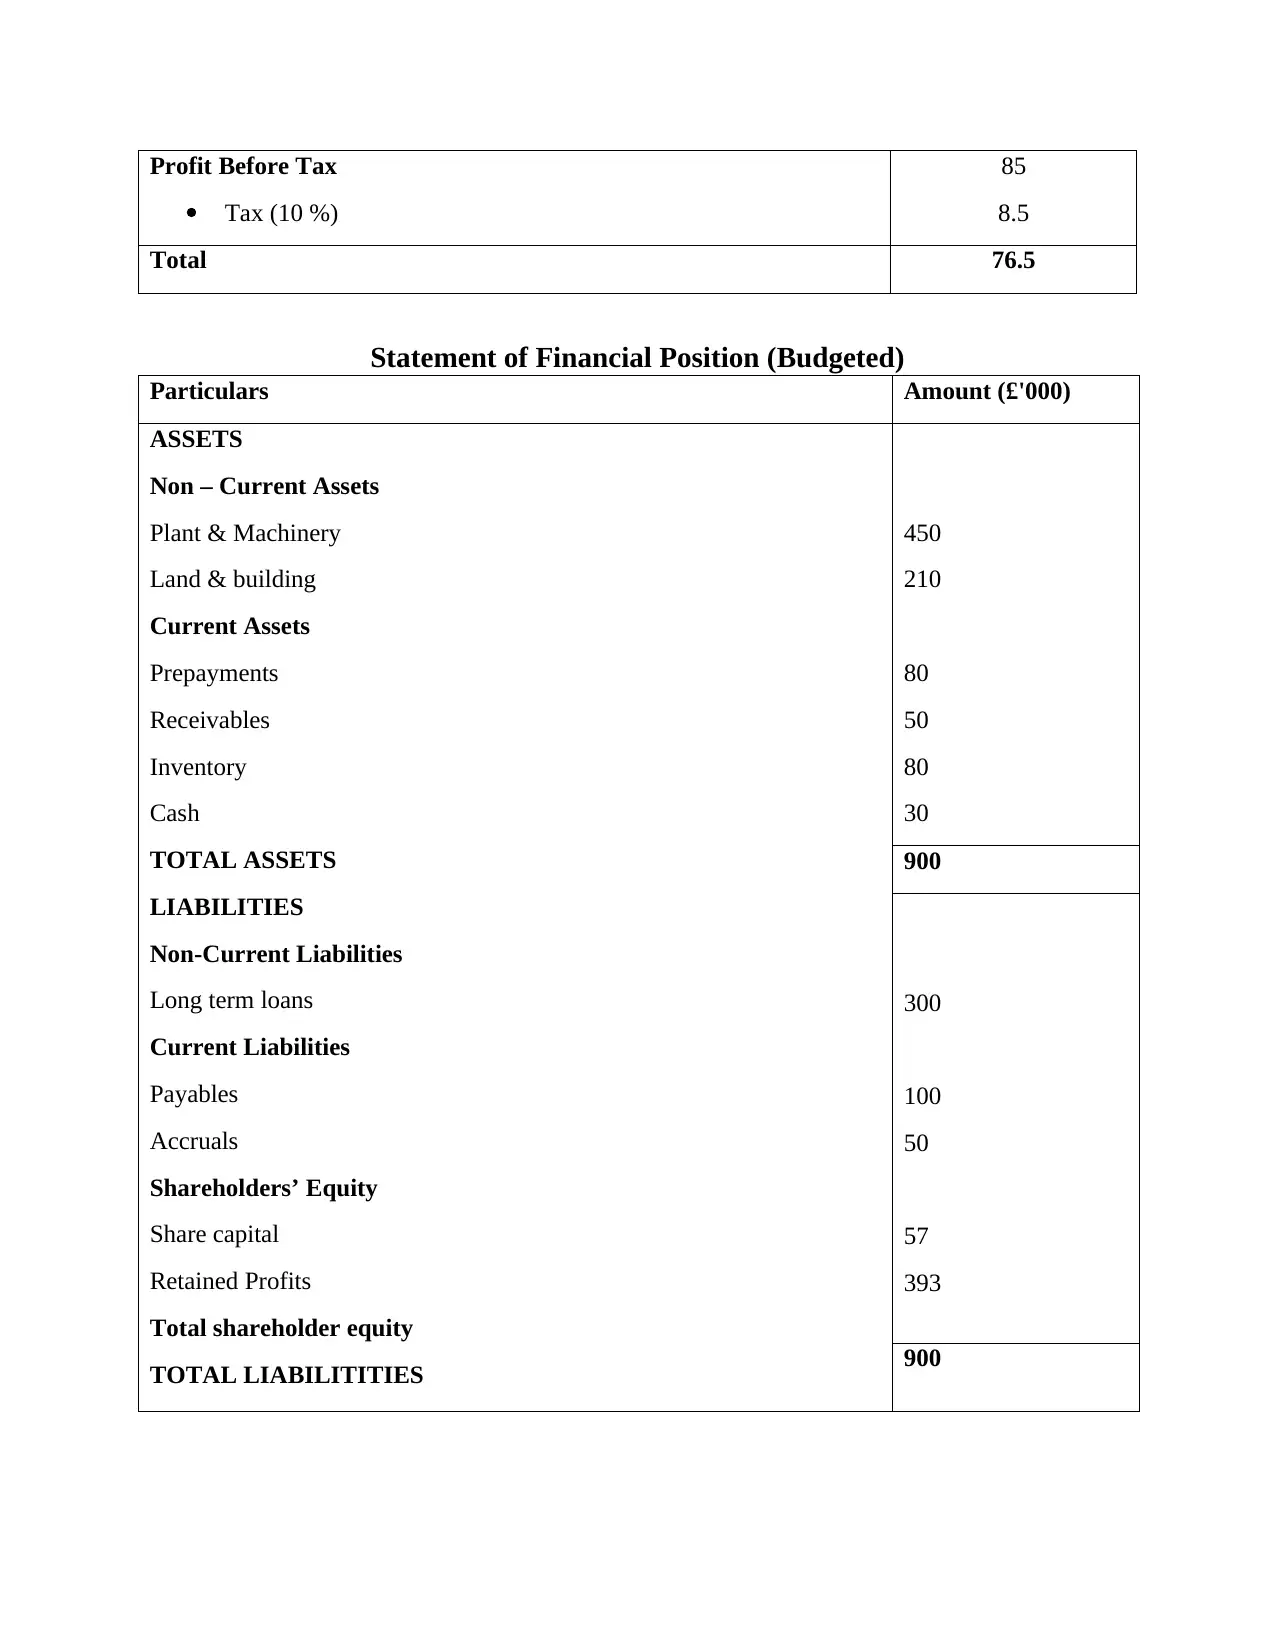
Statement of Financial Position (Budgeted)
Particulars Amount (£'000)
ASSETS
Non – Current Assets
Plant & Machinery
Land & building
Current Assets
Prepayments
Receivables
Inventory
Cash
TOTAL ASSETS
LIABILITIES
Non-Current Liabilities
Long term loans
Current Liabilities
Payables
Accruals
Shareholders’ Equity
Share capital
Retained Profits
Total shareholder equity
TOTAL LIABILITITIES
450
210
80
50
80
30
900
300
100
50
57
393
900
Tax (10 %)
85
8.5
Total 76.5
Statement of Financial Position (Budgeted)
Particulars Amount (£'000)
ASSETS
Non – Current Assets
Plant & Machinery
Land & building
Current Assets
Prepayments
Receivables
Inventory
Cash
TOTAL ASSETS
LIABILITIES
Non-Current Liabilities
Long term loans
Current Liabilities
Payables
Accruals
Shareholders’ Equity
Share capital
Retained Profits
Total shareholder equity
TOTAL LIABILITITIES
450
210
80
50
80
30
900
300
100
50
57
393
900
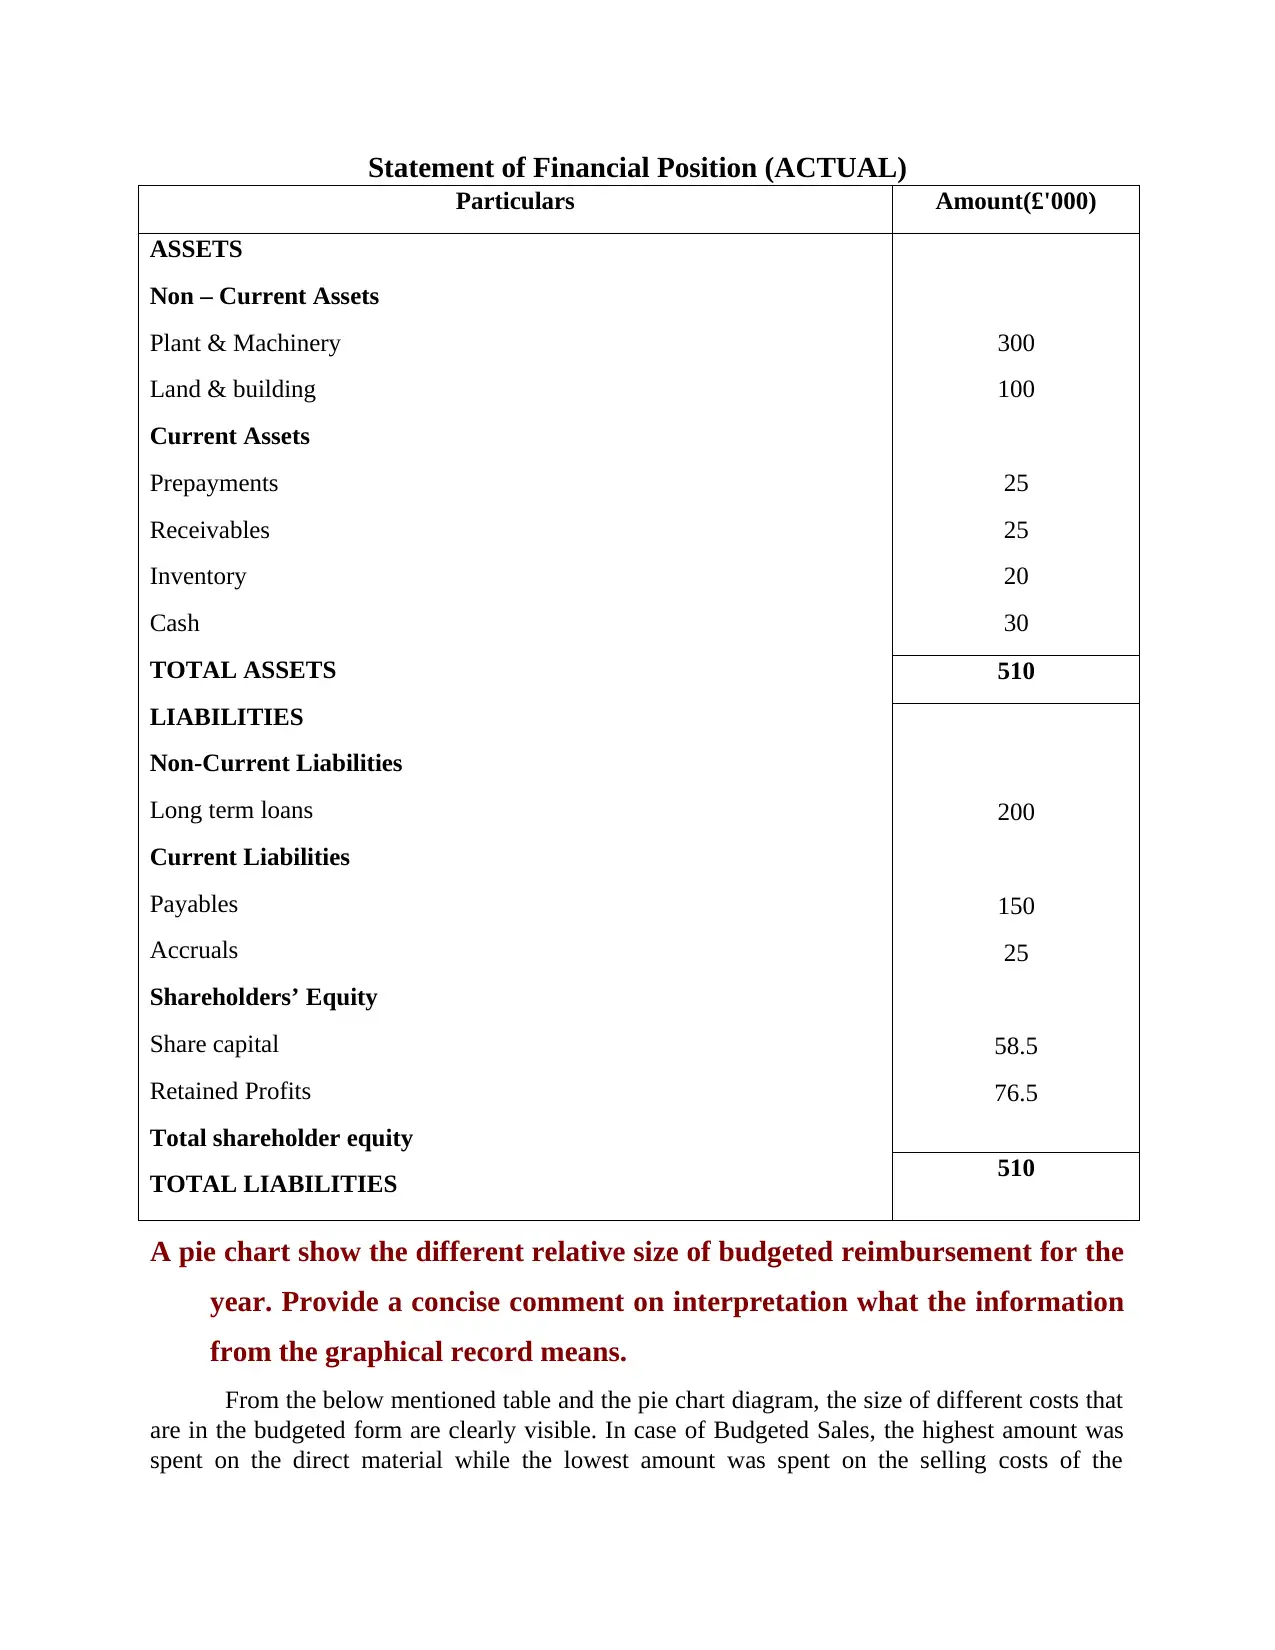
Statement of Financial Position (ACTUAL)
Particulars Amount(£'000)
ASSETS
Non – Current Assets
Plant & Machinery
Land & building
Current Assets
Prepayments
Receivables
Inventory
Cash
TOTAL ASSETS
LIABILITIES
Non-Current Liabilities
Long term loans
Current Liabilities
Payables
Accruals
Shareholders’ Equity
Share capital
Retained Profits
Total shareholder equity
TOTAL LIABILITIES
300
100
25
25
20
30
510
200
150
25
58.5
76.5
510
A pie chart show the different relative size of budgeted reimbursement for the
year. Provide a concise comment on interpretation what the information
from the graphical record means.
From the below mentioned table and the pie chart diagram, the size of different costs that
are in the budgeted form are clearly visible. In case of Budgeted Sales, the highest amount was
spent on the direct material while the lowest amount was spent on the selling costs of the
⊘ This is a preview!⊘
Do you want full access?
Subscribe today to unlock all pages.
Trusted by 1+ million students worldwide
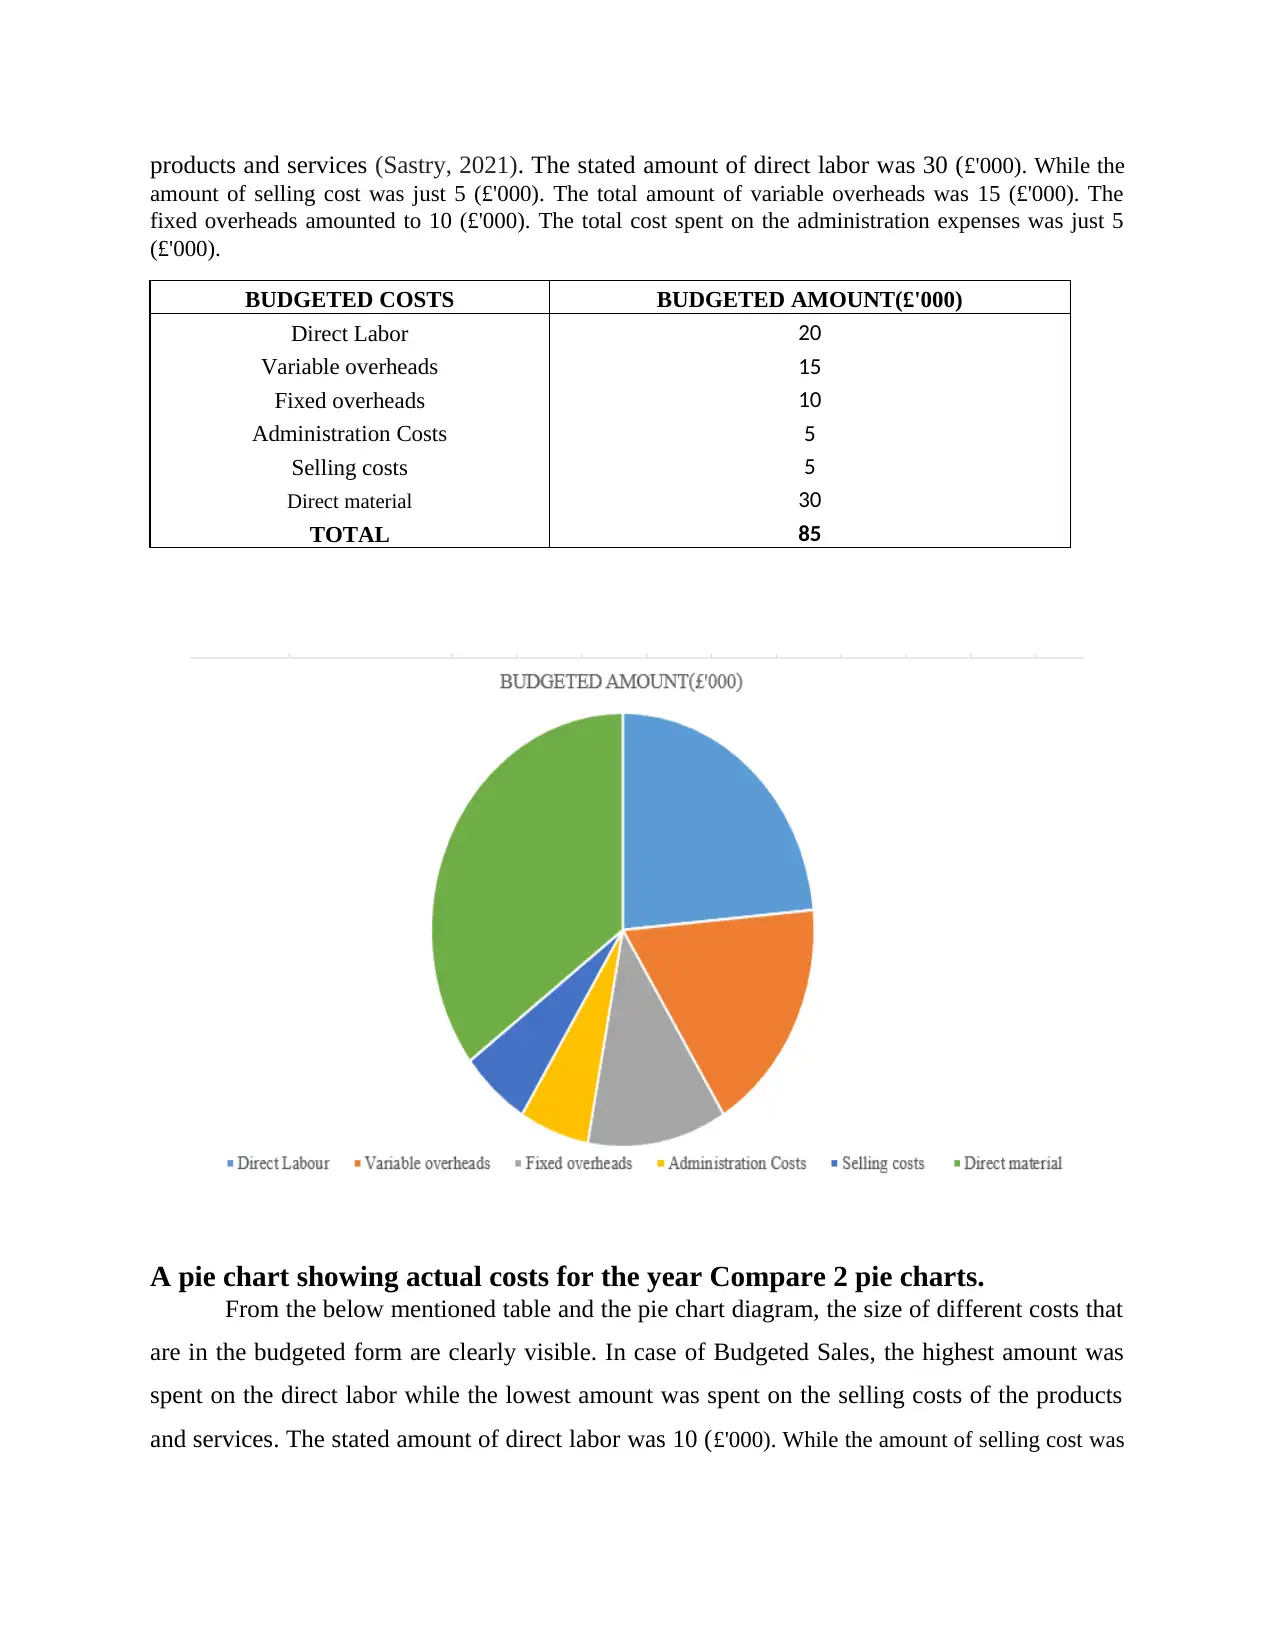
products and services (Sastry, 2021). The stated amount of direct labor was 30 (£'000). While the
amount of selling cost was just 5 (£'000). The total amount of variable overheads was 15 (£'000). The
fixed overheads amounted to 10 (£'000). The total cost spent on the administration expenses was just 5
(£'000).
BUDGETED COSTS BUDGETED AMOUNT(£'000)
Direct Labor 20
Variable overheads 15
Fixed overheads 10
Administration Costs 5
Selling costs 5
Direct material 30
TOTAL 85
A pie chart showing actual costs for the year Compare 2 pie charts.
From the below mentioned table and the pie chart diagram, the size of different costs that
are in the budgeted form are clearly visible. In case of Budgeted Sales, the highest amount was
spent on the direct labor while the lowest amount was spent on the selling costs of the products
and services. The stated amount of direct labor was 10 (£'000). While the amount of selling cost was
Paraphrase This Document
Need a fresh take? Get an instant paraphrase of this document with our AI Paraphraser
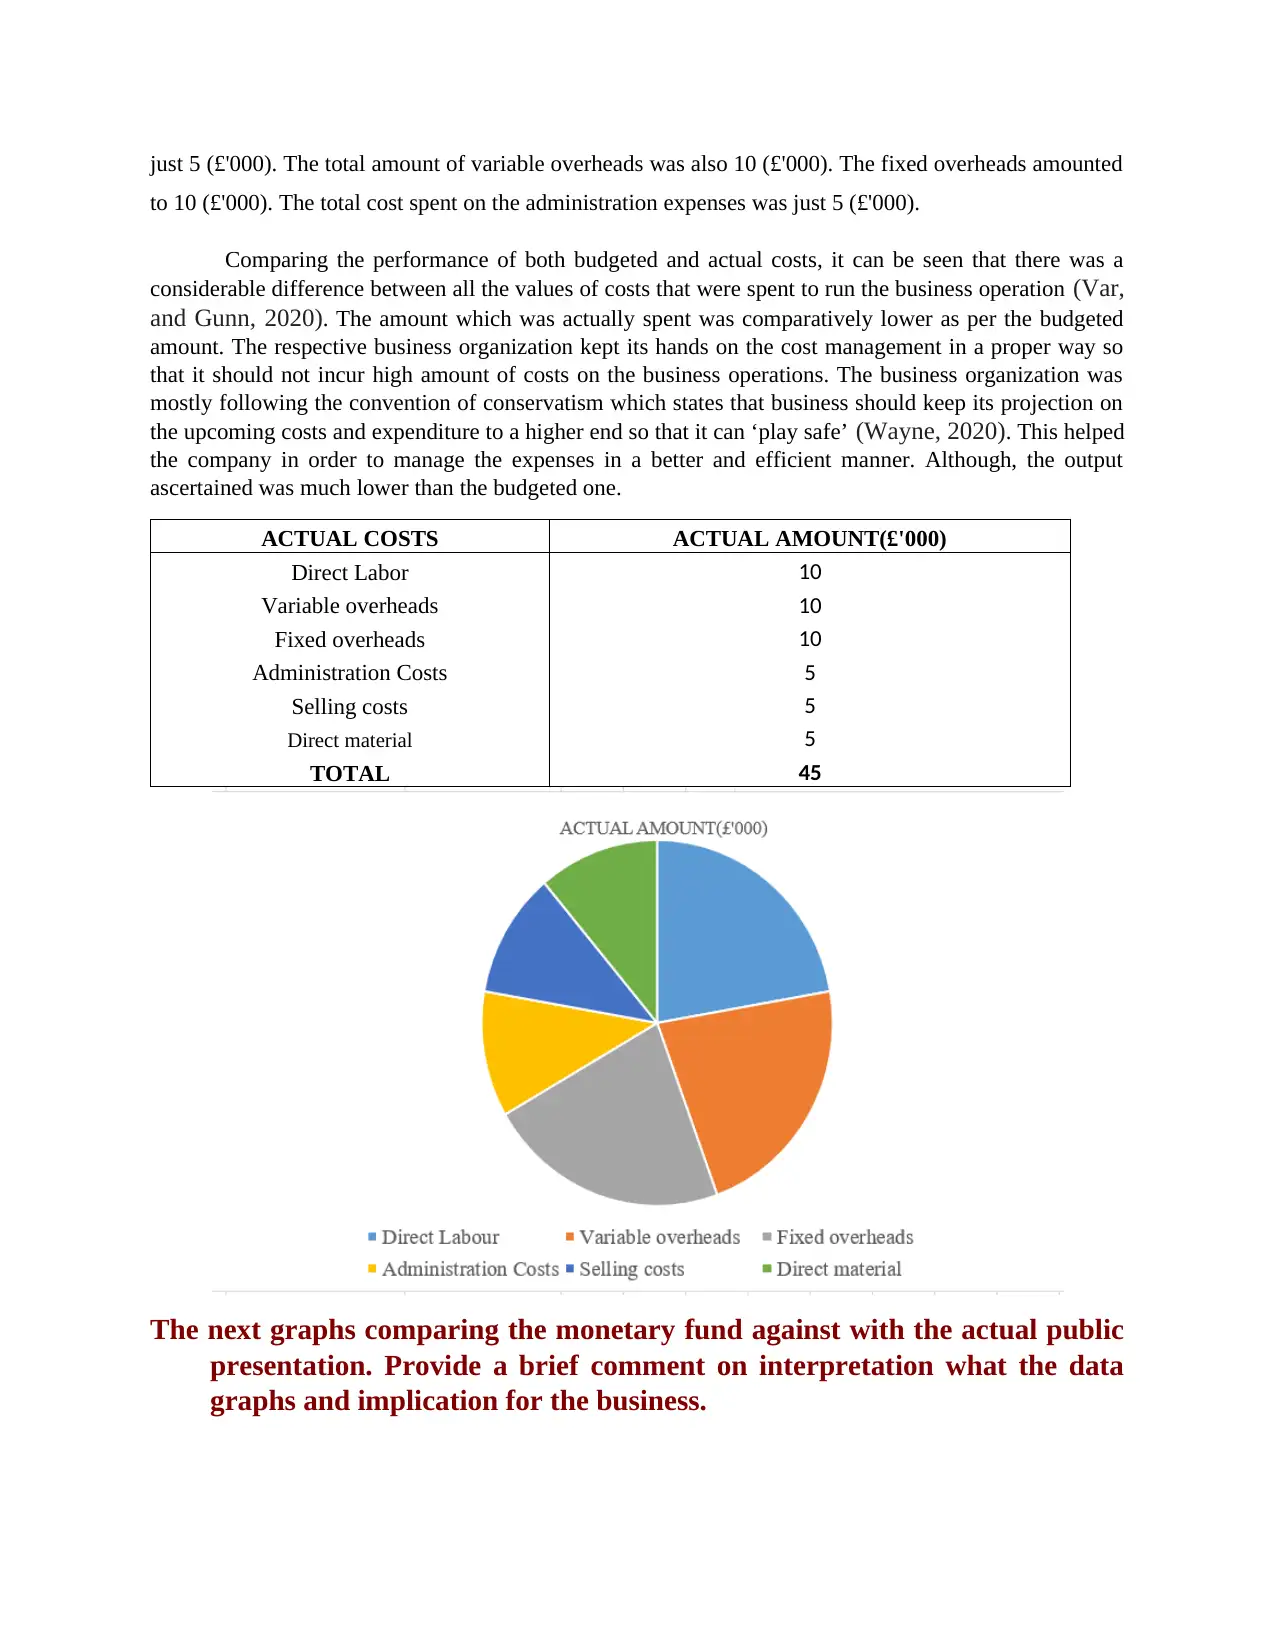
just 5 (£'000). The total amount of variable overheads was also 10 (£'000). The fixed overheads amounted
to 10 (£'000). The total cost spent on the administration expenses was just 5 (£'000).
Comparing the performance of both budgeted and actual costs, it can be seen that there was a
considerable difference between all the values of costs that were spent to run the business operation (Var,
and Gunn, 2020). The amount which was actually spent was comparatively lower as per the budgeted
amount. The respective business organization kept its hands on the cost management in a proper way so
that it should not incur high amount of costs on the business operations. The business organization was
mostly following the convention of conservatism which states that business should keep its projection on
the upcoming costs and expenditure to a higher end so that it can ‘play safe’ (Wayne, 2020). This helped
the company in order to manage the expenses in a better and efficient manner. Although, the output
ascertained was much lower than the budgeted one.
The next graphs comparing the monetary fund against with the actual public
presentation. Provide a brief comment on interpretation what the data
graphs and implication for the business.
ACTUAL COSTS ACTUAL AMOUNT(£'000)
Direct Labor 10
Variable overheads 10
Fixed overheads 10
Administration Costs 5
Selling costs 5
Direct material 5
TOTAL 45
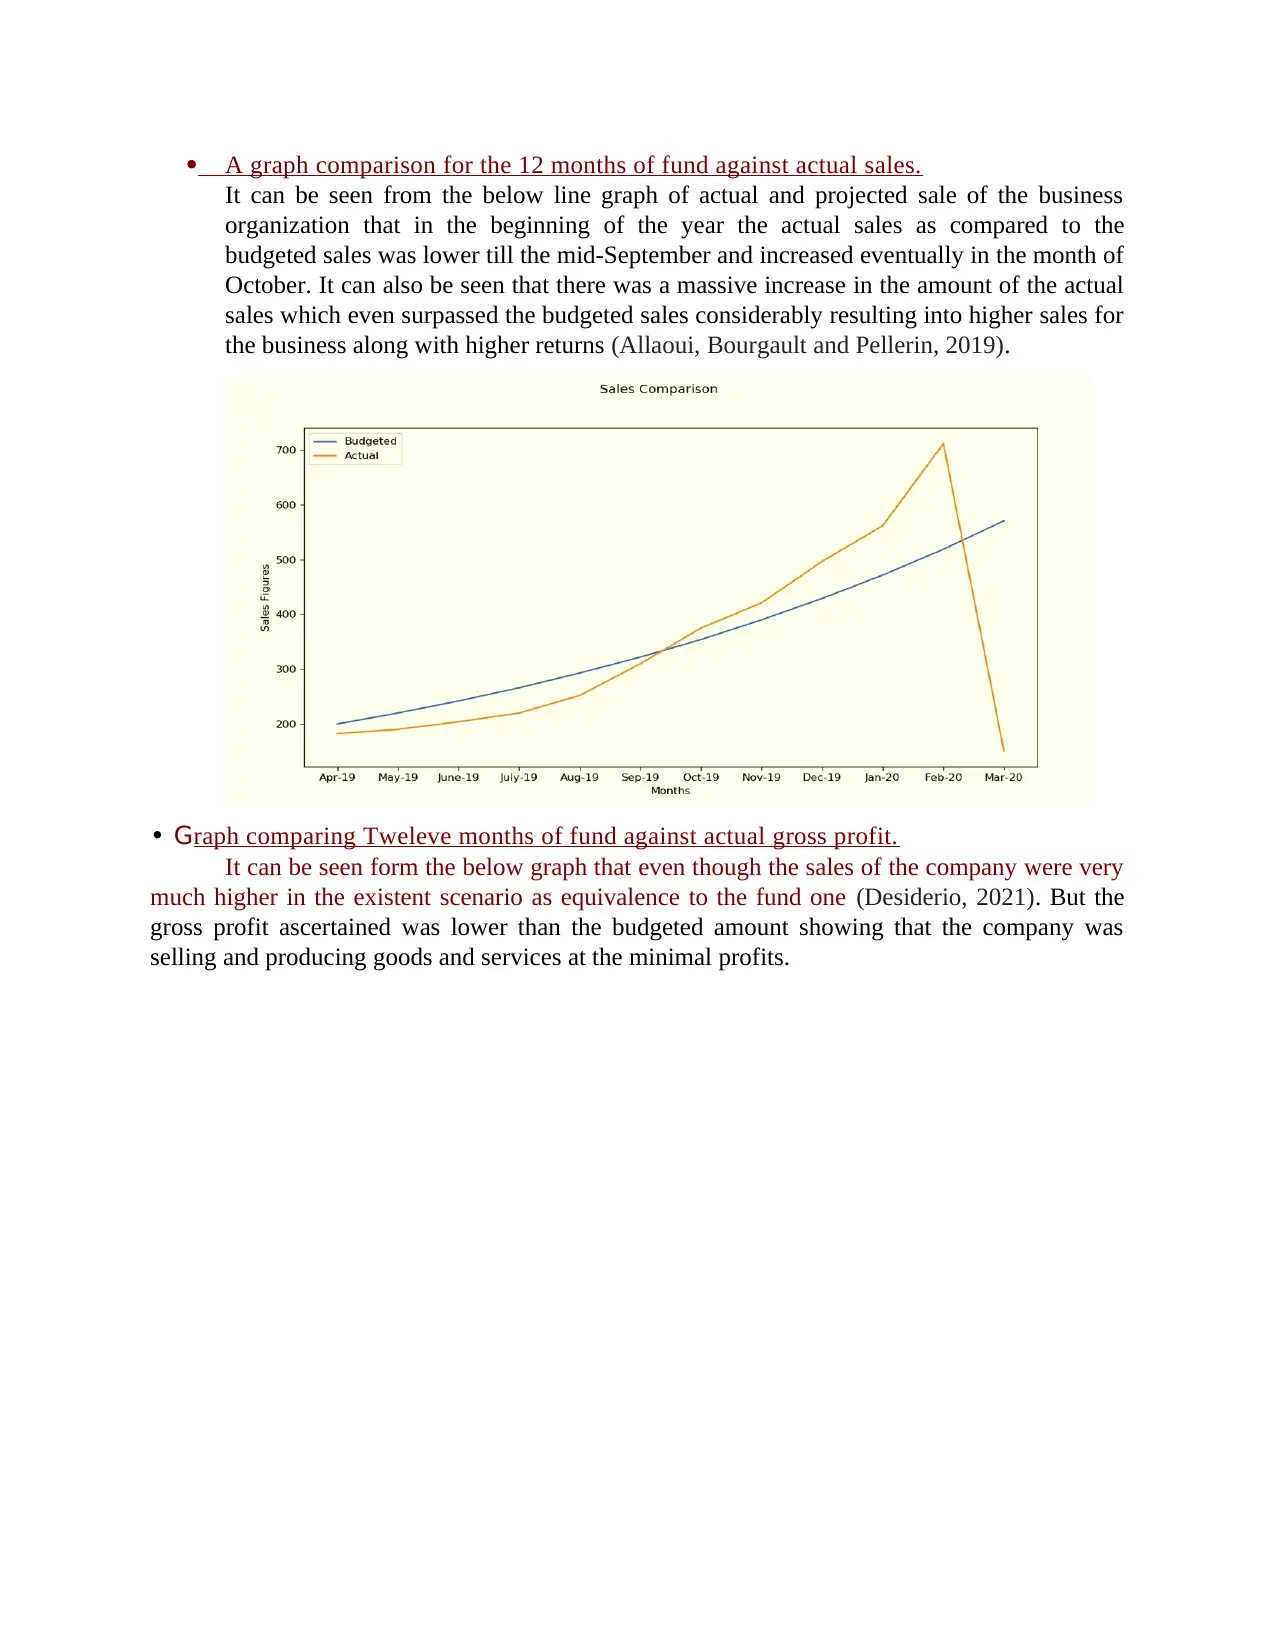
A graph comparison for the 12 months of fund against actual sales.
It can be seen from the below line graph of actual and projected sale of the business
organization that in the beginning of the year the actual sales as compared to the
budgeted sales was lower till the mid-September and increased eventually in the month of
October. It can also be seen that there was a massive increase in the amount of the actual
sales which even surpassed the budgeted sales considerably resulting into higher sales for
the business along with higher returns (Allaoui, Bourgault and Pellerin, 2019).
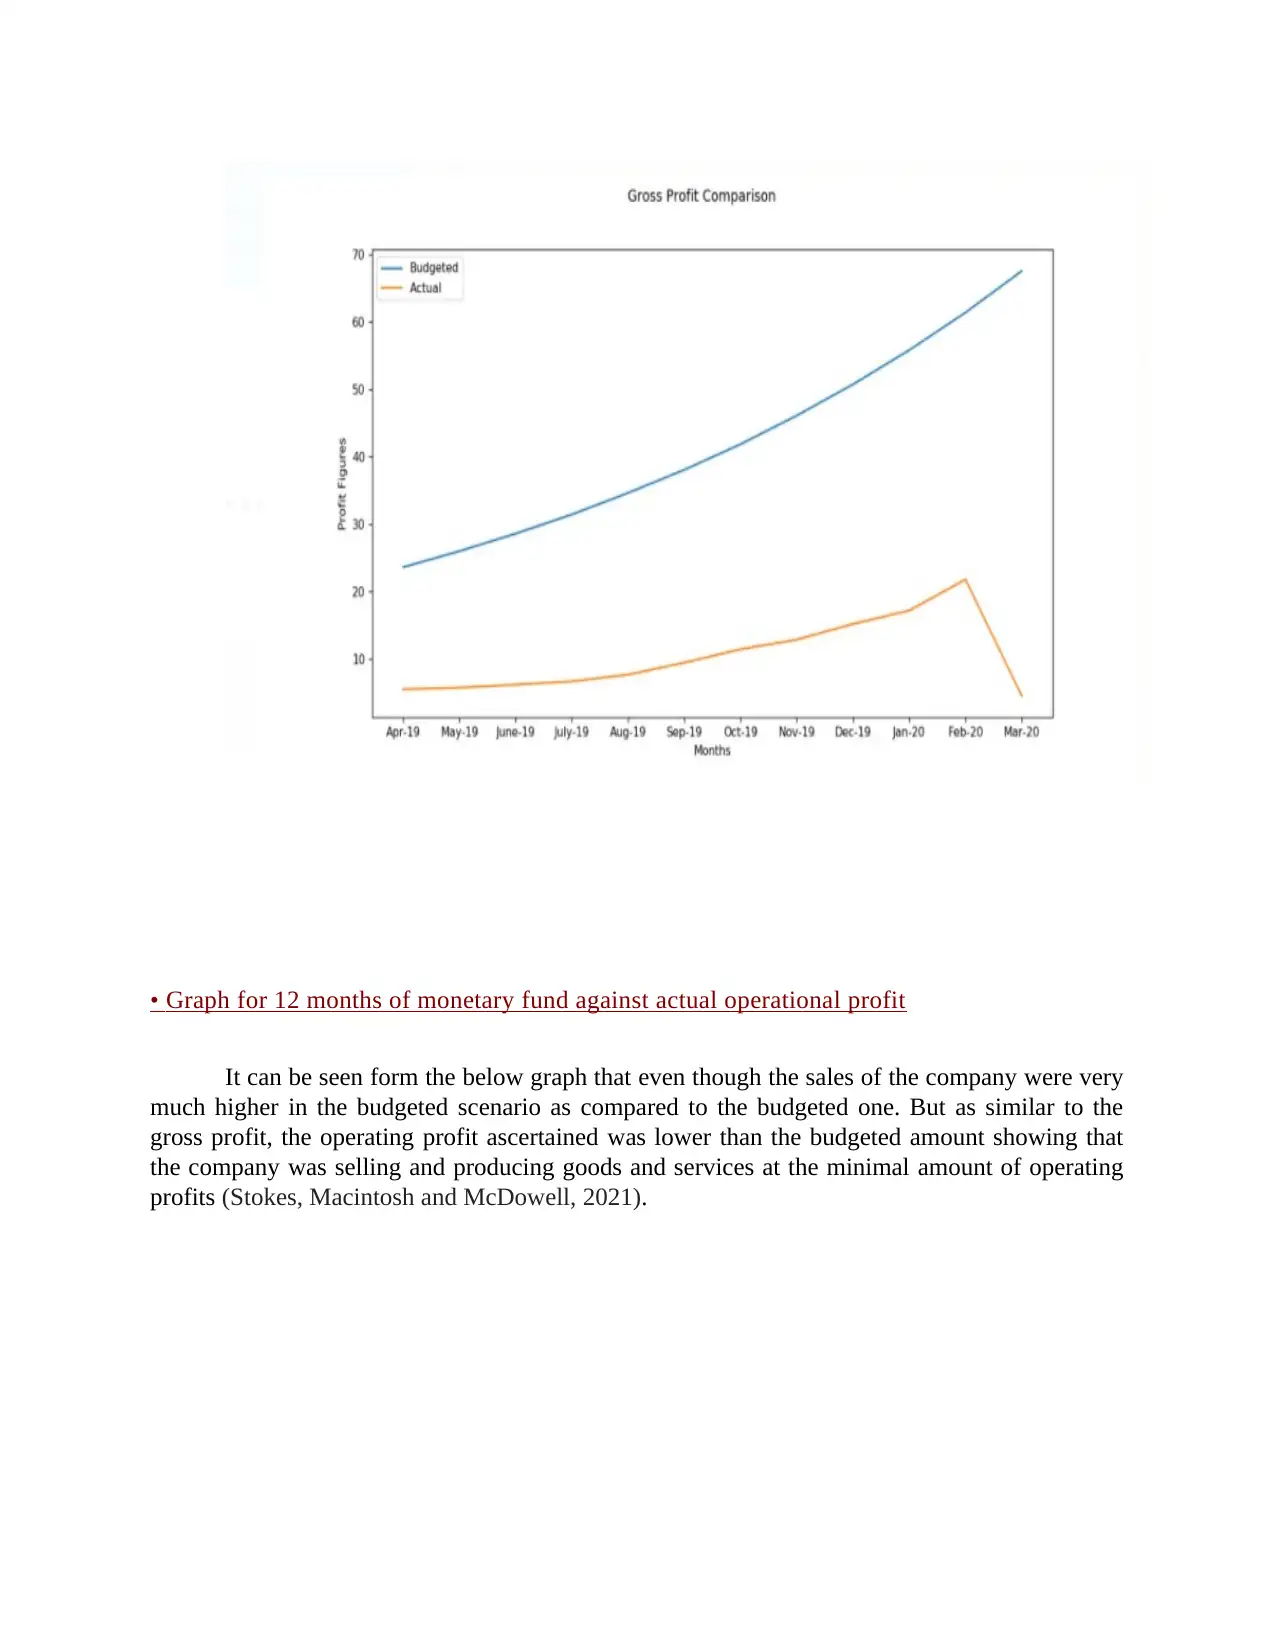
• Graph comparing Tweleve months of fund against actual gross profit.
It can be seen form the below graph that even though the sales of the company were very
much higher in the existent scenario as equivalence to the fund one (Desiderio, 2021). But the
gross profit ascertained was lower than the budgeted amount showing that the company was
selling and producing goods and services at the minimal profits.
It can be seen from the below line graph of actual and projected sale of the business
organization that in the beginning of the year the actual sales as compared to the
budgeted sales was lower till the mid-September and increased eventually in the month of
October. It can also be seen that there was a massive increase in the amount of the actual
sales which even surpassed the budgeted sales considerably resulting into higher sales for
the business along with higher returns (Allaoui, Bourgault and Pellerin, 2019).
• Graph comparing Tweleve months of fund against actual gross profit.
It can be seen form the below graph that even though the sales of the company were very
much higher in the existent scenario as equivalence to the fund one (Desiderio, 2021). But the
gross profit ascertained was lower than the budgeted amount showing that the company was
selling and producing goods and services at the minimal profits.
⊘ This is a preview!⊘
Do you want full access?
Subscribe today to unlock all pages.
Trusted by 1+ million students worldwide
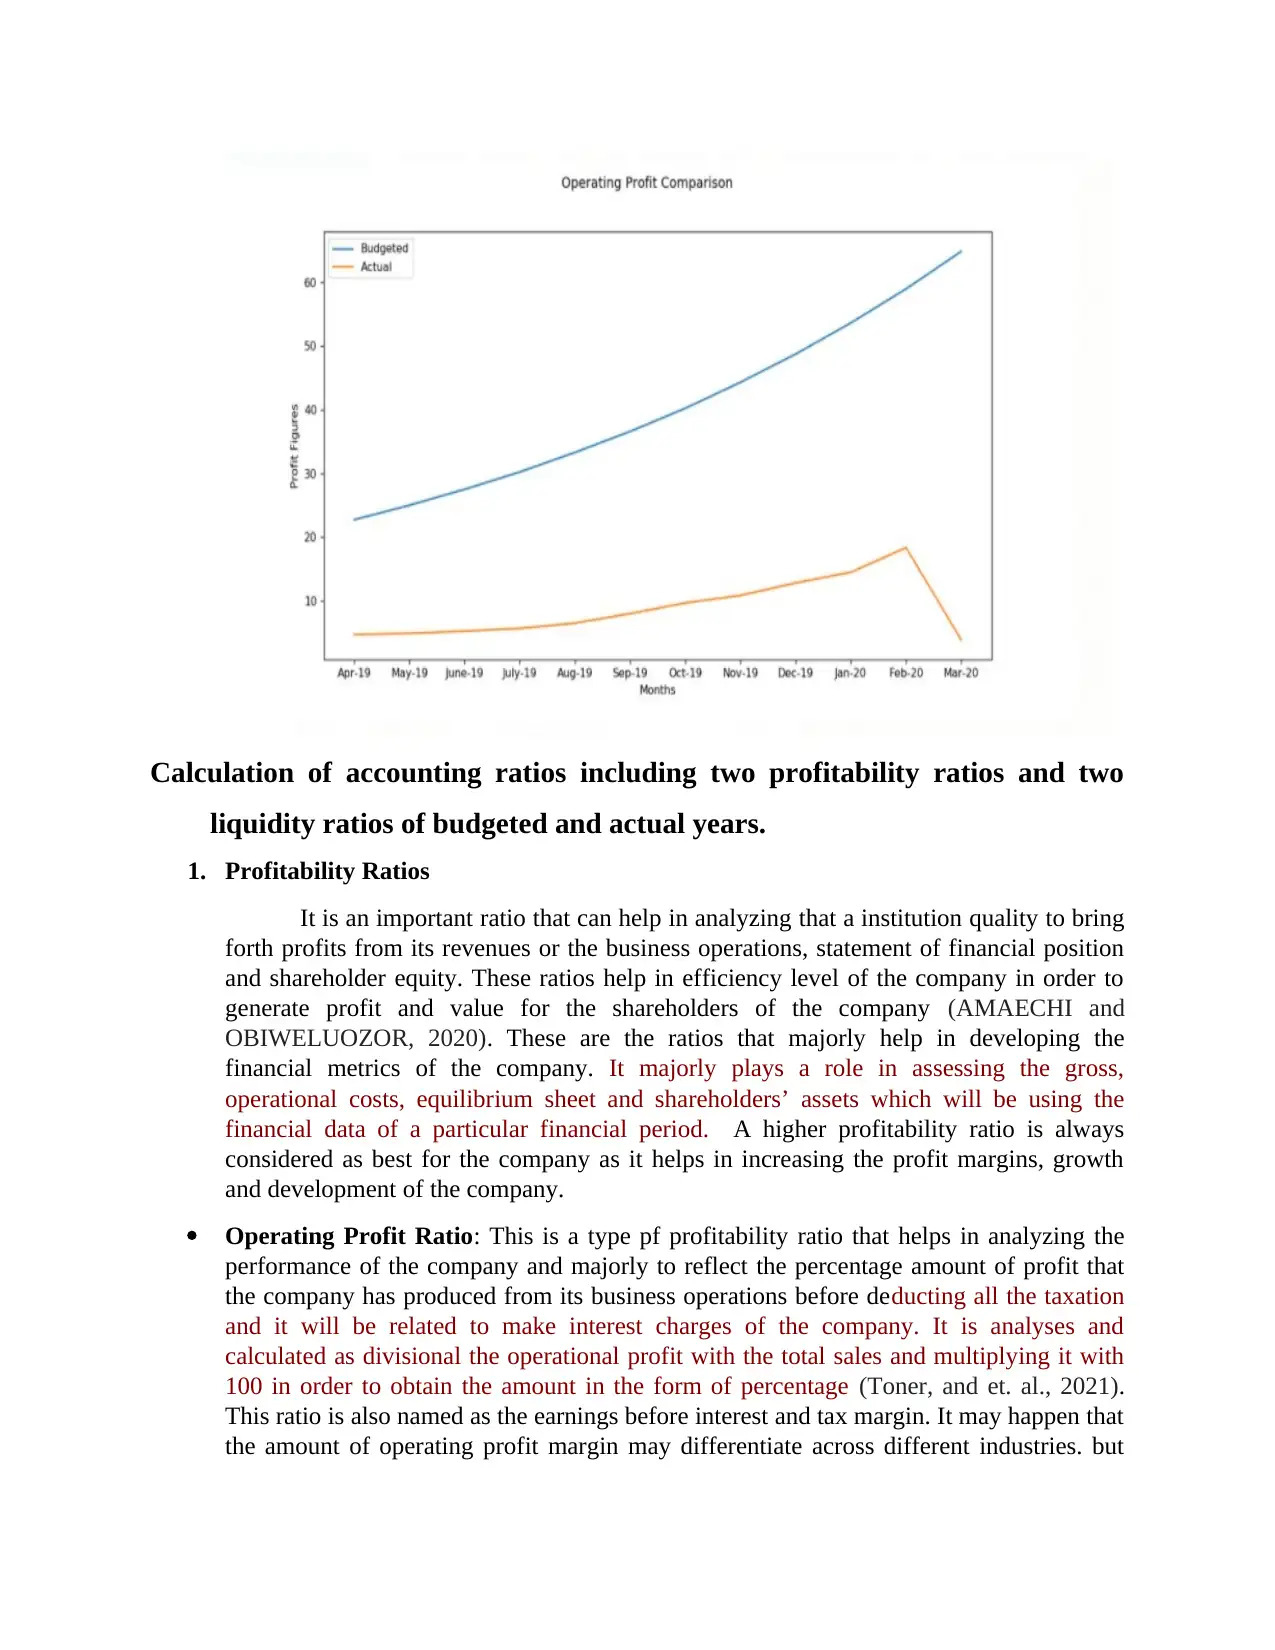
• Graph for 12 months of monetary fund against actual operational profit
It can be seen form the below graph that even though the sales of the company were very
much higher in the budgeted scenario as compared to the budgeted one. But as similar to the
gross profit, the operating profit ascertained was lower than the budgeted amount showing that
the company was selling and producing goods and services at the minimal amount of operating
profits (Stokes, Macintosh and McDowell, 2021).
Paraphrase This Document
Need a fresh take? Get an instant paraphrase of this document with our AI Paraphraser
Calculation of accounting ratios including two profitability ratios and two
liquidity ratios of budgeted and actual years.
1. Profitability Ratios
It is an important ratio that can help in analyzing that a institution quality to bring
forth profits from its revenues or the business operations, statement of financial position
and shareholder equity. These ratios help in efficiency level of the company in order to
generate profit and value for the shareholders of the company (AMAECHI and
OBIWELUOZOR, 2020). These are the ratios that majorly help in developing the
financial metrics of the company. It majorly plays a role in assessing the gross,
operational costs, equilibrium sheet and shareholders’ assets which will be using the
financial data of a particular financial period. A higher profitability ratio is always
considered as best for the company as it helps in increasing the profit margins, growth
and development of the company.
Operating Profit Ratio: This is a type pf profitability ratio that helps in analyzing the
performance of the company and majorly to reflect the percentage amount of profit that
the company has produced from its business operations before deducting all the taxation
and it will be related to make interest charges of the company. It is analyses and
calculated as divisional the operational profit with the total sales and multiplying it with
100 in order to obtain the amount in the form of percentage (Toner, and et. al., 2021).
This ratio is also named as the earnings before interest and tax margin. It may happen that
the amount of operating profit margin may differentiate across different industries. but
this ratio also helps in revealing the top and best performers in an industry in accordance
to indicating the need for further development.
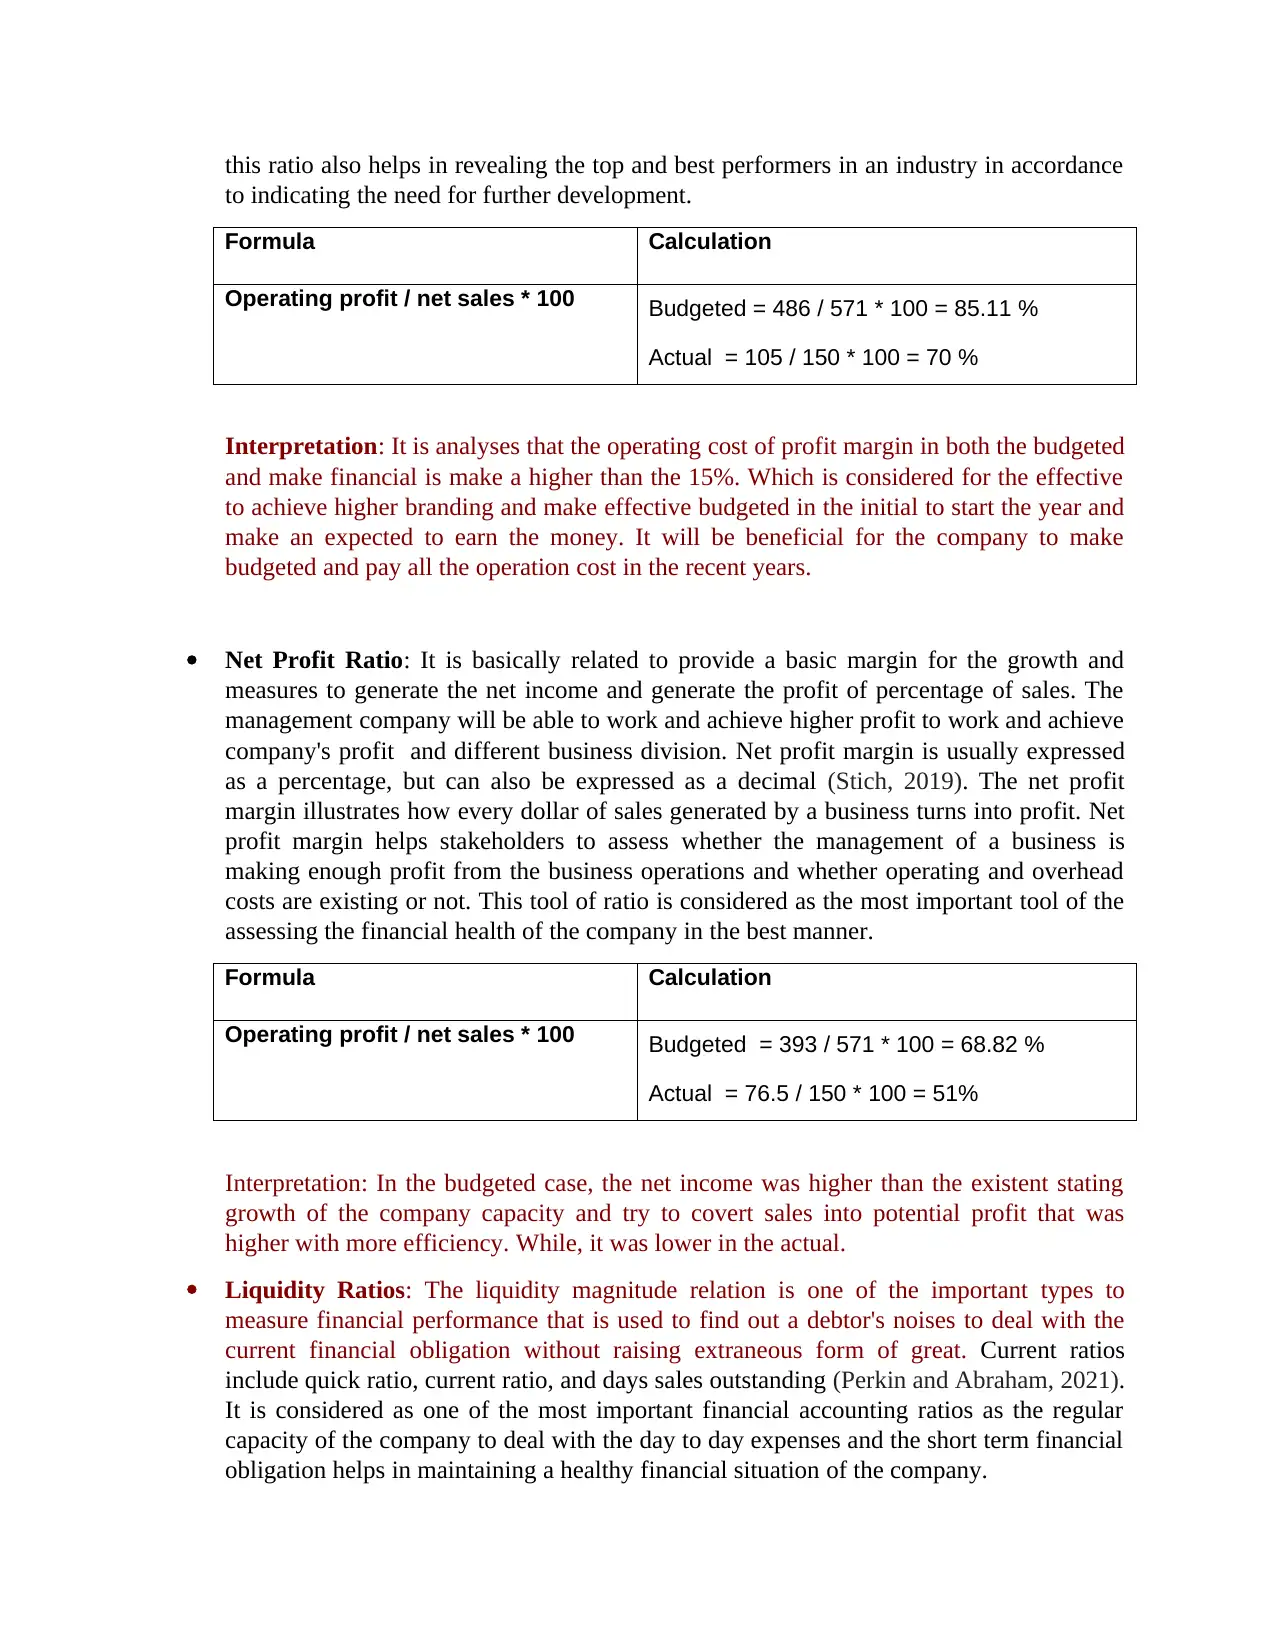
Formula Calculation
Operating profit / net sales * 100 Budgeted = 486 / 571 * 100 = 85.11 %
Actual = 105 / 150 * 100 = 70 %
Interpretation: It is analyses that the operating cost of profit margin in both the budgeted
and make financial is make a higher than the 15%. Which is considered for the effective
to achieve higher branding and make effective budgeted in the initial to start the year and
make an expected to earn the money. It will be beneficial for the company to make
budgeted and pay all the operation cost in the recent years.
Net Profit Ratio: It is basically related to provide a basic margin for the growth and
measures to generate the net income and generate the profit of percentage of sales. The
management company will be able to work and achieve higher profit to work and achieve
company's profit and different business division. Net profit margin is usually expressed
as a percentage, but can also be expressed as a decimal (Stich, 2019). The net profit
margin illustrates how every dollar of sales generated by a business turns into profit. Net
profit margin helps stakeholders to assess whether the management of a business is
making enough profit from the business operations and whether operating and overhead
costs are existing or not. This tool of ratio is considered as the most important tool of the
assessing the financial health of the company in the best manner.
Formula Calculation
Operating profit / net sales * 100 Budgeted = 393 / 571 * 100 = 68.82 %
Actual = 76.5 / 150 * 100 = 51%
Interpretation: In the budgeted case, the net income was higher than the existent stating
growth of the company capacity and try to covert sales into potential profit that was
higher with more efficiency. While, it was lower in the actual.
Liquidity Ratios: The liquidity magnitude relation is one of the important types to
measure financial performance that is used to find out a debtor's noises to deal with the
current financial obligation without raising extraneous form of great. Current ratios
include quick ratio, current ratio, and days sales outstanding (Perkin and Abraham, 2021).
It is considered as one of the most important financial accounting ratios as the regular
capacity of the company to deal with the day to day expenses and the short term financial
obligation helps in maintaining a healthy financial situation of the company.
to indicating the need for further development.
Formula Calculation
Operating profit / net sales * 100 Budgeted = 486 / 571 * 100 = 85.11 %
Actual = 105 / 150 * 100 = 70 %
Interpretation: It is analyses that the operating cost of profit margin in both the budgeted
and make financial is make a higher than the 15%. Which is considered for the effective
to achieve higher branding and make effective budgeted in the initial to start the year and
make an expected to earn the money. It will be beneficial for the company to make
budgeted and pay all the operation cost in the recent years.
Net Profit Ratio: It is basically related to provide a basic margin for the growth and
measures to generate the net income and generate the profit of percentage of sales. The
management company will be able to work and achieve higher profit to work and achieve
company's profit and different business division. Net profit margin is usually expressed
as a percentage, but can also be expressed as a decimal (Stich, 2019). The net profit
margin illustrates how every dollar of sales generated by a business turns into profit. Net
profit margin helps stakeholders to assess whether the management of a business is
making enough profit from the business operations and whether operating and overhead
costs are existing or not. This tool of ratio is considered as the most important tool of the
assessing the financial health of the company in the best manner.
Formula Calculation
Operating profit / net sales * 100 Budgeted = 393 / 571 * 100 = 68.82 %
Actual = 76.5 / 150 * 100 = 51%
Interpretation: In the budgeted case, the net income was higher than the existent stating
growth of the company capacity and try to covert sales into potential profit that was
higher with more efficiency. While, it was lower in the actual.
Liquidity Ratios: The liquidity magnitude relation is one of the important types to
measure financial performance that is used to find out a debtor's noises to deal with the
current financial obligation without raising extraneous form of great. Current ratios
include quick ratio, current ratio, and days sales outstanding (Perkin and Abraham, 2021).
It is considered as one of the most important financial accounting ratios as the regular
capacity of the company to deal with the day to day expenses and the short term financial
obligation helps in maintaining a healthy financial situation of the company.
⊘ This is a preview!⊘
Do you want full access?
Subscribe today to unlock all pages.
Trusted by 1+ million students worldwide
1 out of 14
Related Documents


Your All-in-One AI-Powered Toolkit for Academic Success.
+13062052269
info@desklib.com
Available 24*7 on WhatsApp / Email
![[object Object]](/_next/static/media/star-bottom.7253800d.svg)
Unlock your academic potential
Copyright © 2020–2026 A2Z Services. All Rights Reserved. Developed and managed by ZUCOL.