BPL 011: Comprehensive Analysis of Budgeted vs. Actual Finances

Verified

Added on  2022/12/09

|20
|2277
|499
Report
AI Summary
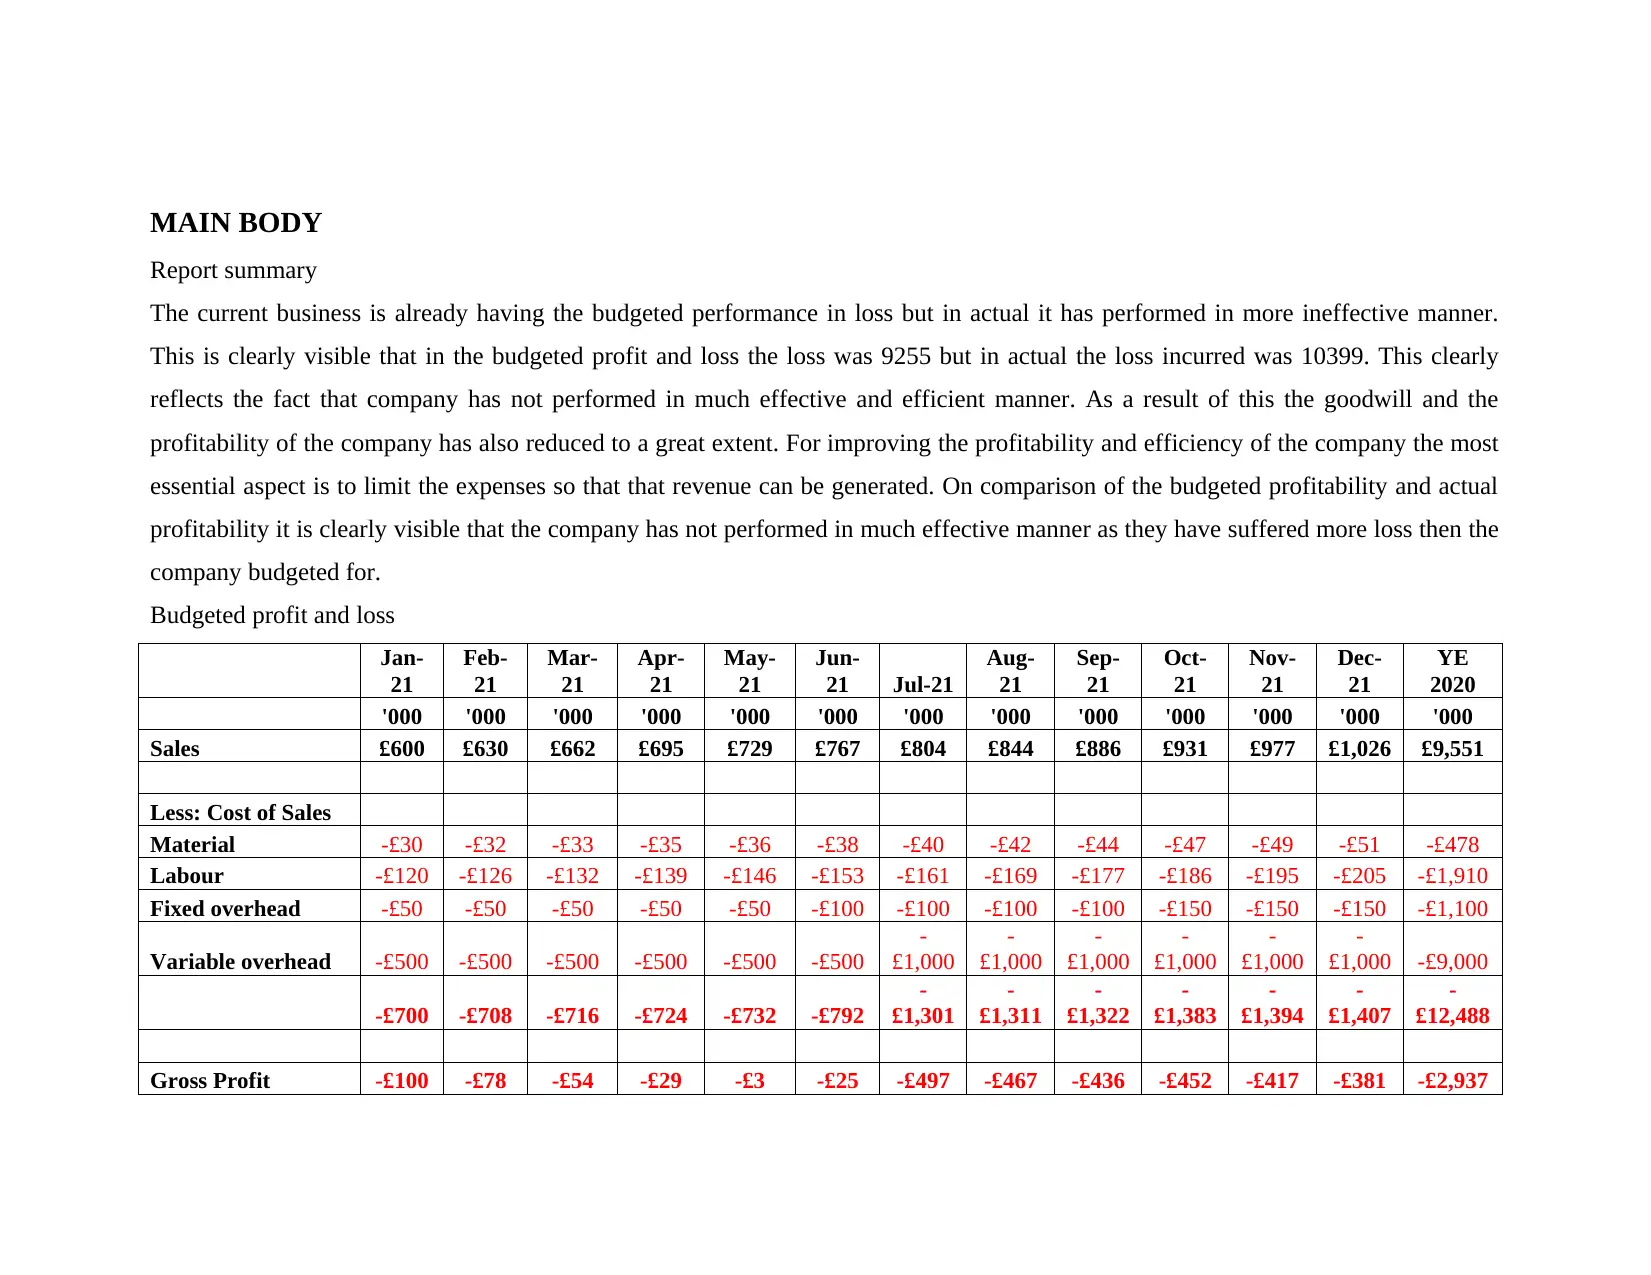
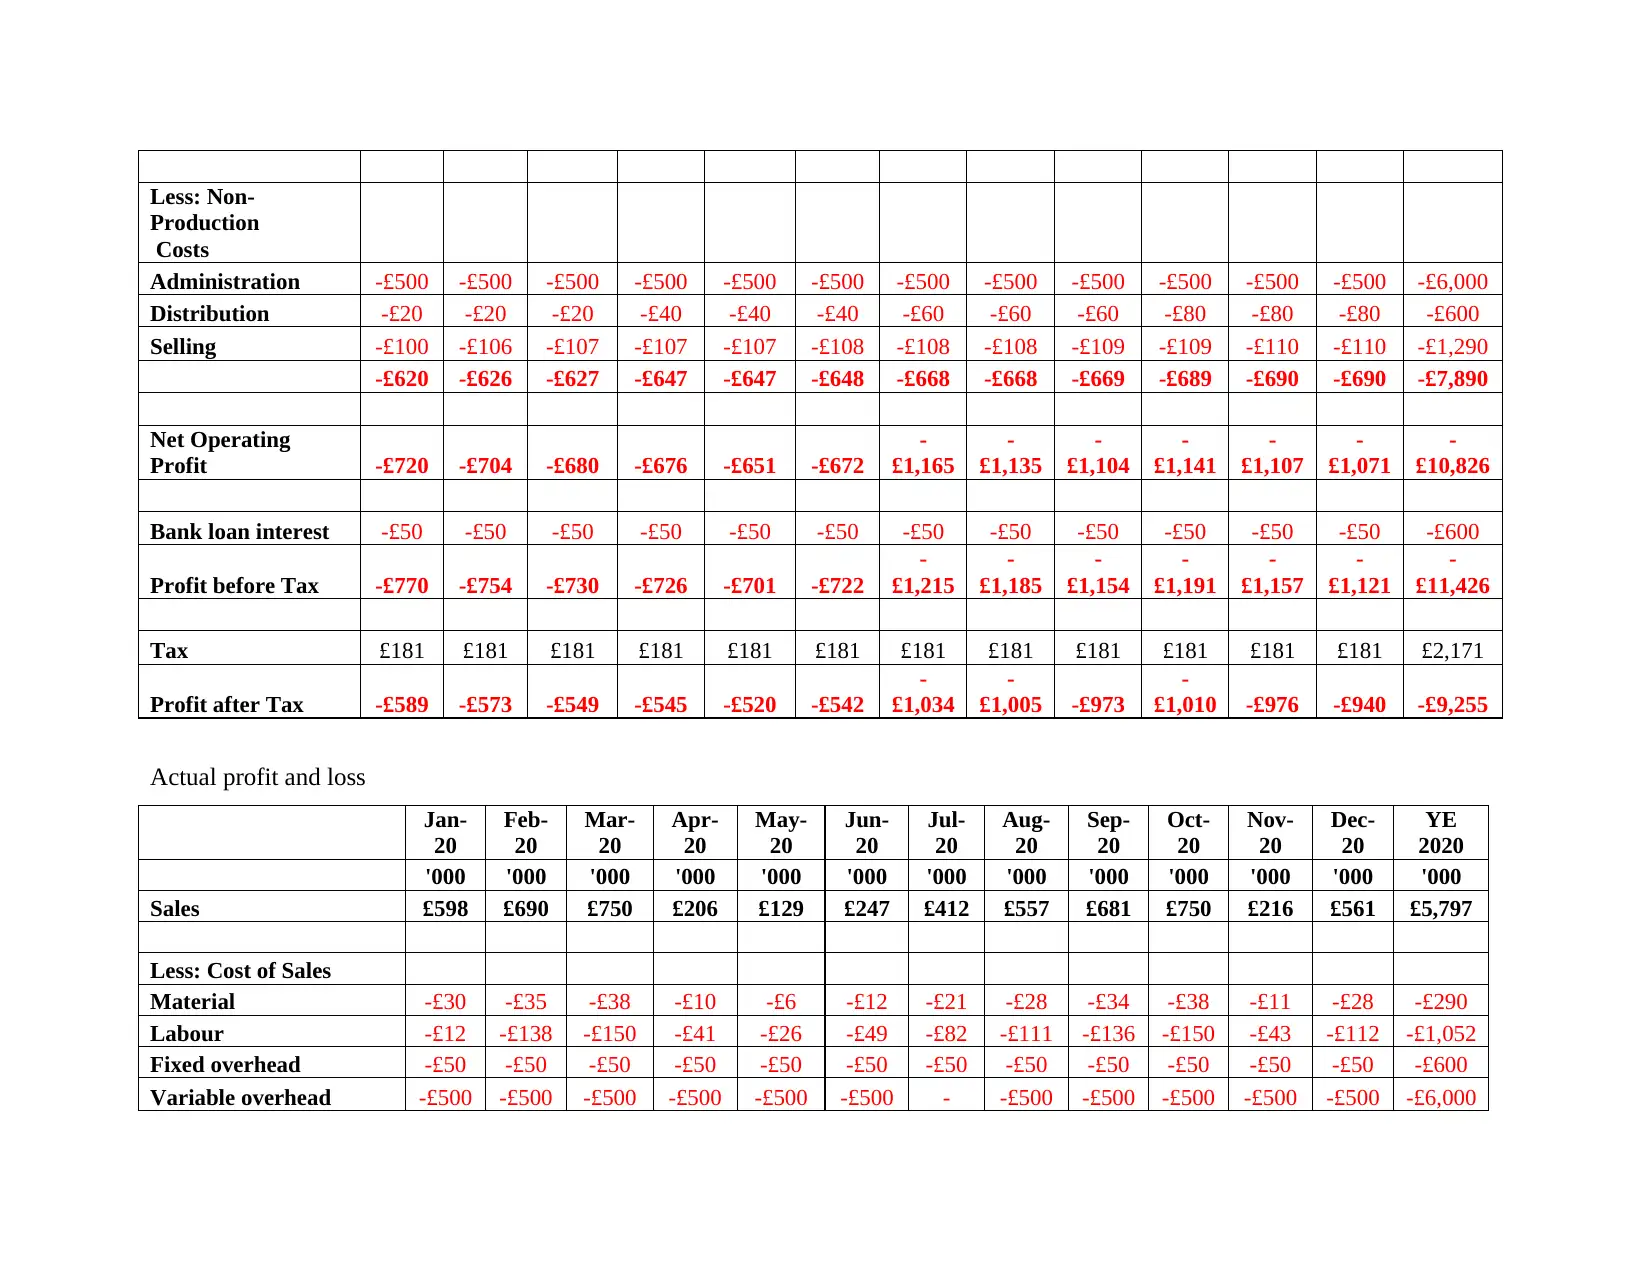
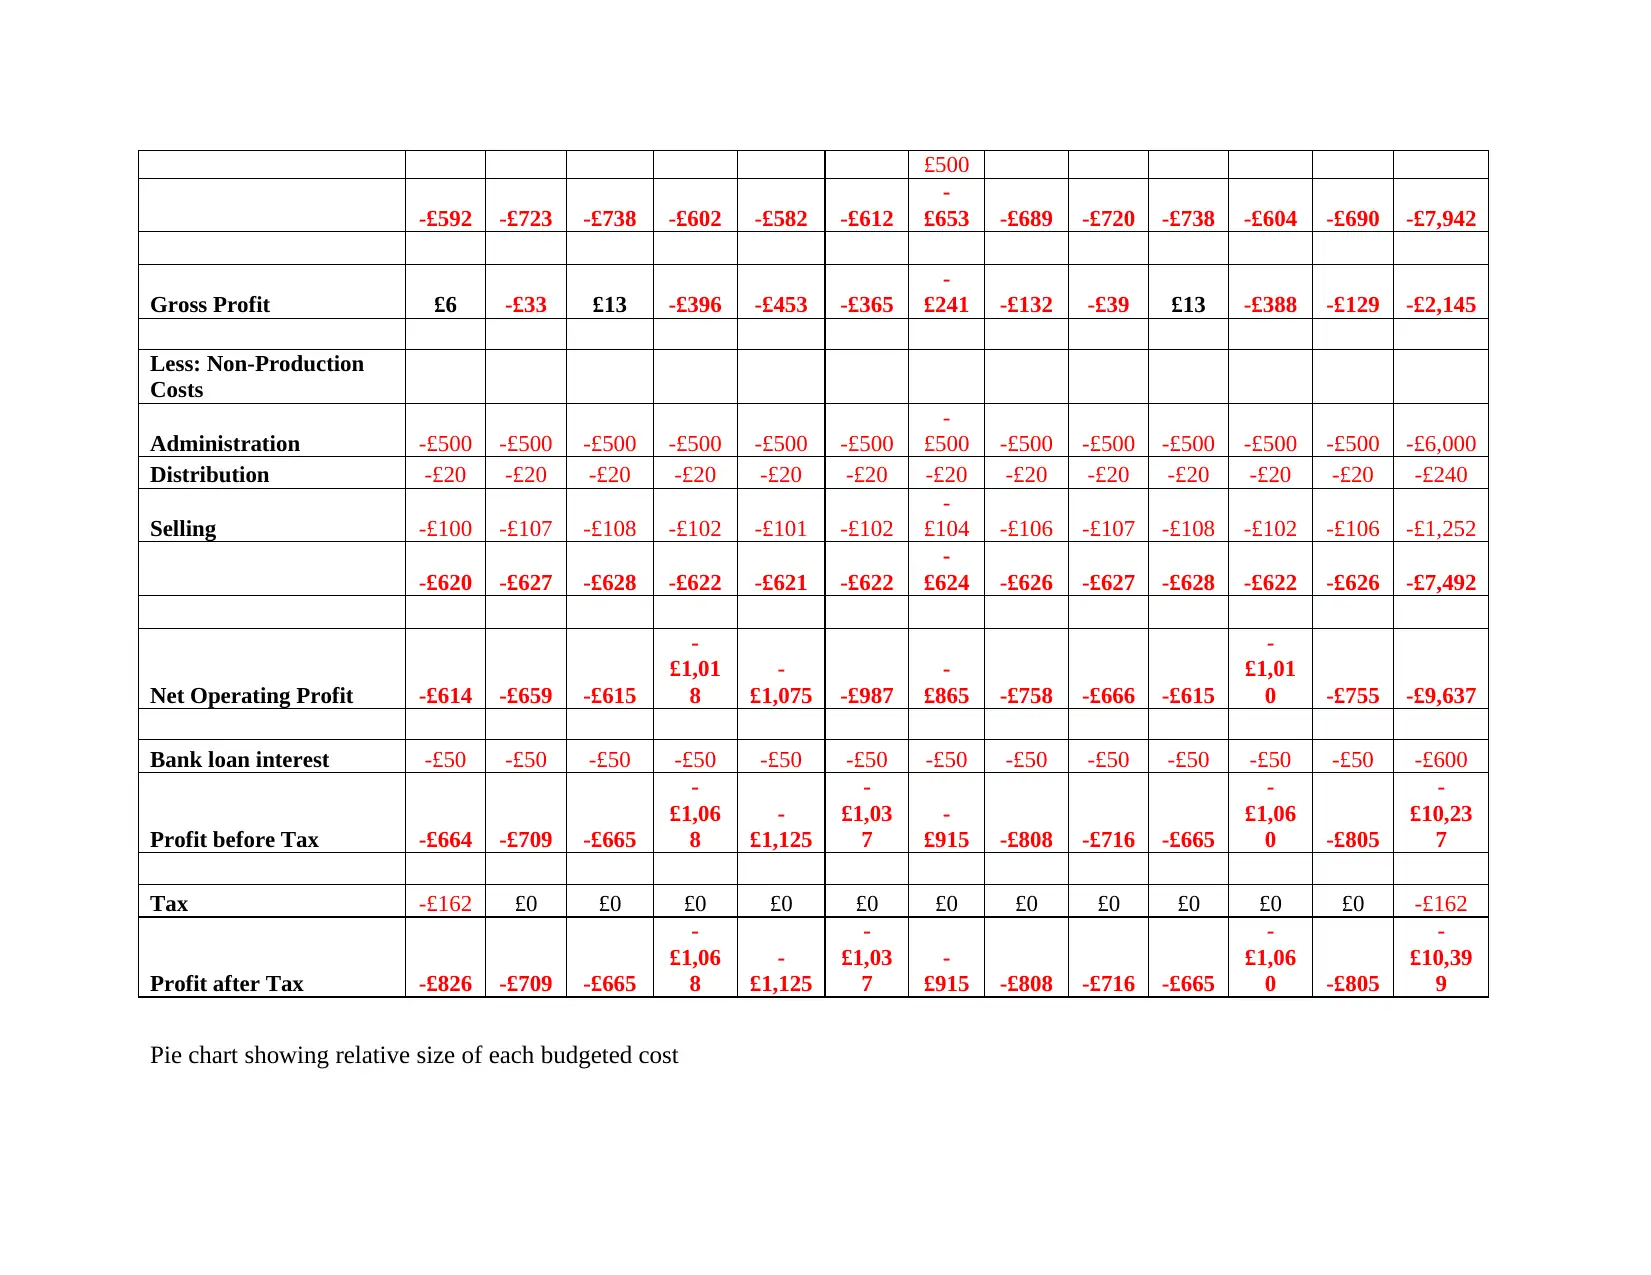
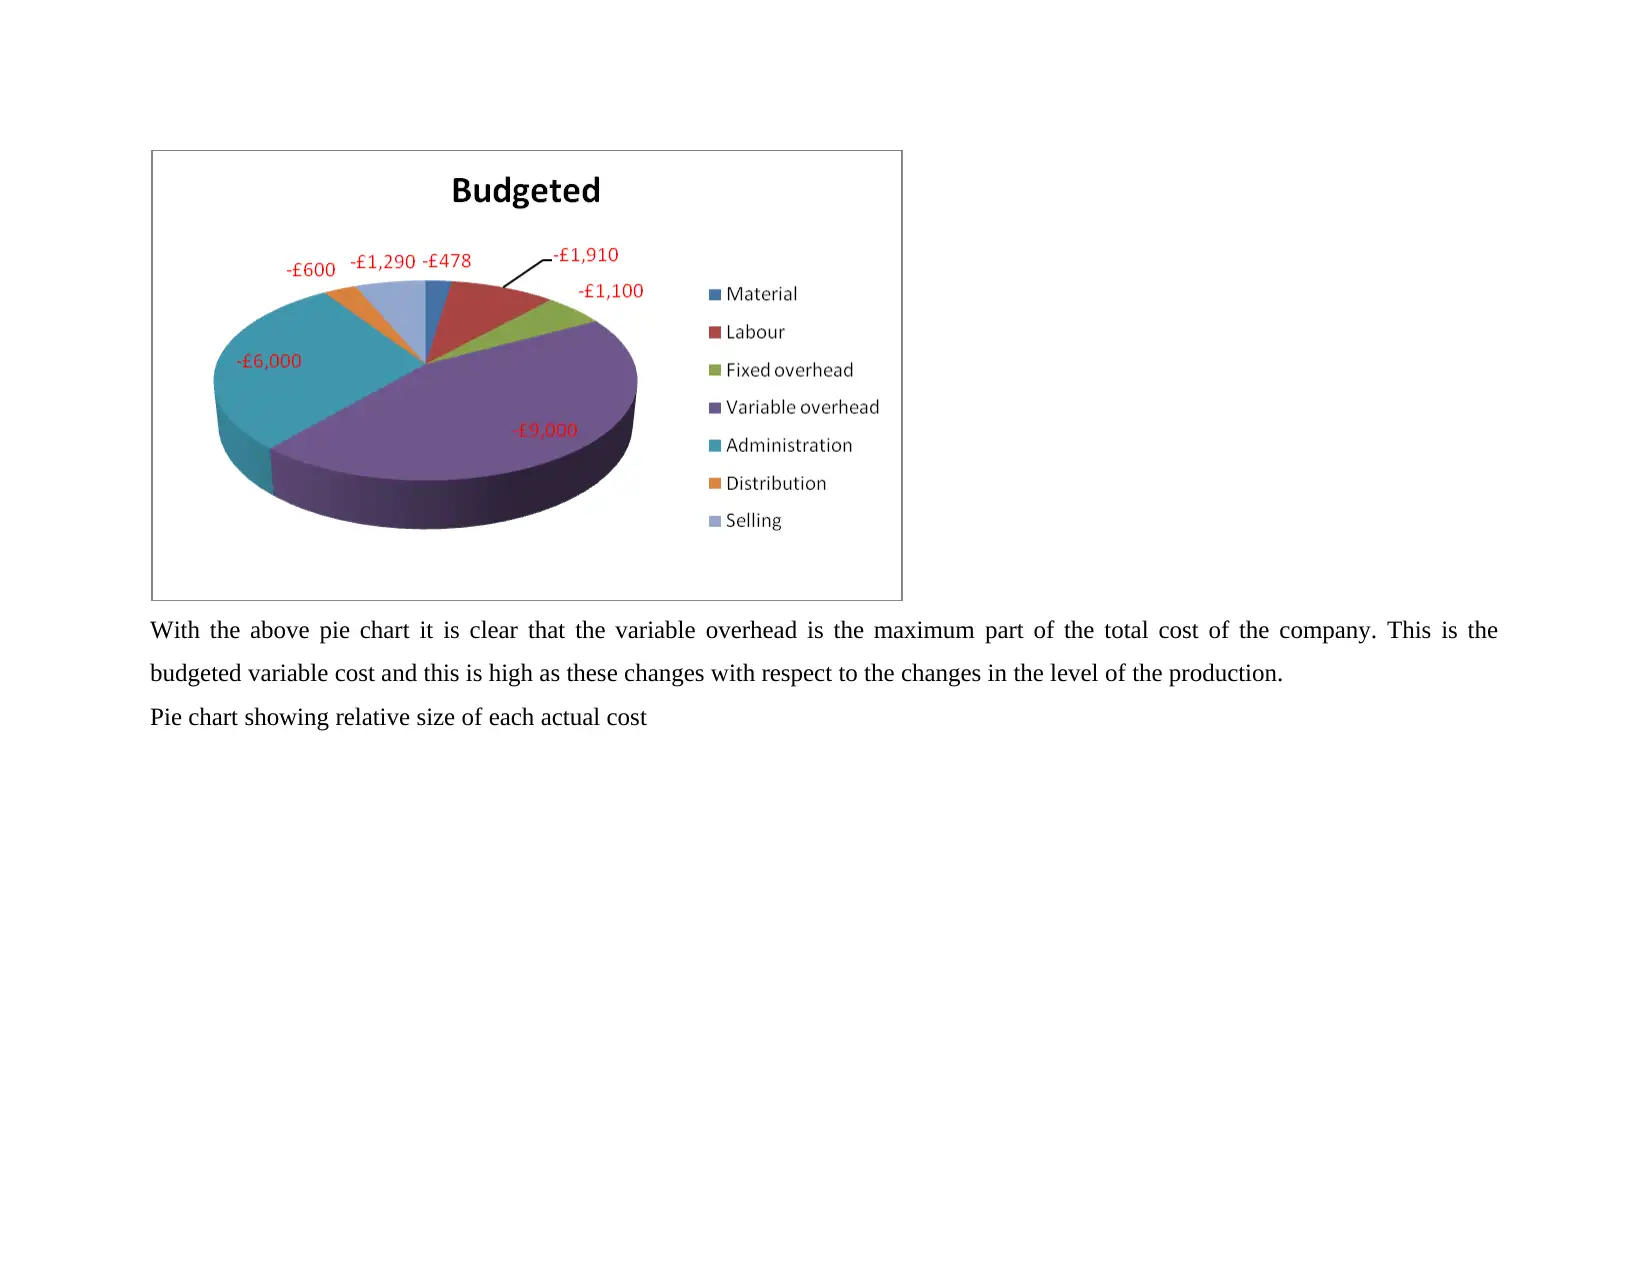
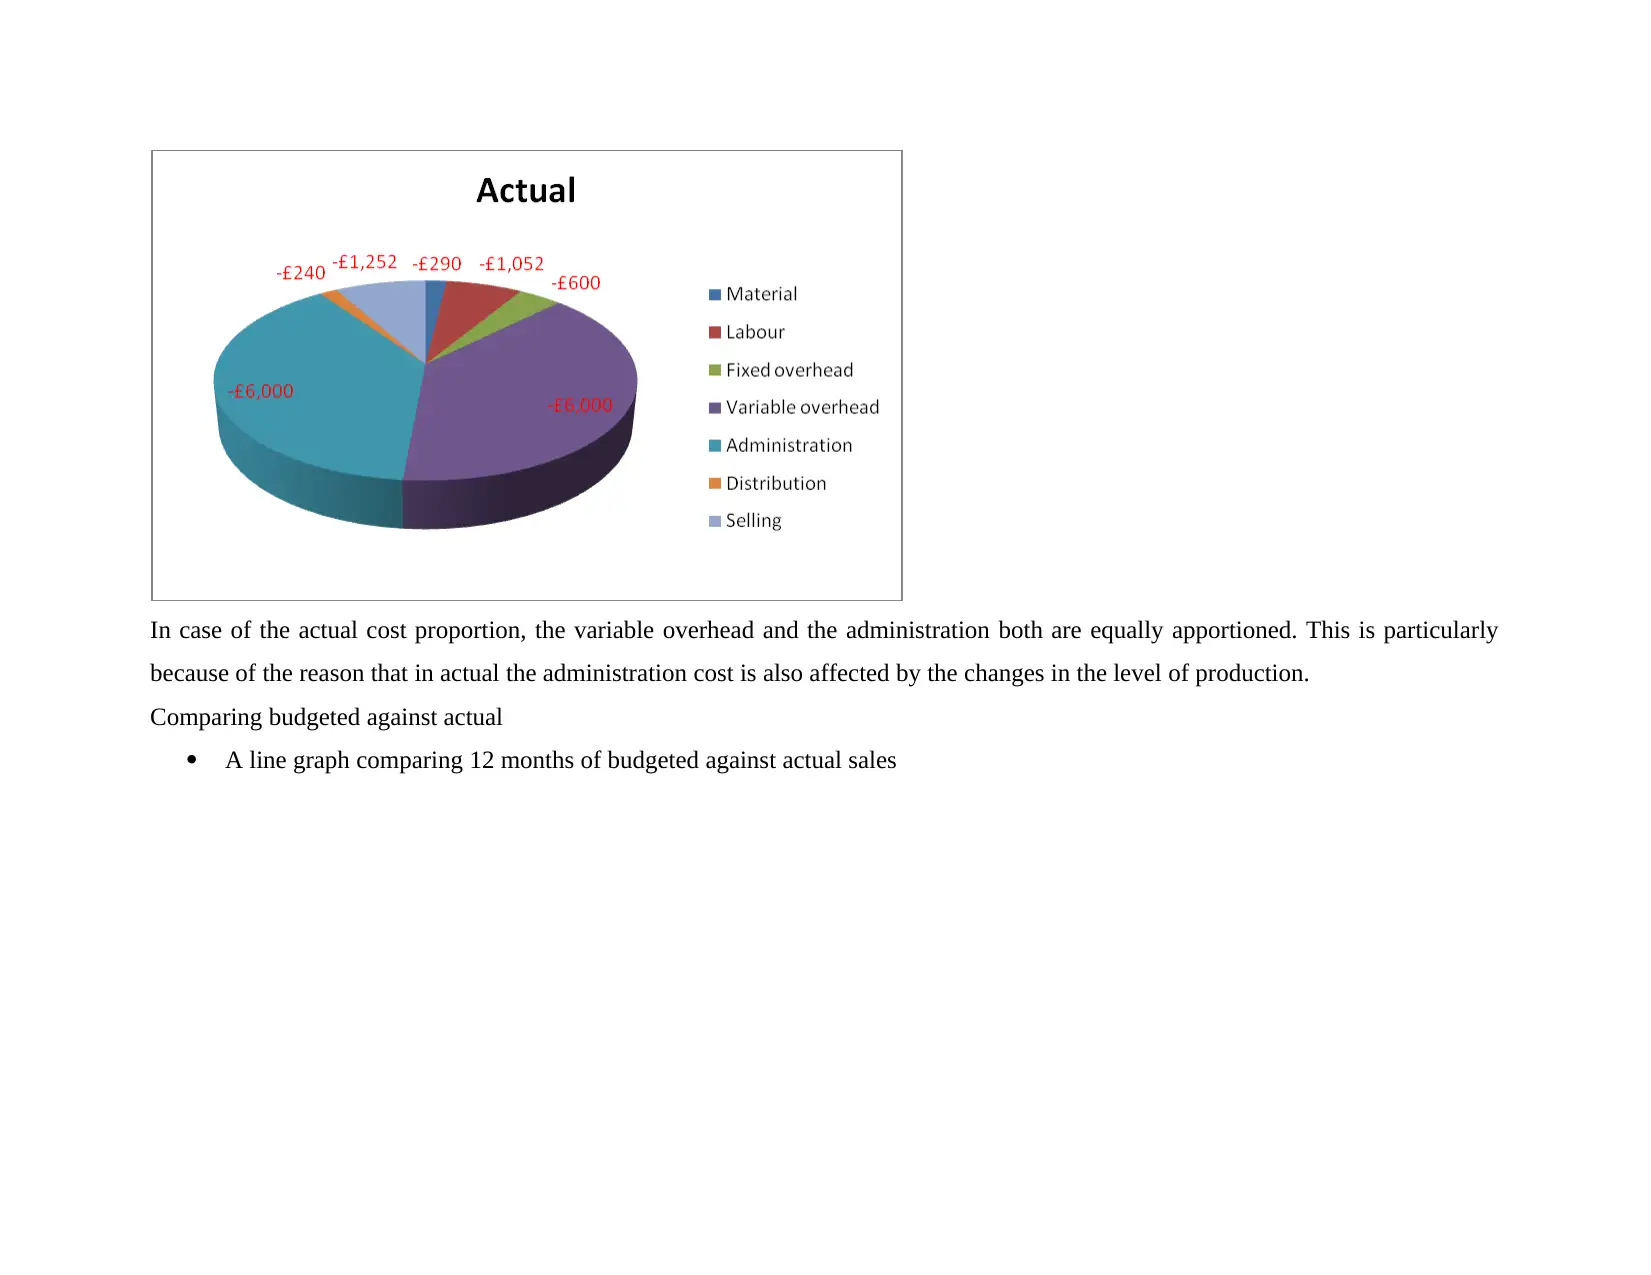
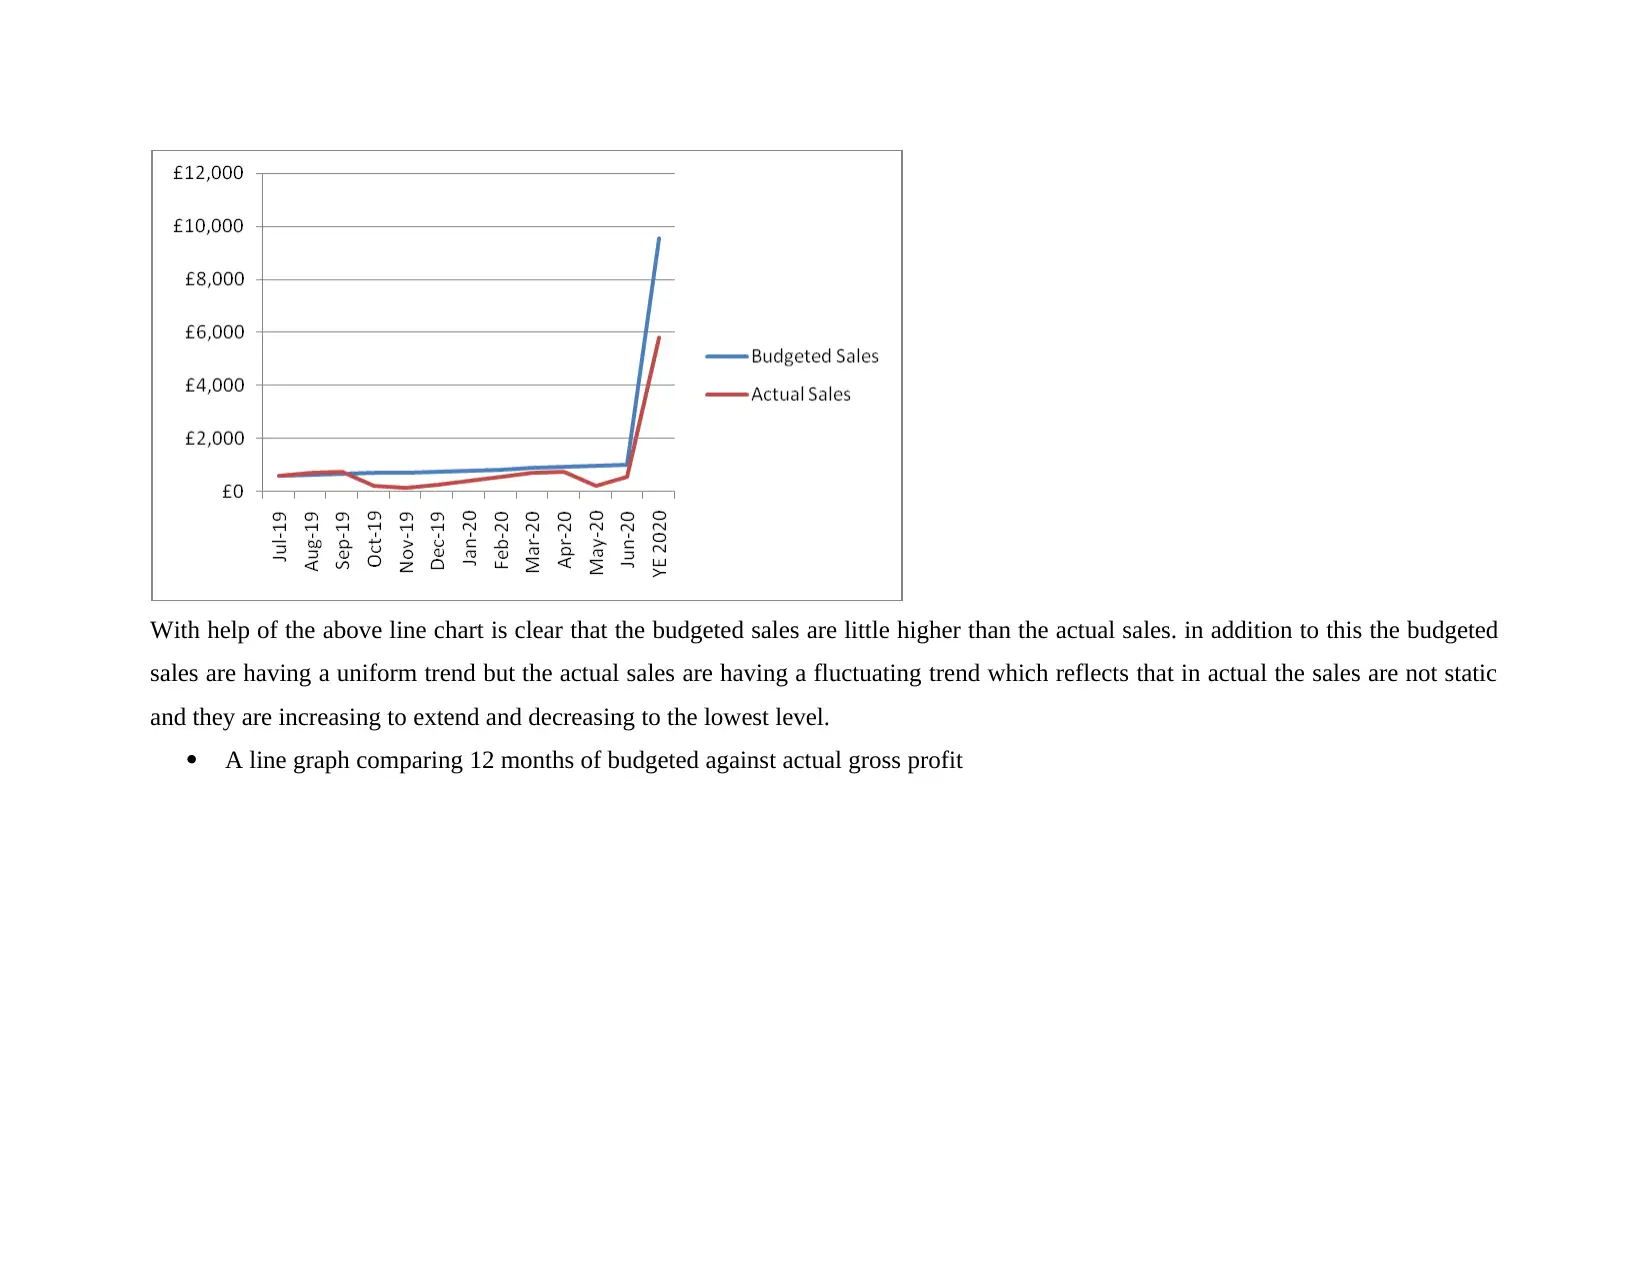
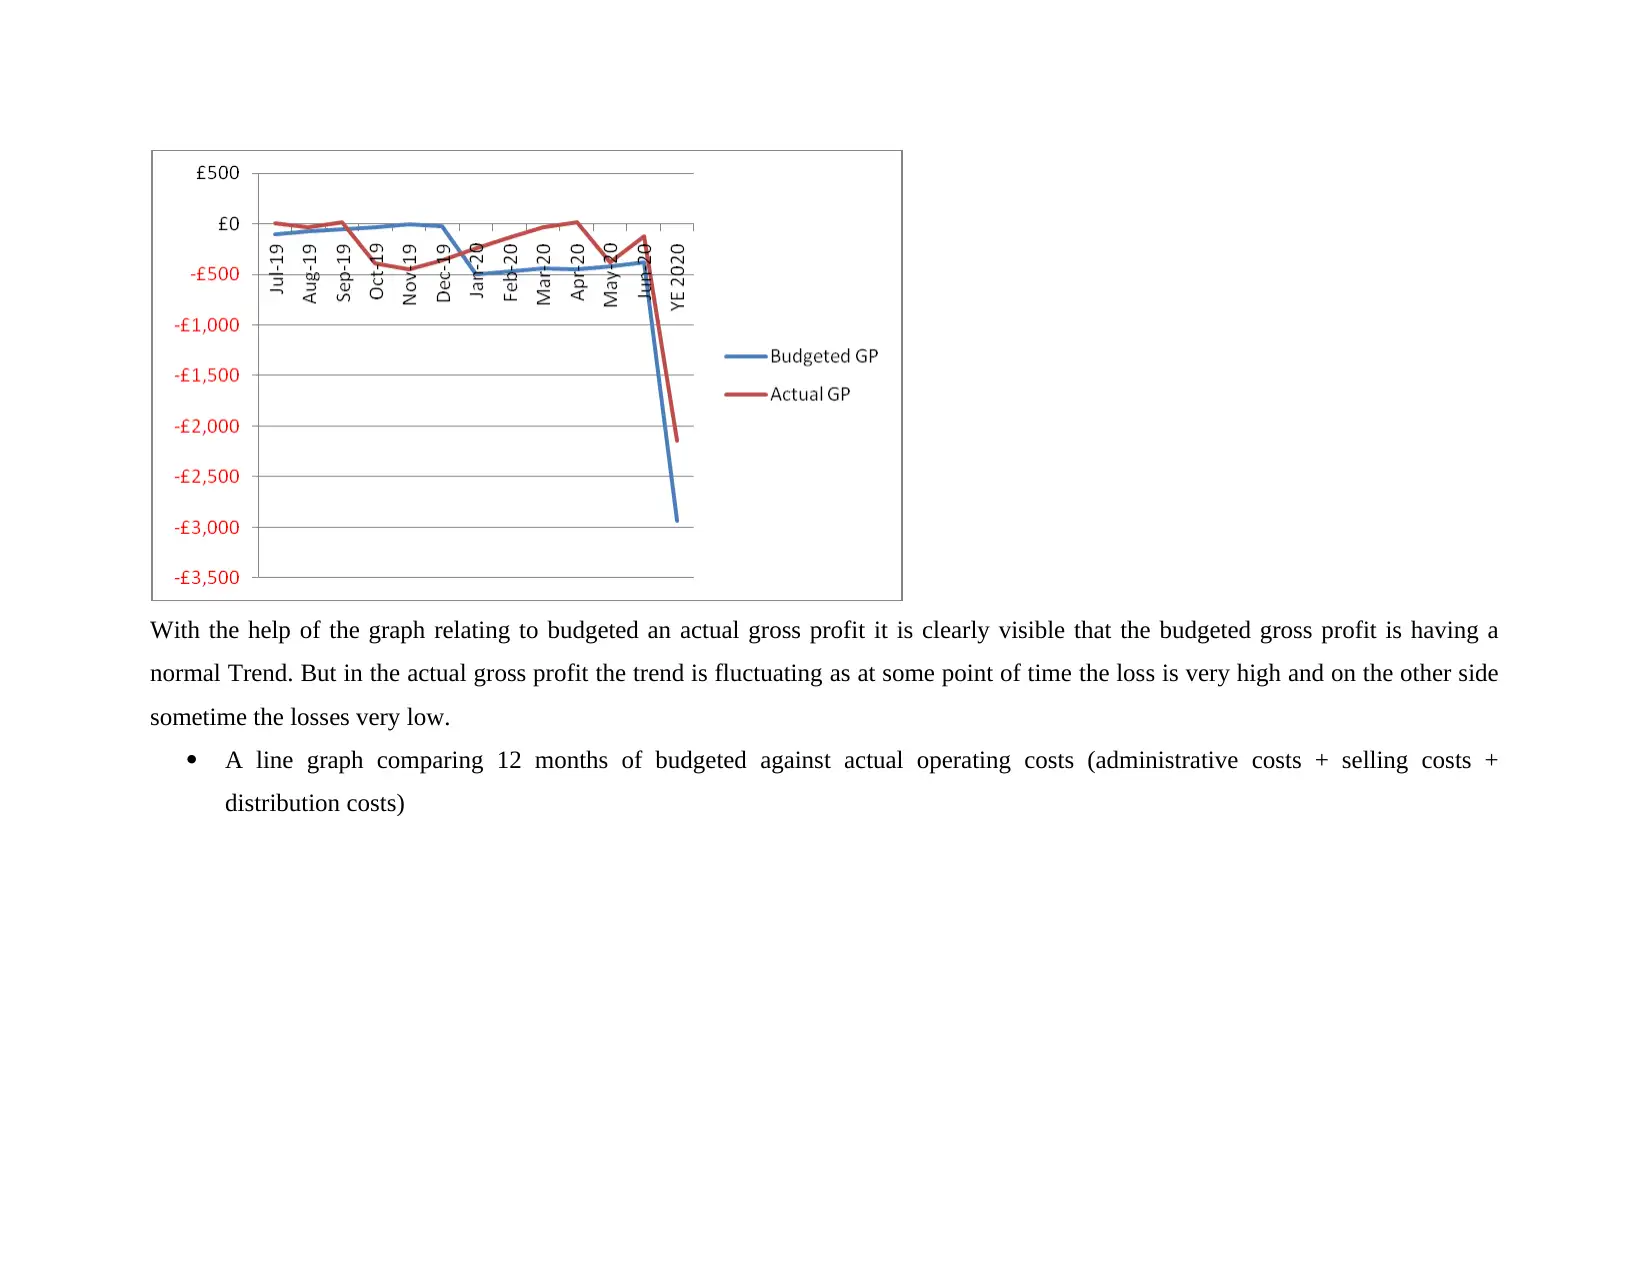
This report provides a detailed analysis of the financial performance of a business, comparing budgeted figures with actual results. The report highlights that the actual performance was less effective than the budgeted performance, resulting in higher losses. It includes an analysis of profit and loss statements, comparing sales, cost of sales, and non-production costs. The report uses pie charts and line graphs to visualize cost breakdowns and sales trends, and it evaluates variance in sales price and volume, direct materials, and labor. Financial ratios, including profitability, liquidity, and activity ratios, are calculated and analyzed to assess the company's financial health. The report also includes budgeted and actual balance sheets to provide a comprehensive view of the company's financial position, along with calculations of key financial ratios to evaluate performance. Overall, the analysis reveals areas where the company underperformed and provides insights into its financial strengths and weaknesses.
Document Page
BPL 011 [ONLINE EXAM]
tabler-icon-diamond-filled.svg

Secure Best Marks with AI Grader

Need help grading? Try our AI Grader for instant feedback on your assignments.
Document Page
TABLE OF CONTENTS
INTRODUCTION...........................................................................................................................4
MAIN BODY...................................................................................................................................4
CONCLUSION................................................................................................................................4
REFERENCES................................................................................................................................5
Document Page
MAIN BODY
Report summary
The current business is already having the budgeted performance in loss but in actual it has performed in more ineffective manner.
This is clearly visible that in the budgeted profit and loss the loss was 9255 but in actual the loss incurred was 10399. This clearly
reflects the fact that company has not performed in much effective and efficient manner. As a result of this the goodwill and the
profitability of the company has also reduced to a great extent. For improving the profitability and efficiency of the company the most
essential aspect is to limit the expenses so that that revenue can be generated. On comparison of the budgeted profitability and actual
profitability it is clearly visible that the company has not performed in much effective manner as they have suffered more loss then the
company budgeted for.
Budgeted profit and loss
Jan-
21
Feb-
21
Mar-
21
Apr-
21
May-
21
Jun-
21 Jul-21
Aug-
21
Sep-
21
Oct-
21
Nov-
21
Dec-
21
YE
2020
'000 '000 '000 '000 '000 '000 '000 '000 '000 '000 '000 '000 '000
Sales £600 £630 £662 £695 £729 £767 £804 £844 £886 £931 £977 £1,026 £9,551
Less: Cost of Sales
Material -£30 -£32 -£33 -£35 -£36 -£38 -£40 -£42 -£44 -£47 -£49 -£51 -£478
Labour -£120 -£126 -£132 -£139 -£146 -£153 -£161 -£169 -£177 -£186 -£195 -£205 -£1,910
Fixed overhead -£50 -£50 -£50 -£50 -£50 -£100 -£100 -£100 -£100 -£150 -£150 -£150 -£1,100
Variable overhead -£500 -£500 -£500 -£500 -£500 -£500
-
£1,000
-
£1,000
-
£1,000
-
£1,000
-
£1,000
-
£1,000 -£9,000
-£700 -£708 -£716 -£724 -£732 -£792
-
£1,301
-
£1,311
-
£1,322
-
£1,383
-
£1,394
-
£1,407
-
£12,488
Gross Profit -£100 -£78 -£54 -£29 -£3 -£25 -£497 -£467 -£436 -£452 -£417 -£381 -£2,937
Document Page
Less: Non-
Production
Costs
Administration -£500 -£500 -£500 -£500 -£500 -£500 -£500 -£500 -£500 -£500 -£500 -£500 -£6,000
Distribution -£20 -£20 -£20 -£40 -£40 -£40 -£60 -£60 -£60 -£80 -£80 -£80 -£600
Selling -£100 -£106 -£107 -£107 -£107 -£108 -£108 -£108 -£109 -£109 -£110 -£110 -£1,290
-£620 -£626 -£627 -£647 -£647 -£648 -£668 -£668 -£669 -£689 -£690 -£690 -£7,890
Net Operating
Profit -£720 -£704 -£680 -£676 -£651 -£672
-
£1,165
-
£1,135
-
£1,104
-
£1,141
-
£1,107
-
£1,071
-
£10,826
Bank loan interest -£50 -£50 -£50 -£50 -£50 -£50 -£50 -£50 -£50 -£50 -£50 -£50 -£600
Profit before Tax -£770 -£754 -£730 -£726 -£701 -£722
-
£1,215
-
£1,185
-
£1,154
-
£1,191
-
£1,157
-
£1,121
-
£11,426
Tax £181 £181 £181 £181 £181 £181 £181 £181 £181 £181 £181 £181 £2,171
Profit after Tax -£589 -£573 -£549 -£545 -£520 -£542
-
£1,034
-
£1,005 -£973
-
£1,010 -£976 -£940 -£9,255
Actual profit and loss
Jan-
20
Feb-
20
Mar-
20
Apr-
20
May-
20
Jun-
20
Jul-
20
Aug-
20
Sep-
20
Oct-
20
Nov-
20
Dec-
20
YE
2020
'000 '000 '000 '000 '000 '000 '000 '000 '000 '000 '000 '000 '000
Sales £598 £690 £750 £206 £129 £247 £412 £557 £681 £750 £216 £561 £5,797
Less: Cost of Sales
Material -£30 -£35 -£38 -£10 -£6 -£12 -£21 -£28 -£34 -£38 -£11 -£28 -£290
Labour -£12 -£138 -£150 -£41 -£26 -£49 -£82 -£111 -£136 -£150 -£43 -£112 -£1,052
Fixed overhead -£50 -£50 -£50 -£50 -£50 -£50 -£50 -£50 -£50 -£50 -£50 -£50 -£600
Variable overhead -£500 -£500 -£500 -£500 -£500 -£500 - -£500 -£500 -£500 -£500 -£500 -£6,000
tabler-icon-diamond-filled.svg

Secure Best Marks with AI Grader

Need help grading? Try our AI Grader for instant feedback on your assignments.
Document Page
£500
-£592 -£723 -£738 -£602 -£582 -£612
-
£653 -£689 -£720 -£738 -£604 -£690 -£7,942
Gross Profit £6 -£33 £13 -£396 -£453 -£365
-
£241 -£132 -£39 £13 -£388 -£129 -£2,145
Less: Non-Production
Costs
Administration -£500 -£500 -£500 -£500 -£500 -£500
-
£500 -£500 -£500 -£500 -£500 -£500 -£6,000
Distribution -£20 -£20 -£20 -£20 -£20 -£20 -£20 -£20 -£20 -£20 -£20 -£20 -£240
Selling -£100 -£107 -£108 -£102 -£101 -£102
-
£104 -£106 -£107 -£108 -£102 -£106 -£1,252
-£620 -£627 -£628 -£622 -£621 -£622
-
£624 -£626 -£627 -£628 -£622 -£626 -£7,492
Net Operating Profit -£614 -£659 -£615
-
£1,01
8
-
£1,075 -£987
-
£865 -£758 -£666 -£615
-
£1,01
0 -£755 -£9,637
Bank loan interest -£50 -£50 -£50 -£50 -£50 -£50 -£50 -£50 -£50 -£50 -£50 -£50 -£600
Profit before Tax -£664 -£709 -£665
-
£1,06
8
-
£1,125
-
£1,03
7
-
£915 -£808 -£716 -£665
-
£1,06
0 -£805
-
£10,23
7
Tax -£162 £0 £0 £0 £0 £0 £0 £0 £0 £0 £0 £0 -£162
Profit after Tax -£826 -£709 -£665
-
£1,06
8
-
£1,125
-
£1,03
7
-
£915 -£808 -£716 -£665
-
£1,06
0 -£805
-
£10,39
9
Pie chart showing relative size of each budgeted cost
Document Page
With the above pie chart it is clear that the variable overhead is the maximum part of the total cost of the company. This is the
budgeted variable cost and this is high as these changes with respect to the changes in the level of the production.
Pie chart showing relative size of each actual cost
Document Page
In case of the actual cost proportion, the variable overhead and the administration both are equally apportioned. This is particularly
because of the reason that in actual the administration cost is also affected by the changes in the level of production.
Comparing budgeted against actual
A line graph comparing 12 months of budgeted against actual sales
tabler-icon-diamond-filled.svg

Paraphrase This Document

Need a fresh take? Get an instant paraphrase of this document with our AI Paraphraser
Document Page
With help of the above line chart is clear that the budgeted sales are little higher than the actual sales. in addition to this the budgeted
sales are having a uniform trend but the actual sales are having a fluctuating trend which reflects that in actual the sales are not static
and they are increasing to extend and decreasing to the lowest level.
A line graph comparing 12 months of budgeted against actual gross profit
Document Page
With the help of the graph relating to budgeted an actual gross profit it is clearly visible that the budgeted gross profit is having a
normal Trend. But in the actual gross profit the trend is fluctuating as at some point of time the loss is very high and on the other side
sometime the losses very low.
A line graph comparing 12 months of budgeted against actual operating costs (administrative costs + selling costs +
distribution costs)
Document Page
With the help of the graph relating to the budgeted and actual operating cost that is combination of administrative selling and
distribution cost it is clearly visible that there is a difference between the budgeted and actual cost. On comparison it can be seen that
the actual cost is less than the budgeted cost.
A line graph comparing 12 months of budgeted against actual operating profit
tabler-icon-diamond-filled.svg

Secure Best Marks with AI Grader

Need help grading? Try our AI Grader for instant feedback on your assignments.
Document Page
Evaluation of the graph relating to budgeted an actual operating profit it is clearly visible that these are almost similar. There is a very
slight difference between the budgeted and the actual operating profit which means that the company was in position to attain the
budgeted
Cost variance
Sales price variance
Actual sales - standard revenue of actual units sold
actual sales 5797
standard revenue of actual units sold 9551
Sales price variance -3754
Sales volume variance
(actual units sold- budgeted units sales)* Standard contribution
actual units sold 5797
budgeted units sales 9551
Document Page
Standard contribution -100
Sales volume variance 375400
standard profit per unit
(actual units sold- Unit sales at standard mix)* standard profit per
unit
actual units sold 5797
Unit sales at standard mix 9551
standard profit per unit -520
standard profit per unit 1952080
Direct material variance
actual cost- standard cost
actual cost 15434
standard cost 20377
Direct material variance -4943
direct material usage variance
(actual quantity - standard quantity)* standard price
actual quantity 5797
standard quantity 9551
standard price -1
direct material usage variance 3754
direct material yield variance
(actual yield- standard yield)* standard material cost per unit
actual yield -10399
standard yield -9255
Document Page
standard material cost 0.1
direct material yield variance -114.4
Direct labor variance
direct labor rate variance
actual cost - standard of actual hours
actual cost 15434
standard of actual hours 20377
direct labor rate variance -4943
direct labor efficiency variance
standard cost of actual hours - standard cost
standard cost of actual hours 15434
standard cost 20377
direct labor efficiency variance -4943
Budgeted statement of financial position along with actual balance sheet
Particulars Budgeted Actual
non- current asset
factory equipment 440 400
office equipment 110 100
land and building 825 750
current asset
inventory 330 300
trade receivables 385 350
pre- payment 220 200
tabler-icon-diamond-filled.svg

Paraphrase This Document

Need a fresh take? Get an instant paraphrase of this document with our AI Paraphraser
Document Page
cash 825 750
accrued income 165 150
total asset 3300 3000
equity
retained earning 2145 1950
share capital 110 100
non- current liabilities
directors loan 55 50
5 year bank loan 165 150
current liabilities
credit card 27.5 25
accruals 275 250
trade payables 330 300
deferred income 192.5 175
total equity and liabilities 3300 3000
The above statement is the budgeted and the actual financial position of the company. This involves all the asset and liabilities of the
company and this provides an idea to the company that how they can manage their capital in order to increase the sales and revenue of
the company. Also, this balance sheet assist the company in evaluating the asset and how it can be used in order to pay off the
liabilities of the company.
Calculation of ratios
4 profitability ratio calculations for both budgeted and actual years
Document Page
Profitability ratio analysis
Budgeted Actual
Gross Profit -2887 -2145
Net profit -9215 -10399
Sales revenue 9551 5797
Earnings before interest and tax
or operating profit -10776 -9637
Capital employed 2250 2250
Net income -9215 -10399
Average total assets 3000 3000
GP ratio Gross profit / sales * 100 -30% -37%
NP ratio Net profit / sales * 100 -96% -179%
Return on capital employed EBIT / capital employed
-
4.789333 -4.2831
Return on assets Net income / average total assets
-
3.071667 -3.4663
With help of the profitability ratio analysis it can be analysed that if the budgeted performance is a little better as compared to the
actual performance. With help of the net profit ratio can be seen that budgeted net profit is - 96 % but the actual is -1 79% full stop
with this is clearly visible that the positive performance that is the standard performance is good in comparison to the actual
performance. Similarly in case of the gross profit ratio is well the budgeted GP ratio was -30% whereas the actual was - 37% to stop
this clearly reflects that the budgeted to gross profit ratio is better in comparison to the actual gross profit ratio.
2 liquidity ratio calculations for both year start and year end
Liquidity ratio analysis
Budgeted Actual
Current assets 1925 1750
Current liabilities 825 750
Document Page
Inventory 330 300
Prepaid expenses 220 200
Quick assets 1375 1250
Current ratio Current assets / current liabilities 2.333333 2.33333
Quick ratio
Current assets - (stock + prepaid
expenses) 1.666667 1.66667
With help of the liquidity ratio it is clearly visible that the current ratio for both the budgeted and actual performance is 2.33 that is
2.33: 1. With help of this it can be seen that accompanies having 2.3 times the current asset for every liability to be paid off. As per the
ideal ratio the current assets must be doubled the current liabilities in order to pay of the current liabilities in easier manner. Similarly
in case of the quick ratio it is 1.66. Hence it can be stated that the liquidity of the company is stable and
3 activity ratio calculations for both budgeted and actual years
Asset turnover ratio
budgeted actual
sales 9551 5797
average total asset 3300 3000
Asset turnover ratio Sales/ Average total asset 2.89424 1.93233
Inventory turnover ratio
budgeted actual
COGS -12488 -7962
Average inventory 330 300
Inventory turnover ratio COGS/ Average inventory
-
37.8424 -26.54
tabler-icon-diamond-filled.svg

Secure Best Marks with AI Grader

Need help grading? Try our AI Grader for instant feedback on your assignments.
Document Page
Debtor turnover ratio
budgeted actual
Net credit sales 9551 5797
Average debtors 385 350
Debtor turnover ratio Net credit sales/ Average debtor 24.8078 16.5629
With help of the activity ratios it is clearly visible baton the performance of the company is average. With comparison to the budgeted
the actual performance is very low. The asset turnover ratio reflects that budgeted is 2.89 where is the actual is 1.93. This in turn
reflects that the company was not in keep able to perform up to the budgeted Audi standard performance. Similarly in case of the
inventory turnover ratio it is seen that company is not enough capable of using it inventory two or more profit.
2 risk ratio calculations for both budgeted and actual years
Debt to equity ratio
budgeted actual
Total debt 220 200
Shareholders’ equity 2255 2050
Debt to equity ratio Total debt/ Shareholder equity 0.10 0.10
Debt to asset ratio
budgeted actual
Total debt 220 200
Total asset 3300 3000
Debt to asset ratio Total debt/ Total asset 0.07 0.07
Document Page
With help of the risk ratios that is debt to equity ratio and debt to asset ratio it is clearly visible factor the budgeted performance is
equal to the actual performance. With help of the debt to equity ratio it is clear that the company is having 10% of the debt from the
total equity. In addition to this for having the total asset the company uses 7% of the total debt.
Charts showing
4 profitability ratio calculations for both budgeted and actual years
2 liquidity ratio calculations for both year start and year end
Document Page
3 activity ratio calculations for both budgeted and actual years
tabler-icon-diamond-filled.svg

Paraphrase This Document

Need a fresh take? Get an instant paraphrase of this document with our AI Paraphraser
Document Page
2 risk ratio calculations for both budgeted and actual years
chevron_up_icon
1 out of 20
circle_padding
hide_on_mobile
zoom_out_icon
logo.png

Your All-in-One AI-Powered Toolkit for Academic Success.

Available 24*7 on WhatsApp / Email

[object Object]