Biology Report: Bradford Assay for Protein Concentration Determination
VerifiedAdded on 2023/04/26
|10
|2328
|195
Report
AI Summary
This report details an experiment utilizing the Bradford assay, a spectroscopic method developed by Marion M. Bradford for determining protein concentration in aqueous solutions. The experiment involved constructing a standard curve using Bovine Serum Albumin (BSA) at concentrations ranging from 0 to 1.0 mg/ml and then applying the Bradford assay to determine the protein concentration of two unknown samples, labeled A and B. The results indicated that Sample A had a protein concentration of 0.77 mg/ml, while Sample B had a concentration of 0.37 mg/ml. The report includes a detailed methodology, results with absorbance readings, a standard curve graph, and a discussion of the findings, including the importance of standard deviation and the value of R2 in assessing the accuracy of the experiment. The report concludes that the Bradford assay is a successful method for protein quantification, with minimal errors observed in the experiment.

Running Head: BIOLOGY
0
Biology
0
Biology
Paraphrase This Document
Need a fresh take? Get an instant paraphrase of this document with our AI Paraphraser
BIOLOGY
1
Abstract:
In the year 1970s Mraion M. Bradford developed Bradford assay which has been identified as
the safe, accurate and most effective method for analysing the protein concentration in the
aqueous solution with the use of spectroscopic analytic process. Coomassie blue dye is used
in the assay for determining uncertain amount of protein. For the purpose of carrying out an
experiment, standard curve using BSA at the particular range of the scale from 0 to 1.0mg/ml
has been constructed, and later on the technique of the Bradford Assaying was performed.
The result obtained from the experiment determined the concentration of the unknown
sample, which was observed as Sample A, 0.77mg/ml and the sample B was observed as
0.37mg/ml.

BIOLOGY
2
Contents
Introduction:...............................................................................................................................3
Materials and Methods:..............................................................................................................4
Results:.......................................................................................................................................5
Discussion:.................................................................................................................................7
References..................................................................................................................................9
⊘ This is a preview!⊘
Do you want full access?
Subscribe today to unlock all pages.
Trusted by 1+ million students worldwide
BIOLOGY
3
Introduction:
To state about most simple and easy method of the protein quantification, it has been
analysed that Bradford assay has been effective at the determination. The method was
developed by Marion M. Bradford in the year 1970s (Bradford, 1976).
The method has its secure, fast and the accurate results in context to the
determination of the concentration of the protein in the aqueous solution through using
spectroscopic analytic process (Olson, 2016). The determination is observed through the colour
change of the solution measured by the aspect of absorbance shift, which occurs due to
binding of the Coomassie blue dye.
The blue dye exists in three varied conditions, i.e. anionic, neutral, and cationic,
which results into the colour as blue, green, and red respectively. The use of blue dye has
been observed in the acidic solution, where the red color is further changed into blue after
getting binded with protein (Grintzalis, Georgiou & Schneider, 2015). It has been observed that
reaction from both, the protein and dye is obtained from the composition of amino acid of the
protein. From the experiment, it has been assessed that the blue dye at first binds with the
residue of amino acids and aromatic. The solution will not change and remain brown if there
is no content of protein. The method used in the experiment has high advantages over other
methods such as Folin and Biuret, as it can be performed quickly within 30 minutes
(Wiśniewski & Gaugaz, 2015). In addition, the coefficient of the extinction of the dye albumin
complex is utilised in the solution remains same till times from the time of initial use. Thus,
in this respect the application of Beer’s law is effective to this technique for the accuracy in
quantification of protein and the selection of volume of dye ratio.
The technique is found to be sensitive as it can measure from 1 to 20μg. The
absorbance shift of the change in color in the experiment is measured at 595nm, and the blue
form and dye gets identified at 595nm (Fanger, 1987). However, there may be some
interference observed with the results of the assay experiment in context to some chemical to
dye and chemical to the protein interaction. The substances which are analysed to be the
cause of this interaction are flavonoids, detergents, and some basic protein buffers. These
substances are found leading to interaction through the act of making fluctuation in the pH of
the solution or through direct binding (Compton & Jones, 1985). Although, it has been also
Paraphrase This Document
Need a fresh take? Get an instant paraphrase of this document with our AI Paraphraser
BIOLOGY
4
analysed that there are some of the substances which do not lead to this kind of interaction
and they do not alter the dye’s protein binding mechanism. It is due to the reason that they are
used in appropriate protocols or quantum. It has been reported that the Marion M. Bradford
has suggested the use of this assaying technique, and amongst them one is the protein
determination using the method cell fractions (Bradford, 1976). Hence, in this report the
technique Bradford assaying will be utilised to determine the concentration of protein of the
cell extract. The same aspects have defined about the main aim or significance of the study
i.e. the protein determination within two cell extracts using the above discussed Bradford
technique.
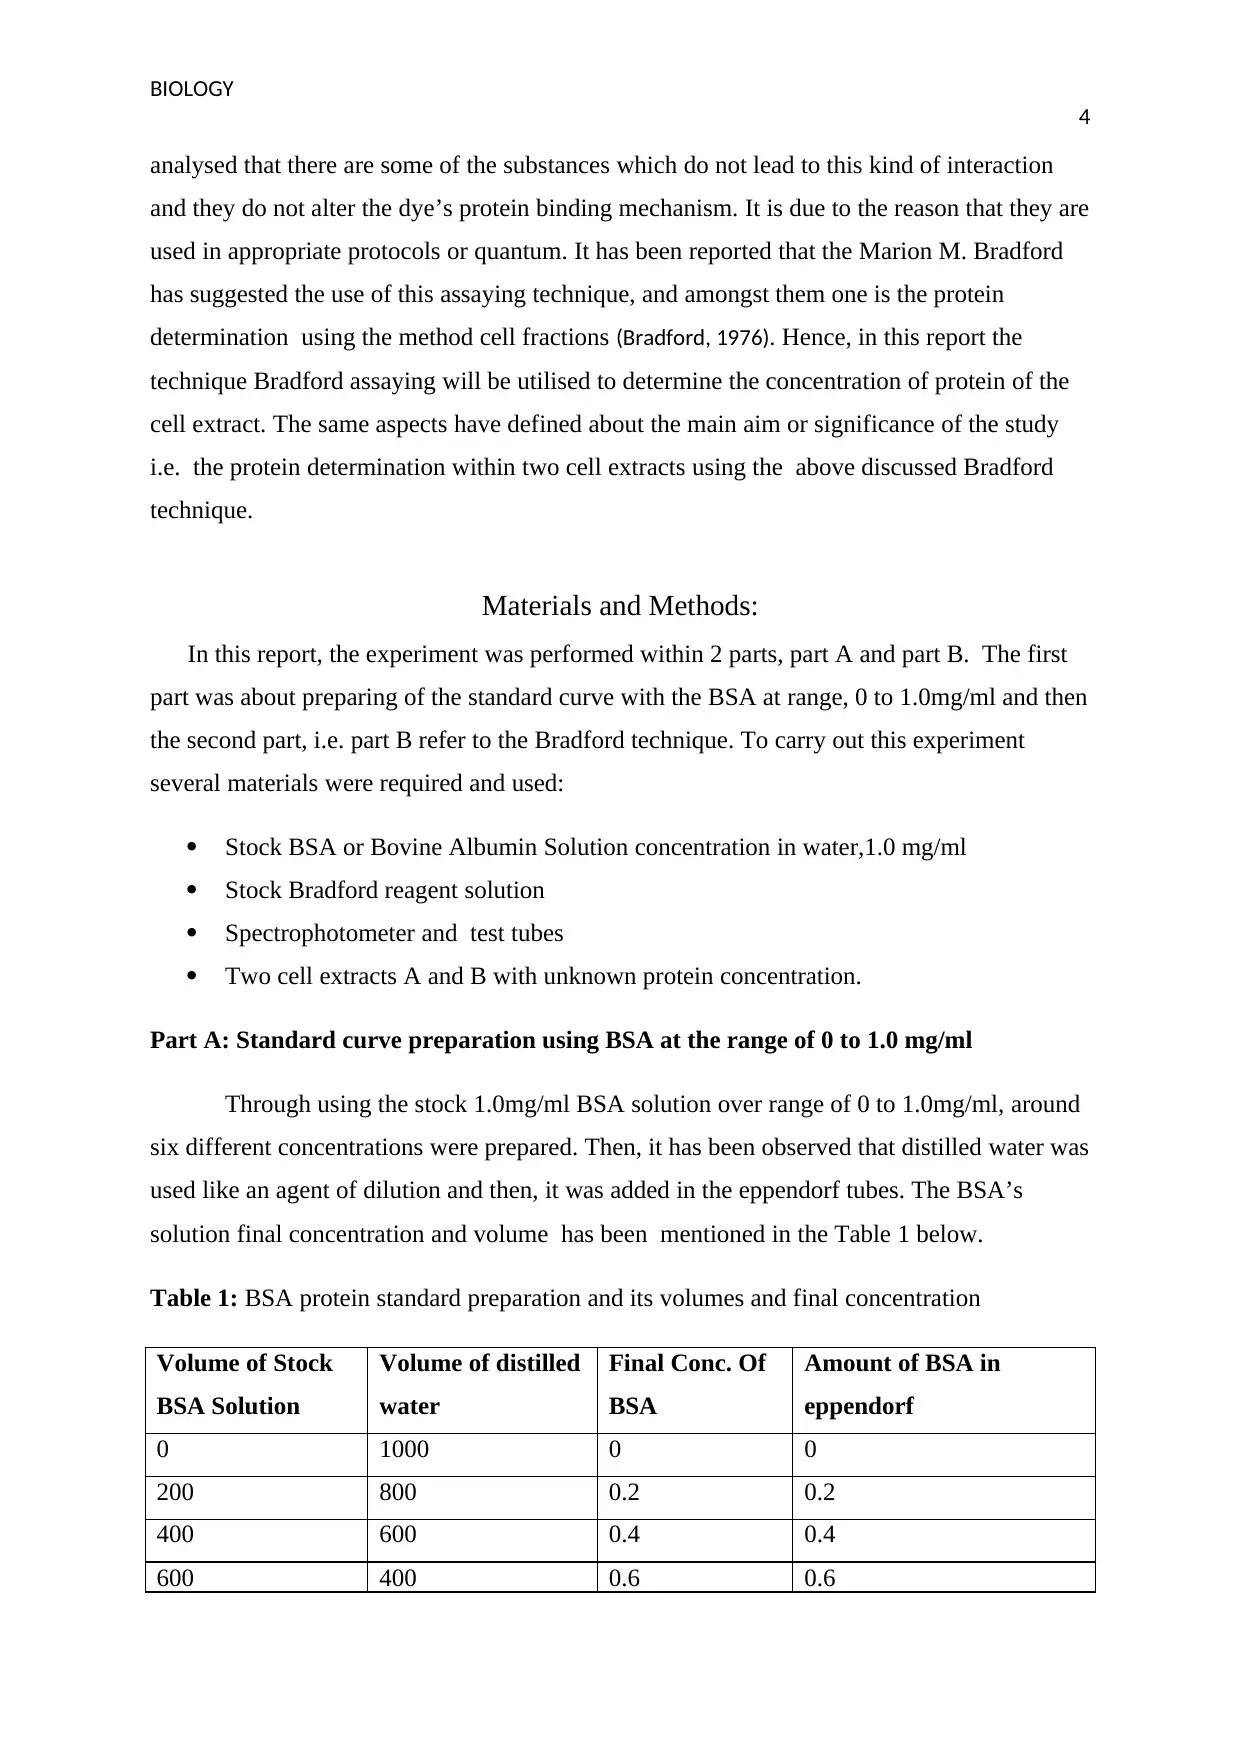
Materials and Methods:
In this report, the experiment was performed within 2 parts, part A and part B. The first
part was about preparing of the standard curve with the BSA at range, 0 to 1.0mg/ml and then
the second part, i.e. part B refer to the Bradford technique. To carry out this experiment
several materials were required and used:
Stock BSA or Bovine Albumin Solution concentration in water,1.0 mg/ml
Stock Bradford reagent solution
Spectrophotometer and test tubes
Two cell extracts A and B with unknown protein concentration.
Part A: Standard curve preparation using BSA at the range of 0 to 1.0 mg/ml
Through using the stock 1.0mg/ml BSA solution over range of 0 to 1.0mg/ml, around
six different concentrations were prepared. Then, it has been observed that distilled water was
used like an agent of dilution and then, it was added in the eppendorf tubes. The BSA’s
solution final concentration and volume has been mentioned in the Table 1 below.
Table 1: BSA protein standard preparation and its volumes and final concentration
Volume of Stock
BSA Solution
Volume of distilled
water
Final Conc. Of
BSA
Amount of BSA in
eppendorf
0 1000 0 0
200 800 0.2 0.2
400 600 0.4 0.4
600 400 0.6 0.6
4
analysed that there are some of the substances which do not lead to this kind of interaction
and they do not alter the dye’s protein binding mechanism. It is due to the reason that they are
used in appropriate protocols or quantum. It has been reported that the Marion M. Bradford
has suggested the use of this assaying technique, and amongst them one is the protein
determination using the method cell fractions (Bradford, 1976). Hence, in this report the
technique Bradford assaying will be utilised to determine the concentration of protein of the
cell extract. The same aspects have defined about the main aim or significance of the study
i.e. the protein determination within two cell extracts using the above discussed Bradford
technique.
Materials and Methods:
In this report, the experiment was performed within 2 parts, part A and part B. The first
part was about preparing of the standard curve with the BSA at range, 0 to 1.0mg/ml and then
the second part, i.e. part B refer to the Bradford technique. To carry out this experiment
several materials were required and used:
Stock BSA or Bovine Albumin Solution concentration in water,1.0 mg/ml
Stock Bradford reagent solution
Spectrophotometer and test tubes
Two cell extracts A and B with unknown protein concentration.
Part A: Standard curve preparation using BSA at the range of 0 to 1.0 mg/ml
Through using the stock 1.0mg/ml BSA solution over range of 0 to 1.0mg/ml, around
six different concentrations were prepared. Then, it has been observed that distilled water was
used like an agent of dilution and then, it was added in the eppendorf tubes. The BSA’s
solution final concentration and volume has been mentioned in the Table 1 below.
Table 1: BSA protein standard preparation and its volumes and final concentration
Volume of Stock
BSA Solution
Volume of distilled
water
Final Conc. Of
BSA
Amount of BSA in
eppendorf
0 1000 0 0
200 800 0.2 0.2
400 600 0.4 0.4
600 400 0.6 0.6
BIOLOGY
5
800 200 0.8 0.8
1000 0 1 1
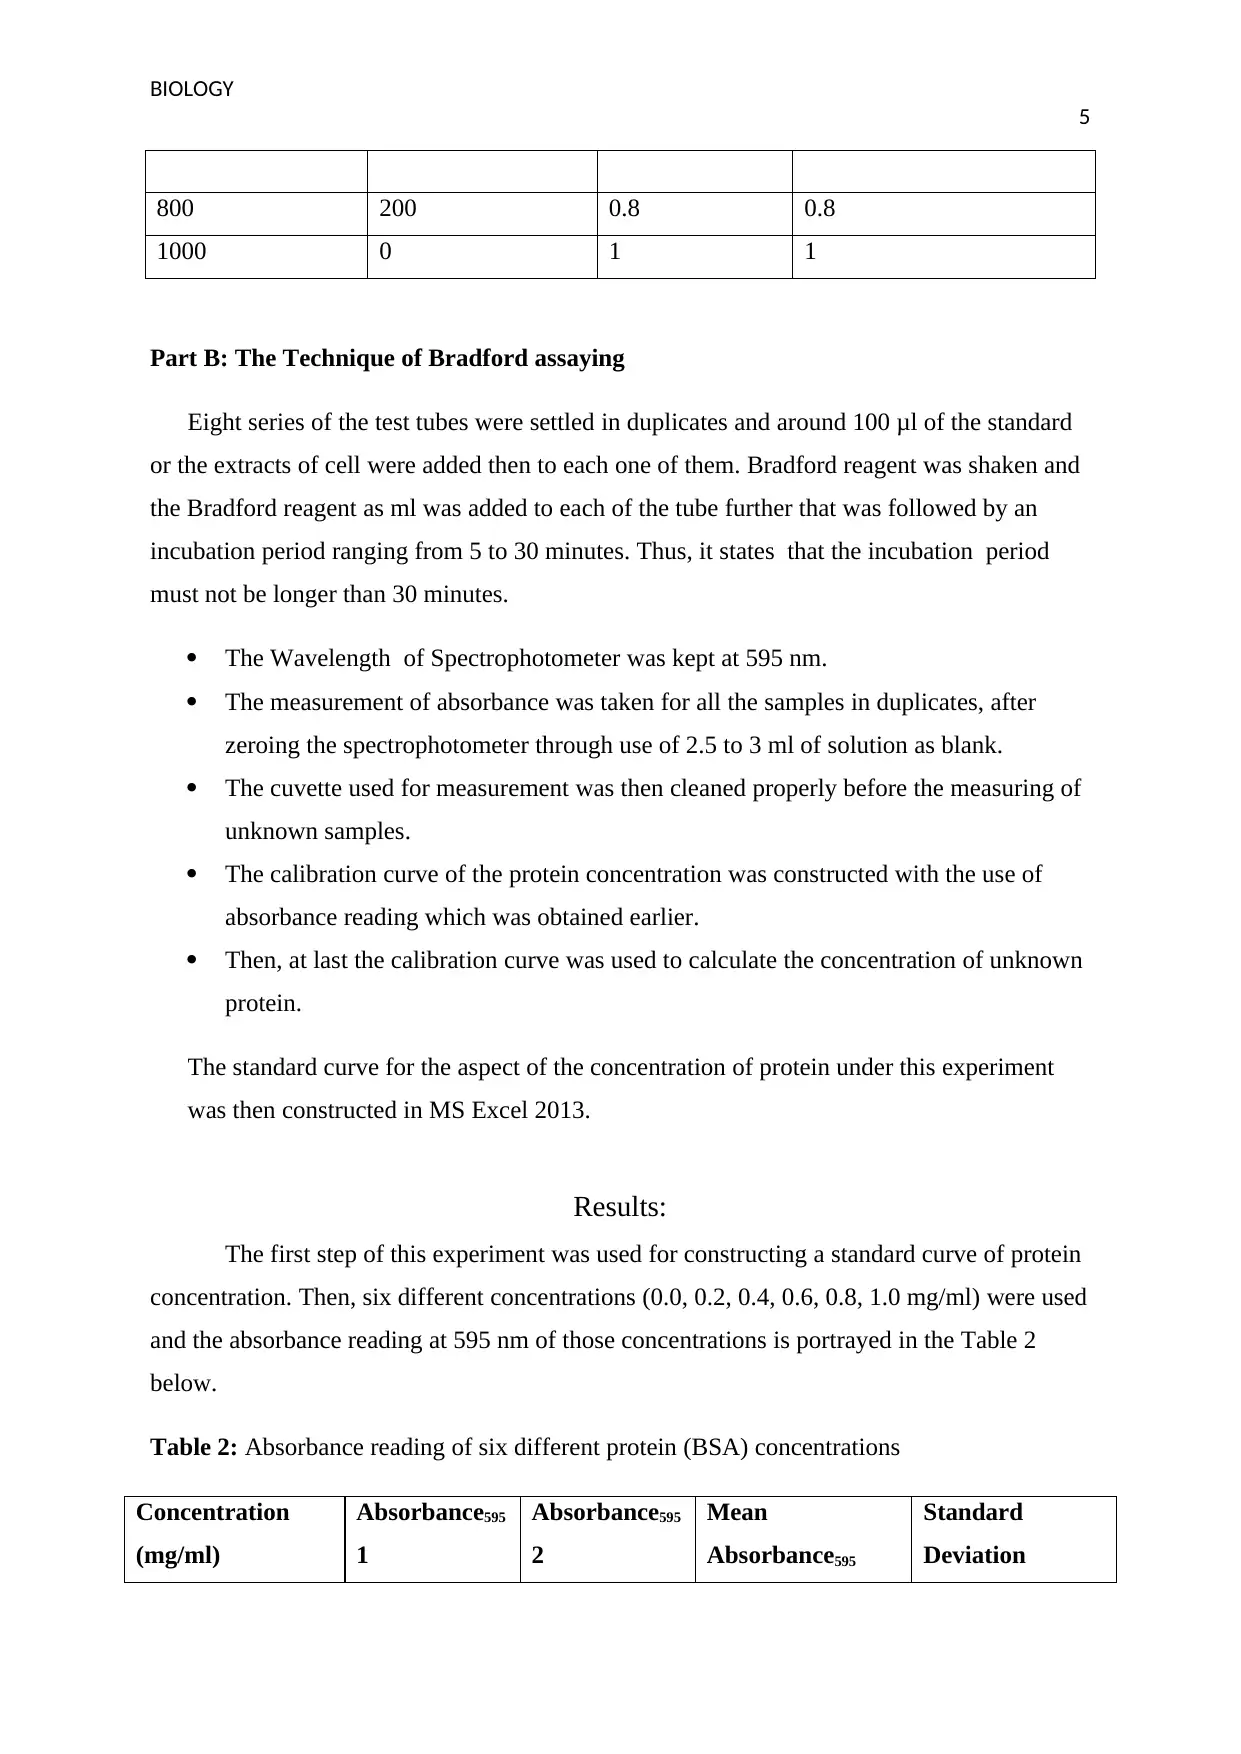
Part B: The Technique of Bradford assaying
Eight series of the test tubes were settled in duplicates and around 100 μl of the standard
or the extracts of cell were added then to each one of them. Bradford reagent was shaken and
the Bradford reagent as ml was added to each of the tube further that was followed by an
incubation period ranging from 5 to 30 minutes. Thus, it states that the incubation period
must not be longer than 30 minutes.
The Wavelength of Spectrophotometer was kept at 595 nm.
The measurement of absorbance was taken for all the samples in duplicates, after
zeroing the spectrophotometer through use of 2.5 to 3 ml of solution as blank.
The cuvette used for measurement was then cleaned properly before the measuring of
unknown samples.
The calibration curve of the protein concentration was constructed with the use of
absorbance reading which was obtained earlier.
Then, at last the calibration curve was used to calculate the concentration of unknown
protein.
The standard curve for the aspect of the concentration of protein under this experiment
was then constructed in MS Excel 2013.
Results:
The first step of this experiment was used for constructing a standard curve of protein
concentration. Then, six different concentrations (0.0, 0.2, 0.4, 0.6, 0.8, 1.0 mg/ml) were used
and the absorbance reading at 595 nm of those concentrations is portrayed in the Table 2
below.
Table 2: Absorbance reading of six different protein (BSA) concentrations
Concentration
(mg/ml)
Absorbance595
1
Absorbance595
2
Mean
Absorbance595
Standard
Deviation
5
800 200 0.8 0.8
1000 0 1 1
Part B: The Technique of Bradford assaying
Eight series of the test tubes were settled in duplicates and around 100 μl of the standard
or the extracts of cell were added then to each one of them. Bradford reagent was shaken and
the Bradford reagent as ml was added to each of the tube further that was followed by an
incubation period ranging from 5 to 30 minutes. Thus, it states that the incubation period
must not be longer than 30 minutes.
The Wavelength of Spectrophotometer was kept at 595 nm.
The measurement of absorbance was taken for all the samples in duplicates, after
zeroing the spectrophotometer through use of 2.5 to 3 ml of solution as blank.
The cuvette used for measurement was then cleaned properly before the measuring of
unknown samples.
The calibration curve of the protein concentration was constructed with the use of
absorbance reading which was obtained earlier.
Then, at last the calibration curve was used to calculate the concentration of unknown
protein.
The standard curve for the aspect of the concentration of protein under this experiment
was then constructed in MS Excel 2013.
Results:
The first step of this experiment was used for constructing a standard curve of protein
concentration. Then, six different concentrations (0.0, 0.2, 0.4, 0.6, 0.8, 1.0 mg/ml) were used
and the absorbance reading at 595 nm of those concentrations is portrayed in the Table 2
below.
Table 2: Absorbance reading of six different protein (BSA) concentrations
Concentration
(mg/ml)
Absorbance595
1
Absorbance595
2
Mean
Absorbance595
Standard
Deviation
⊘ This is a preview!⊘
Do you want full access?
Subscribe today to unlock all pages.
Trusted by 1+ million students worldwide
BIOLOGY
6
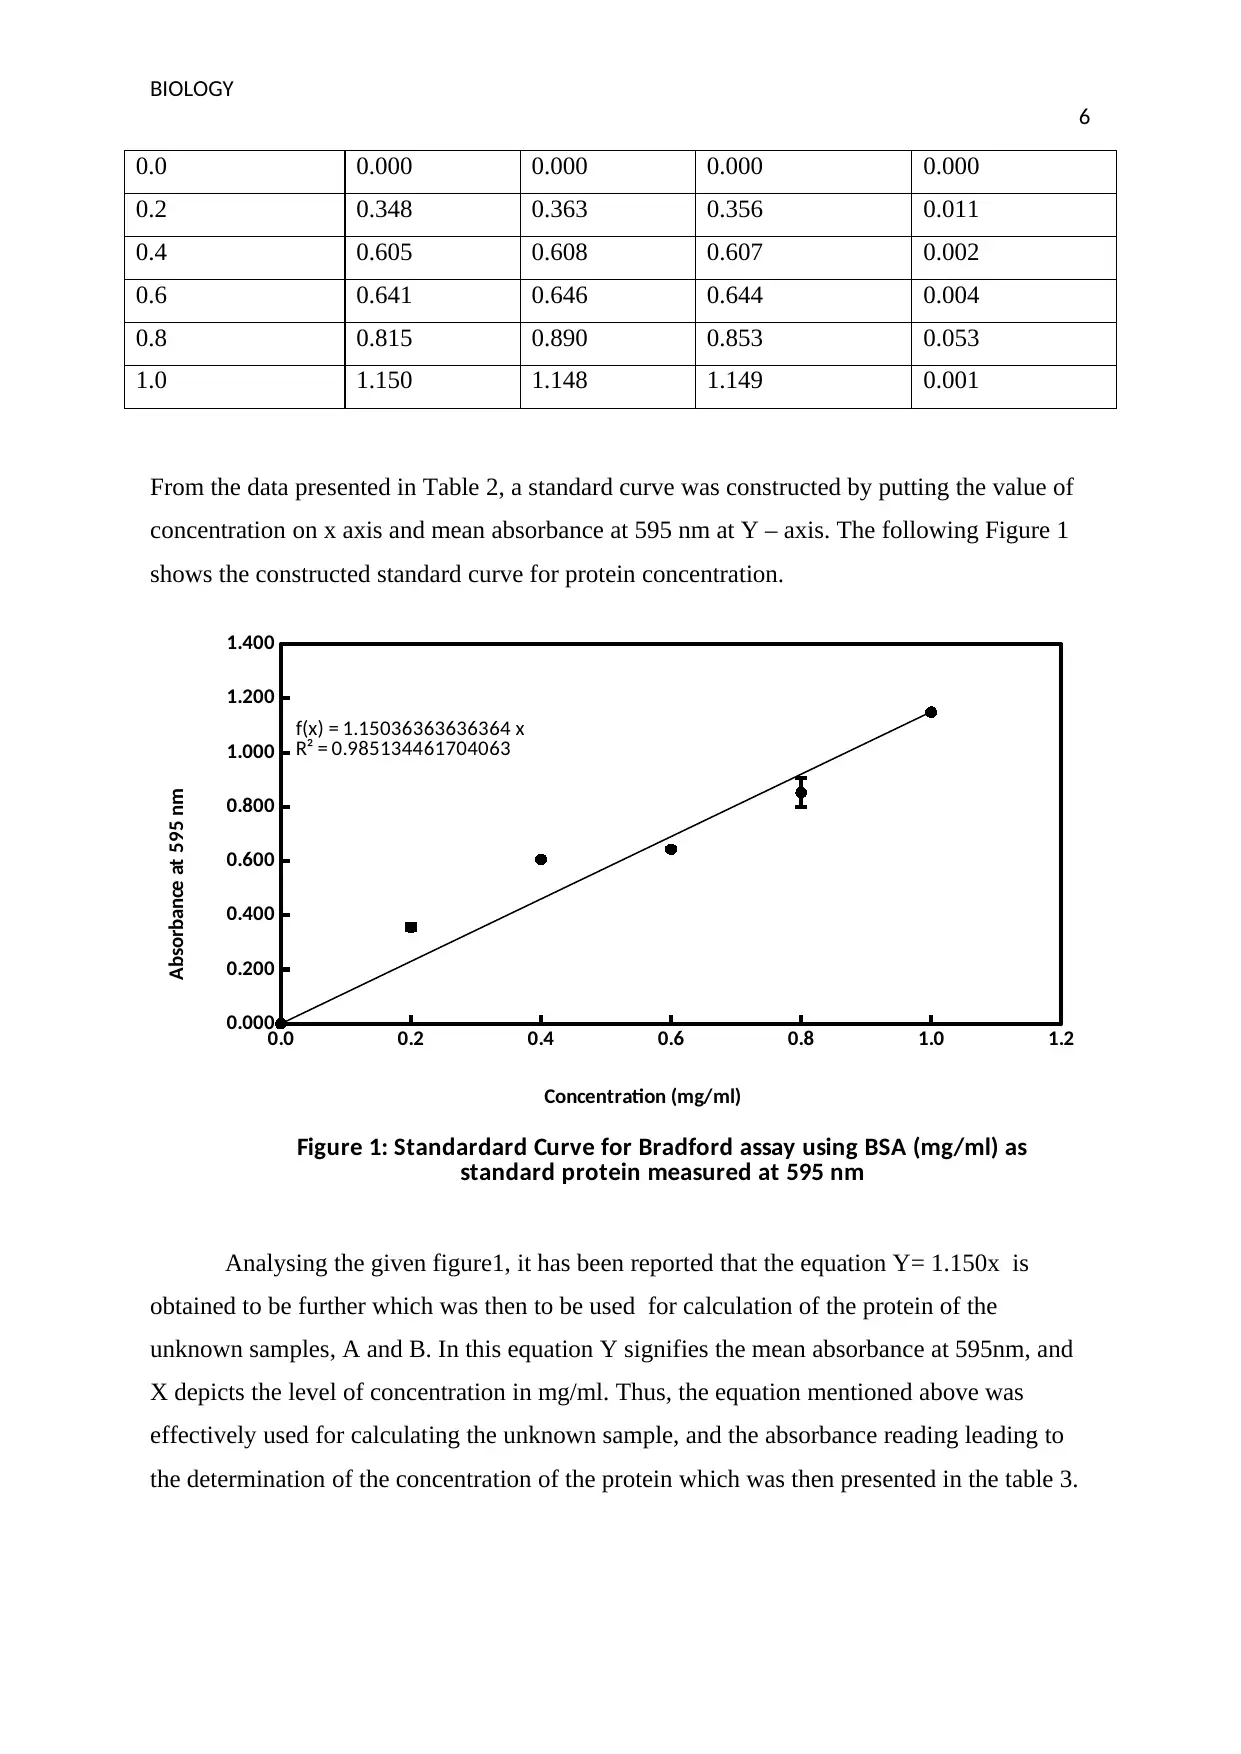
0.0 0.000 0.000 0.000 0.000
0.2 0.348 0.363 0.356 0.011
0.4 0.605 0.608 0.607 0.002
0.6 0.641 0.646 0.644 0.004
0.8 0.815 0.890 0.853 0.053
1.0 1.150 1.148 1.149 0.001
From the data presented in Table 2, a standard curve was constructed by putting the value of
concentration on x axis and mean absorbance at 595 nm at Y – axis. The following Figure 1
shows the constructed standard curve for protein concentration.
0.0 0.2 0.4 0.6 0.8 1.0 1.2
0.000
0.200
0.400
0.600
0.800
1.000
1.200
1.400
f(x) = 1.15036363636364 x
R² = 0.985134461704063
Figure 1: Standardard Curve for Bradford assay using BSA (mg/ml) as
standard protein measured at 595 nm
Concentration (mg/ml)
Absorbance at 595 nm
Analysing the given figure1, it has been reported that the equation Y= 1.150x is
obtained to be further which was then to be used for calculation of the protein of the
unknown samples, A and B. In this equation Y signifies the mean absorbance at 595nm, and
X depicts the level of concentration in mg/ml. Thus, the equation mentioned above was
effectively used for calculating the unknown sample, and the absorbance reading leading to
the determination of the concentration of the protein which was then presented in the table 3.
6
0.0 0.000 0.000 0.000 0.000
0.2 0.348 0.363 0.356 0.011
0.4 0.605 0.608 0.607 0.002
0.6 0.641 0.646 0.644 0.004
0.8 0.815 0.890 0.853 0.053
1.0 1.150 1.148 1.149 0.001
From the data presented in Table 2, a standard curve was constructed by putting the value of
concentration on x axis and mean absorbance at 595 nm at Y – axis. The following Figure 1
shows the constructed standard curve for protein concentration.
0.0 0.2 0.4 0.6 0.8 1.0 1.2
0.000
0.200
0.400
0.600
0.800
1.000
1.200
1.400
f(x) = 1.15036363636364 x
R² = 0.985134461704063
Figure 1: Standardard Curve for Bradford assay using BSA (mg/ml) as
standard protein measured at 595 nm
Concentration (mg/ml)
Absorbance at 595 nm
Analysing the given figure1, it has been reported that the equation Y= 1.150x is
obtained to be further which was then to be used for calculation of the protein of the
unknown samples, A and B. In this equation Y signifies the mean absorbance at 595nm, and
X depicts the level of concentration in mg/ml. Thus, the equation mentioned above was
effectively used for calculating the unknown sample, and the absorbance reading leading to
the determination of the concentration of the protein which was then presented in the table 3.
Paraphrase This Document
Need a fresh take? Get an instant paraphrase of this document with our AI Paraphraser
BIOLOGY
7
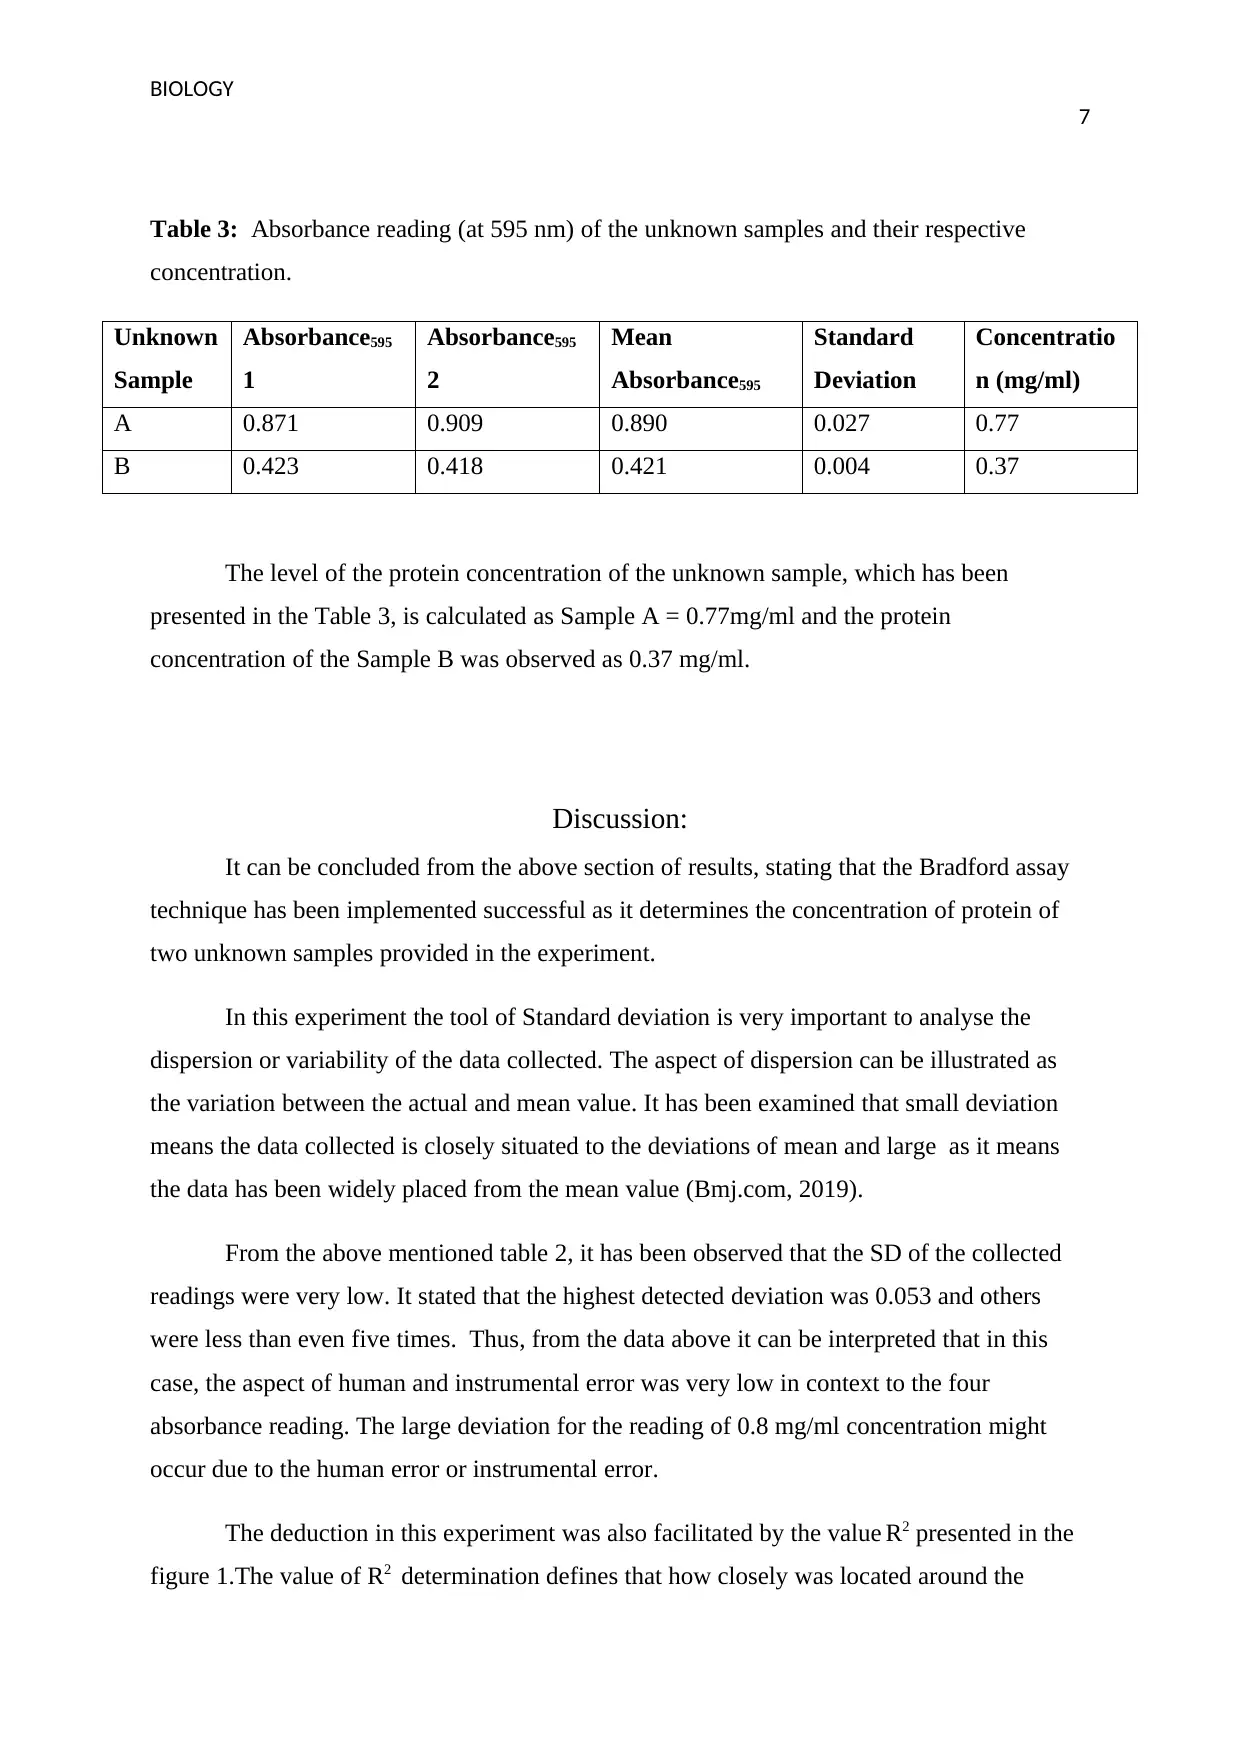
Table 3: Absorbance reading (at 595 nm) of the unknown samples and their respective
concentration.
Unknown
Sample
Absorbance595
1
Absorbance595
2
Mean
Absorbance595
Standard
Deviation
Concentratio
n (mg/ml)
A 0.871 0.909 0.890 0.027 0.77
B 0.423 0.418 0.421 0.004 0.37
The level of the protein concentration of the unknown sample, which has been
presented in the Table 3, is calculated as Sample A = 0.77mg/ml and the protein
concentration of the Sample B was observed as 0.37 mg/ml.
Discussion:
It can be concluded from the above section of results, stating that the Bradford assay
technique has been implemented successful as it determines the concentration of protein of
two unknown samples provided in the experiment.
In this experiment the tool of Standard deviation is very important to analyse the
dispersion or variability of the data collected. The aspect of dispersion can be illustrated as
the variation between the actual and mean value. It has been examined that small deviation
means the data collected is closely situated to the deviations of mean and large as it means
the data has been widely placed from the mean value (Bmj.com, 2019).
From the above mentioned table 2, it has been observed that the SD of the collected
readings were very low. It stated that the highest detected deviation was 0.053 and others
were less than even five times. Thus, from the data above it can be interpreted that in this
case, the aspect of human and instrumental error was very low in context to the four
absorbance reading. The large deviation for the reading of 0.8 mg/ml concentration might
occur due to the human error or instrumental error.
The deduction in this experiment was also facilitated by the value R2 presented in the
figure 1.The value of R2 determination defines that how closely was located around the
7
Table 3: Absorbance reading (at 595 nm) of the unknown samples and their respective
concentration.
Unknown
Sample
Absorbance595
1
Absorbance595
2
Mean
Absorbance595
Standard
Deviation
Concentratio
n (mg/ml)
A 0.871 0.909 0.890 0.027 0.77
B 0.423 0.418 0.421 0.004 0.37
The level of the protein concentration of the unknown sample, which has been
presented in the Table 3, is calculated as Sample A = 0.77mg/ml and the protein
concentration of the Sample B was observed as 0.37 mg/ml.
Discussion:
It can be concluded from the above section of results, stating that the Bradford assay
technique has been implemented successful as it determines the concentration of protein of
two unknown samples provided in the experiment.
In this experiment the tool of Standard deviation is very important to analyse the
dispersion or variability of the data collected. The aspect of dispersion can be illustrated as
the variation between the actual and mean value. It has been examined that small deviation
means the data collected is closely situated to the deviations of mean and large as it means
the data has been widely placed from the mean value (Bmj.com, 2019).
From the above mentioned table 2, it has been observed that the SD of the collected
readings were very low. It stated that the highest detected deviation was 0.053 and others
were less than even five times. Thus, from the data above it can be interpreted that in this
case, the aspect of human and instrumental error was very low in context to the four
absorbance reading. The large deviation for the reading of 0.8 mg/ml concentration might
occur due to the human error or instrumental error.
The deduction in this experiment was also facilitated by the value R2 presented in the
figure 1.The value of R2 determination defines that how closely was located around the
BIOLOGY
8
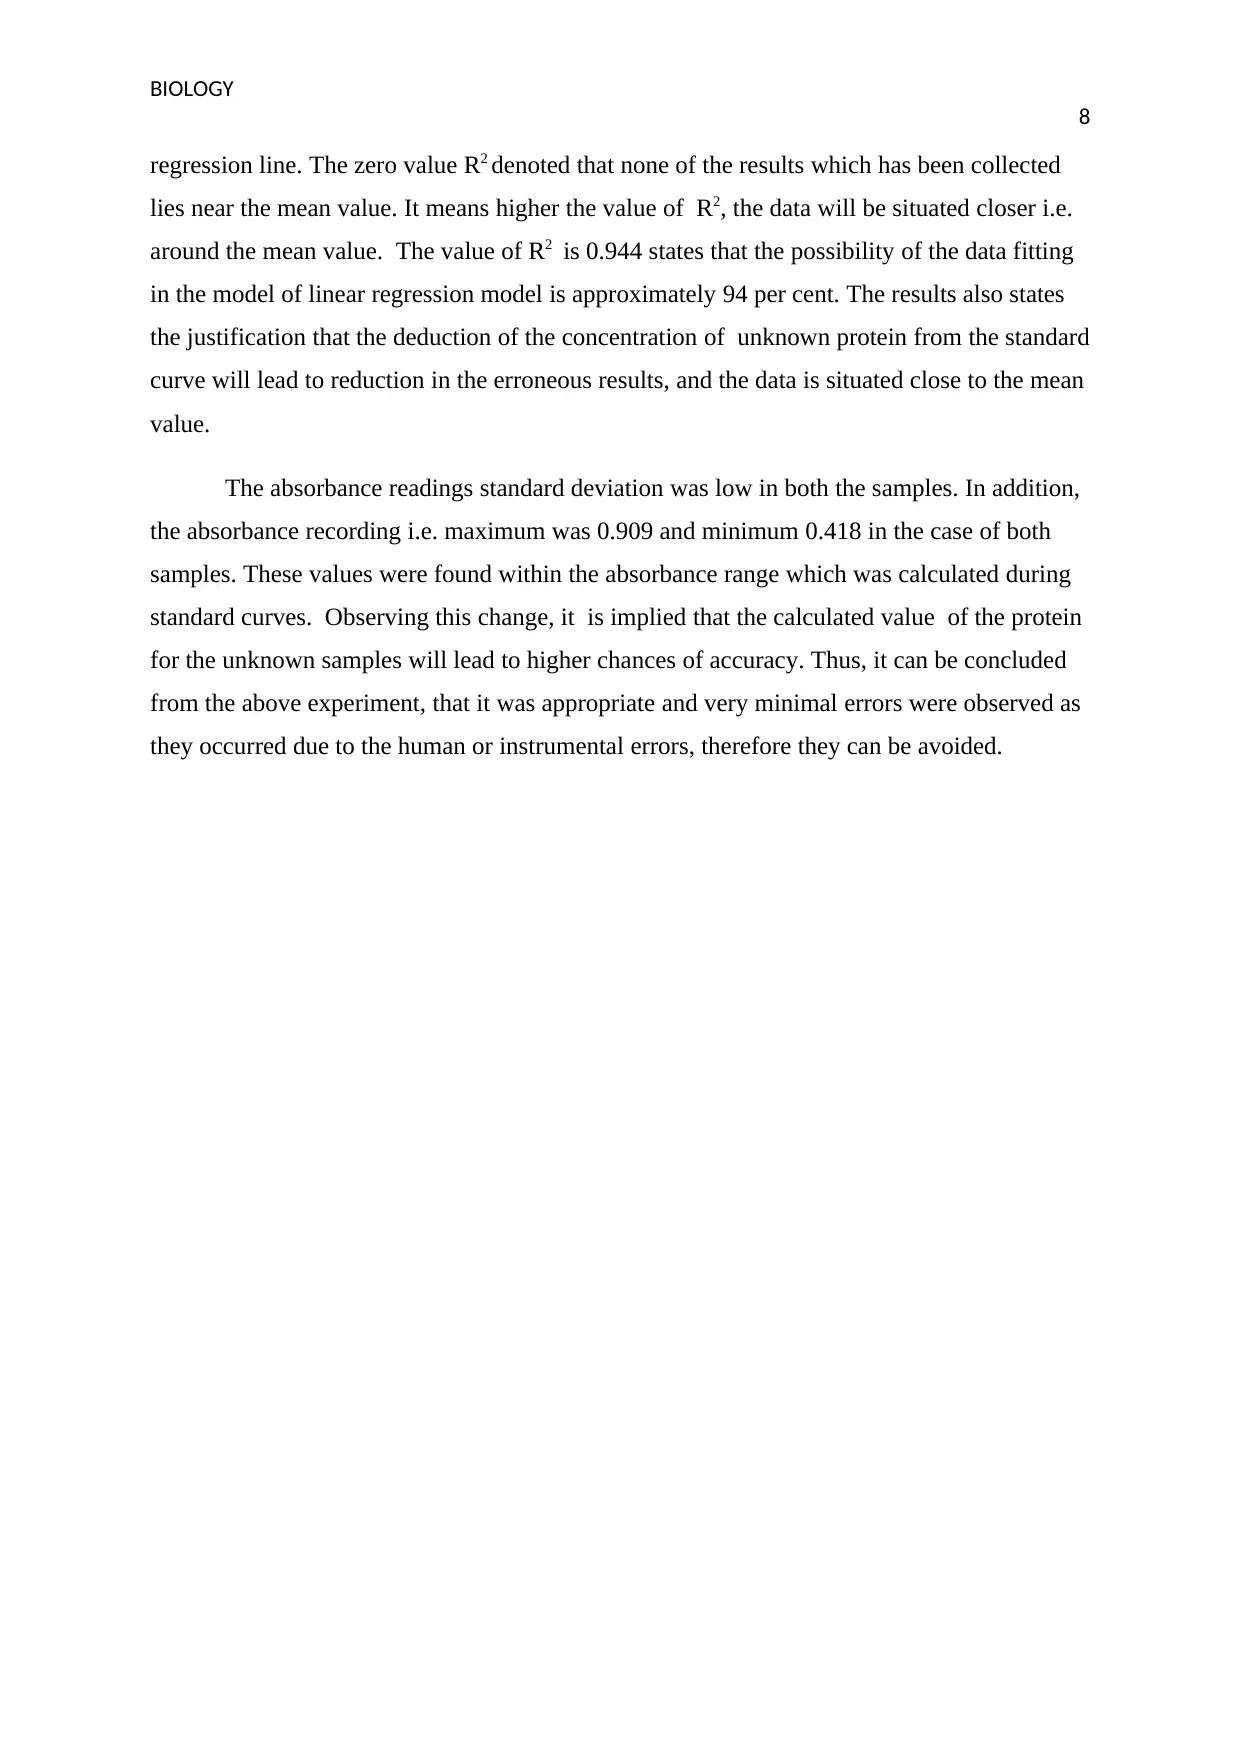
regression line. The zero value R2 denoted that none of the results which has been collected
lies near the mean value. It means higher the value of R2, the data will be situated closer i.e.
around the mean value. The value of R2 is 0.944 states that the possibility of the data fitting
in the model of linear regression model is approximately 94 per cent. The results also states
the justification that the deduction of the concentration of unknown protein from the standard
curve will lead to reduction in the erroneous results, and the data is situated close to the mean
value.
The absorbance readings standard deviation was low in both the samples. In addition,
the absorbance recording i.e. maximum was 0.909 and minimum 0.418 in the case of both
samples. These values were found within the absorbance range which was calculated during
standard curves. Observing this change, it is implied that the calculated value of the protein
for the unknown samples will lead to higher chances of accuracy. Thus, it can be concluded
from the above experiment, that it was appropriate and very minimal errors were observed as
they occurred due to the human or instrumental errors, therefore they can be avoided.
8
regression line. The zero value R2 denoted that none of the results which has been collected
lies near the mean value. It means higher the value of R2, the data will be situated closer i.e.
around the mean value. The value of R2 is 0.944 states that the possibility of the data fitting
in the model of linear regression model is approximately 94 per cent. The results also states
the justification that the deduction of the concentration of unknown protein from the standard
curve will lead to reduction in the erroneous results, and the data is situated close to the mean
value.
The absorbance readings standard deviation was low in both the samples. In addition,
the absorbance recording i.e. maximum was 0.909 and minimum 0.418 in the case of both
samples. These values were found within the absorbance range which was calculated during
standard curves. Observing this change, it is implied that the calculated value of the protein
for the unknown samples will lead to higher chances of accuracy. Thus, it can be concluded
from the above experiment, that it was appropriate and very minimal errors were observed as
they occurred due to the human or instrumental errors, therefore they can be avoided.
⊘ This is a preview!⊘
Do you want full access?
Subscribe today to unlock all pages.
Trusted by 1+ million students worldwide
BIOLOGY
9
References
Bmj.com. (2019). Mean and standard deviation | The BMJ. Retrieved from
https://www.bmj.com/about-bmj/resources-readers/publications/statistics-square-
one/2-mean-and-standard-deviation
Bradford, M. M. (1976). A rapid and sensitive method for the quantitation of microgram
quantities of protein utilizing the principle of protein-dye binding. Analytical
biochemistry, 72(1-2), 248-254.
Compton, S. J. & Jones, C. G. (1985). Mechanism of dye response and interference in the
Bradford protein assay. Analytical biochemistry, 151(2), 369-374.
Fanger, B. O. (1987). Adaptation of the Bradford protein assay to membrane-bound proteins
by solubilizing in glucopyranoside detergents. Analytical biochemistry, 162(1), 11-17.
Grintzalis, K., Georgiou, C. D. & Schneider, Y. J. (2015). An accurate and sensitive
Coomassie Brilliant Blue G-250-based assay for protein determination. Analytical
biochemistry, 480, 28-30.
Olson, B. J. (2016). Assays for determination of protein concentration. Current protocols in
pharmacology, 73(1), A-3A.
Wiśniewski, J. R. & Gaugaz, F. Z. (2015). Fast and sensitive total protein and peptide assays
for proteomic analysis. Analytical chemistry, 87(8), 4110-4116.
1 out of 10
Related Documents


Your All-in-One AI-Powered Toolkit for Academic Success.
+13062052269
info@desklib.com
Available 24*7 on WhatsApp / Email
![[object Object]](/_next/static/media/star-bottom.7253800d.svg)
Unlock your academic potential
Copyright © 2020–2026 A2Z Services. All Rights Reserved. Developed and managed by ZUCOL.