PTS 9 BIC 3: Bradford Assay for Protein Quantification - Lab Report
VerifiedAdded on 2023/04/25
|11
|1932
|488
Report
AI Summary
This report details a Bradford assay experiment to determine protein concentrations in aqueous solutions using spectrophotometry. A standard curve was created using BSA, and the Bradford assay was applied to determine the protein concentration in two unknown samples. The protein concentration in sample A was found to be 0.77 mg/ml, while sample B had a concentration of 0.37 mg/ml. The experiment involved creating a standard curve with BSA, followed by performing the colorimetric assay using a spectrophotometer at 595 nm. The results, including absorbance readings and a standard curve, are presented, along with a discussion of the standard deviation and the reliability of the results, concluding that the experiment was conducted with minimal errors.
Running head: LAB ASSAY REPORT
PTS 9 BIC 3 The Bradford Lab Assay Report
Student Name
University:
PTS 9 BIC 3 The Bradford Lab Assay Report
Student Name
University:
Paraphrase This Document
Need a fresh take? Get an instant paraphrase of this document with our AI Paraphraser
1LAB ASSAY REPORT
Abstract:
The development of Bradford Assay is attributed to Marion M.Bradford in 1970. The Assay
provides accurate and safe way of determining the concentration of proteins in the aqueous
solutions with help of Spectroscopy. The Coomassie dye is used to find out the presence of
proteins. The experiment used a standard curve with the data value ranges from 0 to 1.0 mg/ml
and implemented Bradford Assay to the data values. The concentration of protein as determined
in the sample A came to be 0.77 while in the second sample, the value came as 0.37 mg/ml.
2LAB ASSAY REPORT
Table of Contents
Introduction:....................................................................................................................................3
Materials and Methods:...................................................................................................................4
Results:............................................................................................................................................5
Discussion:.......................................................................................................................................7
References:......................................................................................................................................8
⊘ This is a preview!⊘
Do you want full access?
Subscribe today to unlock all pages.
Trusted by 1+ million students worldwide
3LAB ASSAY REPORT
Introduction:
Marion M. Bradford developed Bradford Assay as the most accurate method of finding out the
protein in the aqueous solutions in 1970s (Bradford, 1976). It is considered safe; it is a rapidly
used and mostly accurate assay protocol for the assessing the protein concentration in aqueous
solution with help of spectroscopic analysis (Olson, 2016). It involves an estimation assay based
on colorimetry; the assay is solely dependent on the change of color of the solution to determine
the protein quantification. The change in intensity of color is determined by measuring the shift
in absorbance which is known as absorbance shift. The brilliant blue Coomasie Dye uses ionic
interactions to bind with the proteins. The dye exhibits red, green and blue color in the cationic,
neutral and anionic form respectively (Bio Rad, 2019) This assay uses the acidic state of
coomassie dye; the color change occurs from red to blue only after the dye binds to the desired
protein in solution (Grintzalis, Georgiou & Schneider, 2015). The interaction taking place
between dye and the protein of interest depends on the specific composition of amino acid
proteins being assayed. Coomassie has a binding affinity for aromatic amino acids. Absence of
protein in solution causes the color of coomassie to remain brownish throughout.
Bradford assay highlights several advantages over the other protein estimation assays such as
Folin and Biuret. This quick estimation assay is done within 30 minutes duration (Wiśniewski &
Gaugaz, 2015). The constant value of dye- albumin complex’s extinction coefficient remains
upto ten times its initial concentration being used in the assay. So, Beer’s Law can provide high
accuracy to the results while helping in maintaining an appropriate ratio of dye and the sample
analyte.
Paraphrase This Document
Need a fresh take? Get an instant paraphrase of this document with our AI Paraphraser
4LAB ASSAY REPORT
The high sensitivity of this assay can measure even very minute protein concentration of the
range of 1 to 20 μg. The assay involves measurement of the color intensity change through
measuring the shift in absorbance at a wavelength of 595 nm; the blue colour of the protein and
dye after interaction is detected at that wavelength (Fanger, 1987). The chemicals like protein
buffers, flavonoids and detergents may interfere with protein interactions thus adversely
affecting the final readings.(Compton & Jones, 1985). However when they are used in
compliance with the standard protocols, they do not cause any deviations. According to Bradford
(1976), this assay is used to determine the concentration of protein in cellular components. Thus,
this technique may accurately determine the concentration of unknown protein of the cell
extracts; the study aims to estimate the concentration of the protein using Bradford colorimetric
assay.
Methods and Materials
The experiment is conducted in two components. First part prepared a standard curve using
BSA; The second Part involved performing the colorimetric assay. For this experiment, the
provided sample solutions were as follows:
Aqueous Bovine Albumin Solution in 1.0 mg/ml or Stock BSA
Solution of Bradford reagent
Spectrophotometer
Test tubes
Cell extracts A and B with unknown protein concentration.
Part A
5LAB ASSAY REPORT
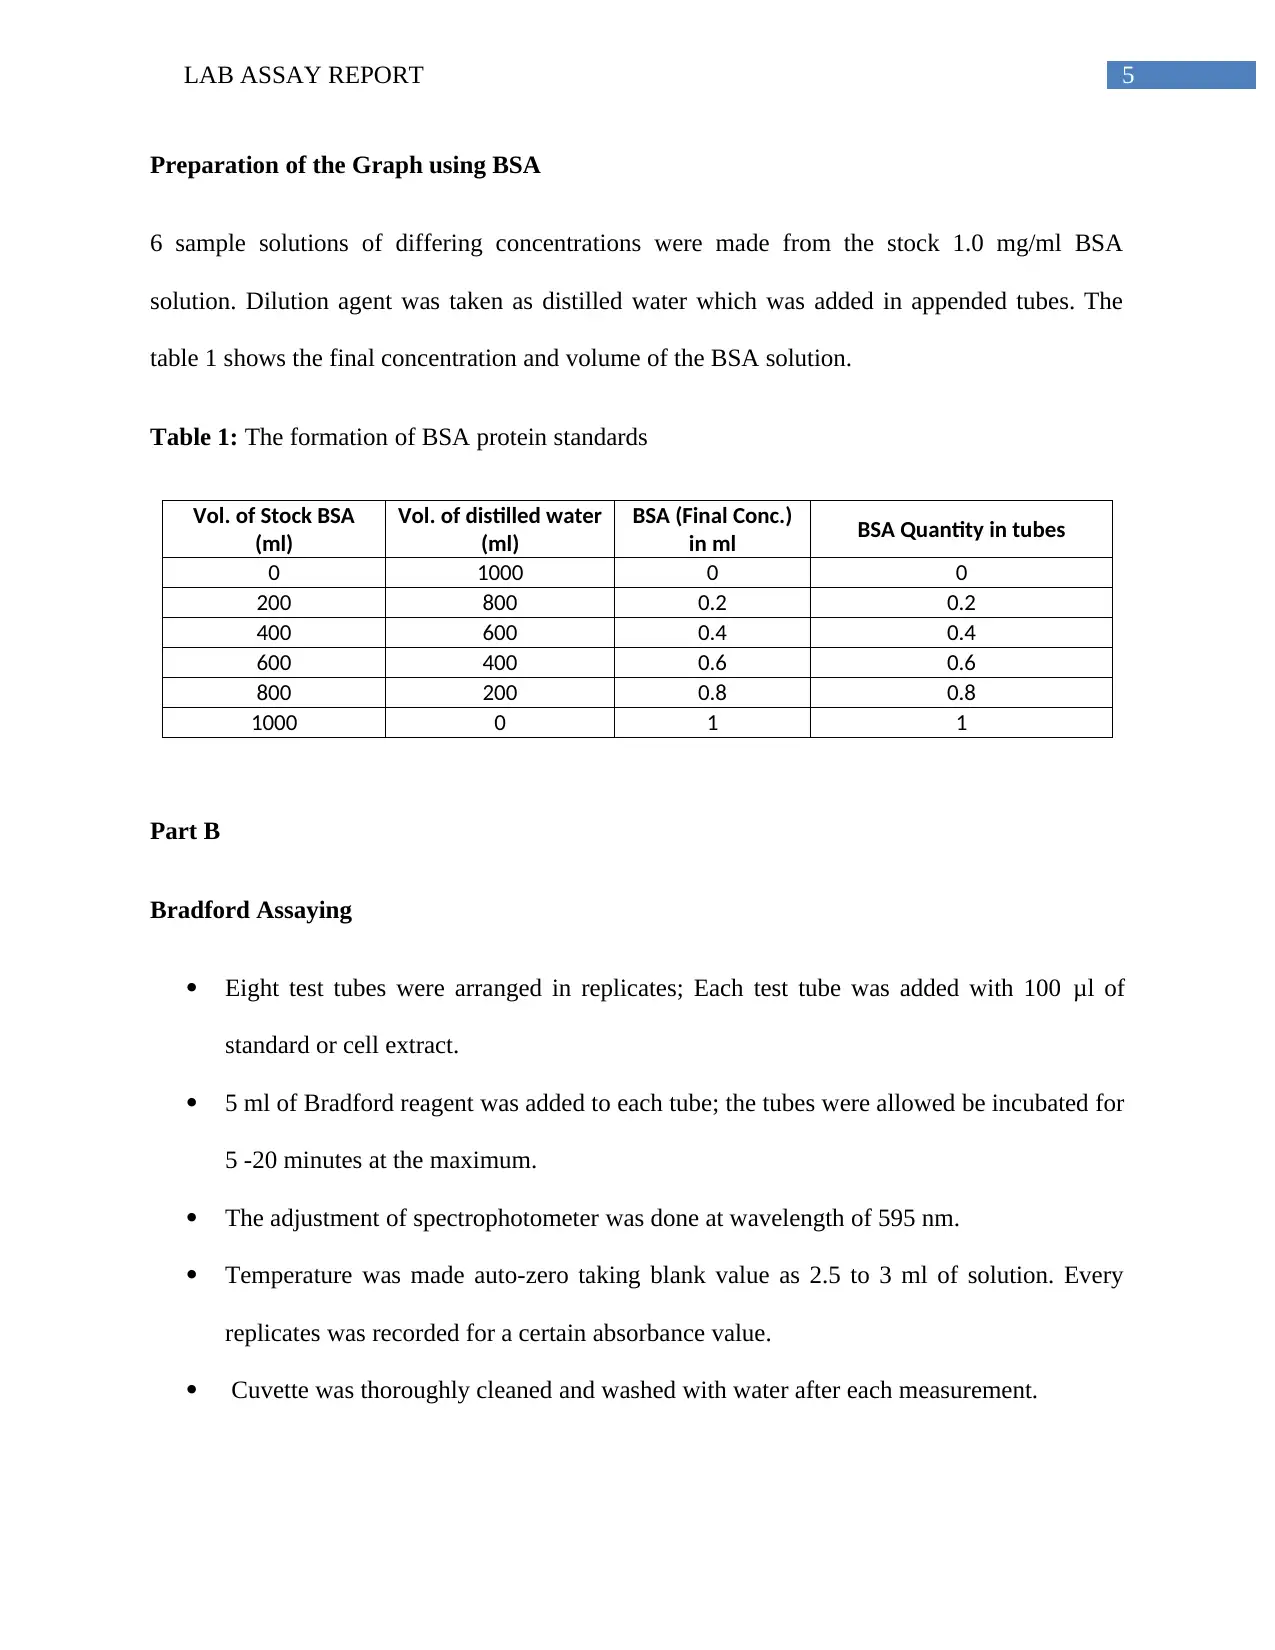
Preparation of the Graph using BSA
6 sample solutions of differing concentrations were made from the stock 1.0 mg/ml BSA
solution. Dilution agent was taken as distilled water which was added in appended tubes. The
table 1 shows the final concentration and volume of the BSA solution.
Table 1: The formation of BSA protein standards
Vol. of Stock BSA
(ml)
Vol. of distilled water
(ml)
BSA (Final Conc.)
in ml BSA Quantity in tubes
0 1000 0 0
200 800 0.2 0.2
400 600 0.4 0.4
600 400 0.6 0.6
800 200 0.8 0.8
1000 0 1 1
Part B
Bradford Assaying
Eight test tubes were arranged in replicates; Each test tube was added with 100 μl of
standard or cell extract.
5 ml of Bradford reagent was added to each tube; the tubes were allowed be incubated for
5 -20 minutes at the maximum.
The adjustment of spectrophotometer was done at wavelength of 595 nm.
Temperature was made auto-zero taking blank value as 2.5 to 3 ml of solution. Every
replicates was recorded for a certain absorbance value.
Cuvette was thoroughly cleaned and washed with water after each measurement.
⊘ This is a preview!⊘
Do you want full access?
Subscribe today to unlock all pages.
Trusted by 1+ million students worldwide
6LAB ASSAY REPORT
A calibrated standard curve to estimate protein concentration was plotted using the
recorded absorbance values.
This calibrated standard curve was used for calculating the estimated protein
concentration in the unknown cellular extract.
We used the software MS excel 2013 for calculations and standard curve plotting.
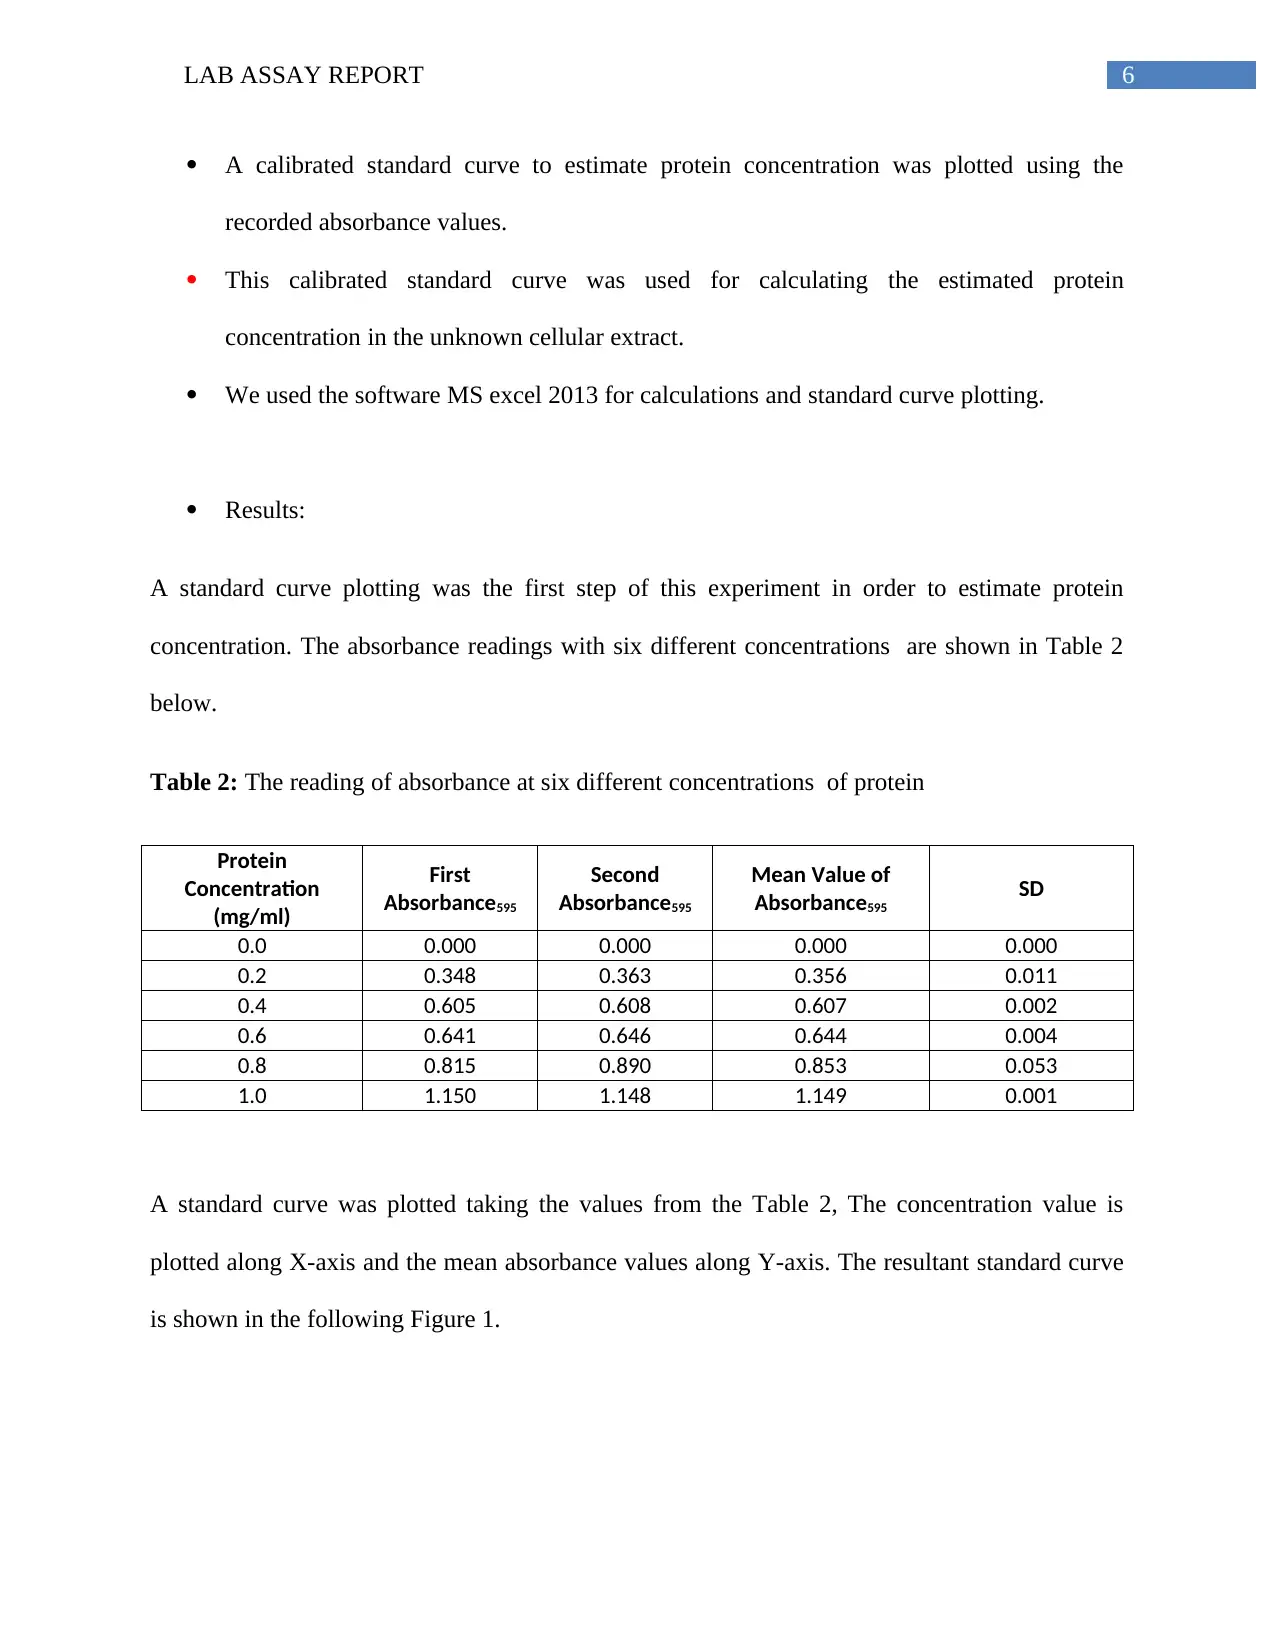
Results:
A standard curve plotting was the first step of this experiment in order to estimate protein
concentration. The absorbance readings with six different concentrations are shown in Table 2
below.
Table 2: The reading of absorbance at six different concentrations of protein
Protein
Concentration
(mg/ml)
First
Absorbance595
Second
Absorbance595
Mean Value of
Absorbance595
SD
0.0 0.000 0.000 0.000 0.000
0.2 0.348 0.363 0.356 0.011
0.4 0.605 0.608 0.607 0.002
0.6 0.641 0.646 0.644 0.004
0.8 0.815 0.890 0.853 0.053
1.0 1.150 1.148 1.149 0.001
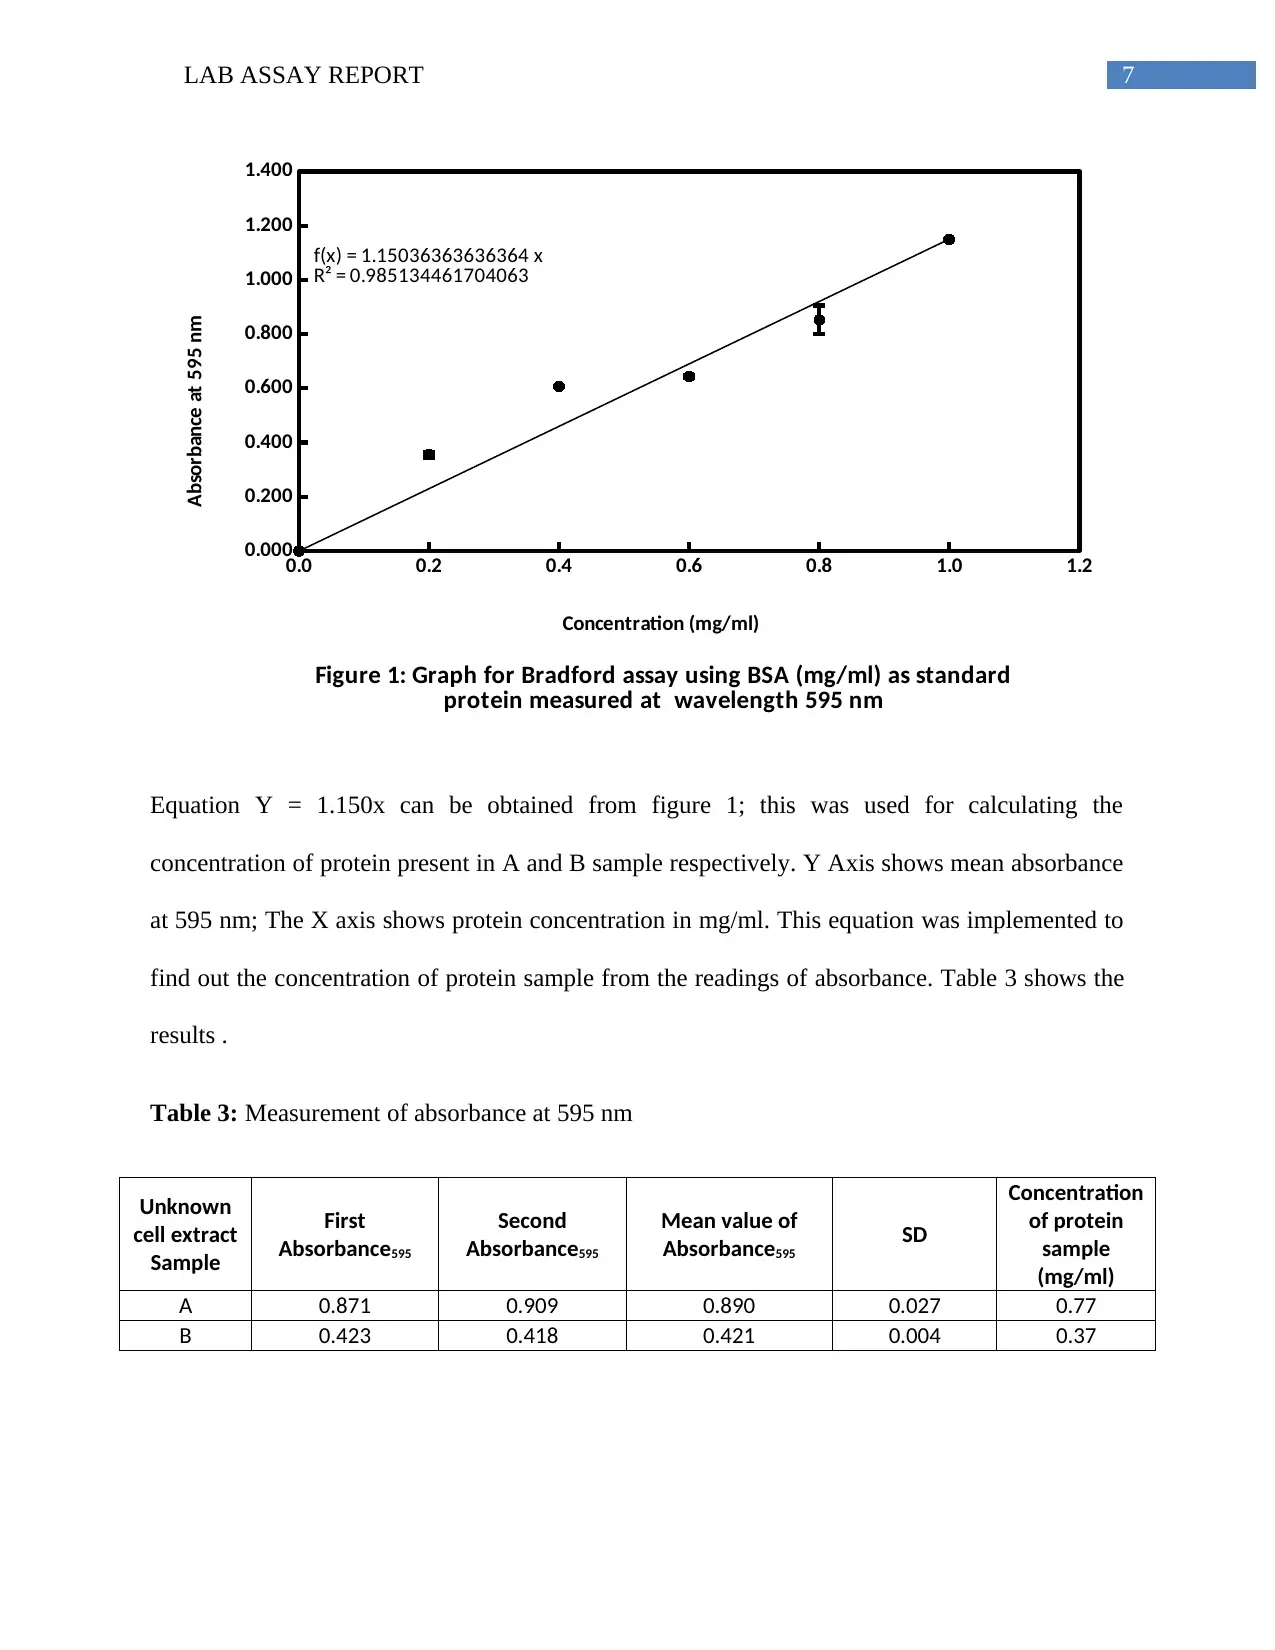
A standard curve was plotted taking the values from the Table 2, The concentration value is
plotted along X-axis and the mean absorbance values along Y-axis. The resultant standard curve
is shown in the following Figure 1.
A calibrated standard curve to estimate protein concentration was plotted using the
recorded absorbance values.
This calibrated standard curve was used for calculating the estimated protein
concentration in the unknown cellular extract.
We used the software MS excel 2013 for calculations and standard curve plotting.
Results:
A standard curve plotting was the first step of this experiment in order to estimate protein
concentration. The absorbance readings with six different concentrations are shown in Table 2
below.
Table 2: The reading of absorbance at six different concentrations of protein
Protein
Concentration
(mg/ml)
First
Absorbance595
Second
Absorbance595
Mean Value of
Absorbance595
SD
0.0 0.000 0.000 0.000 0.000
0.2 0.348 0.363 0.356 0.011
0.4 0.605 0.608 0.607 0.002
0.6 0.641 0.646 0.644 0.004
0.8 0.815 0.890 0.853 0.053
1.0 1.150 1.148 1.149 0.001
A standard curve was plotted taking the values from the Table 2, The concentration value is
plotted along X-axis and the mean absorbance values along Y-axis. The resultant standard curve
is shown in the following Figure 1.
Paraphrase This Document
Need a fresh take? Get an instant paraphrase of this document with our AI Paraphraser
7LAB ASSAY REPORT
0.0 0.2 0.4 0.6 0.8 1.0 1.2
0.000
0.200
0.400
0.600
0.800
1.000
1.200
1.400
f(x) = 1.15036363636364 x
R² = 0.985134461704063
Figure 1: Graph for Bradford assay using BSA (mg/ml) as standard
protein measured at wavelength 595 nm
Concentration (mg/ml)
Absorbance at 595 nm
Equation Y = 1.150x can be obtained from figure 1; this was used for calculating the
concentration of protein present in A and B sample respectively. Y Axis shows mean absorbance
at 595 nm; The X axis shows protein concentration in mg/ml. This equation was implemented to
find out the concentration of protein sample from the readings of absorbance. Table 3 shows the
results .
Table 3: Measurement of absorbance at 595 nm
Unknown
cell extract
Sample
First
Absorbance595
Second
Absorbance595
Mean value of
Absorbance595
SD
Concentration
of protein
sample
(mg/ml)
A 0.871 0.909 0.890 0.027 0.77
B 0.423 0.418 0.421 0.004 0.37
8LAB ASSAY REPORT
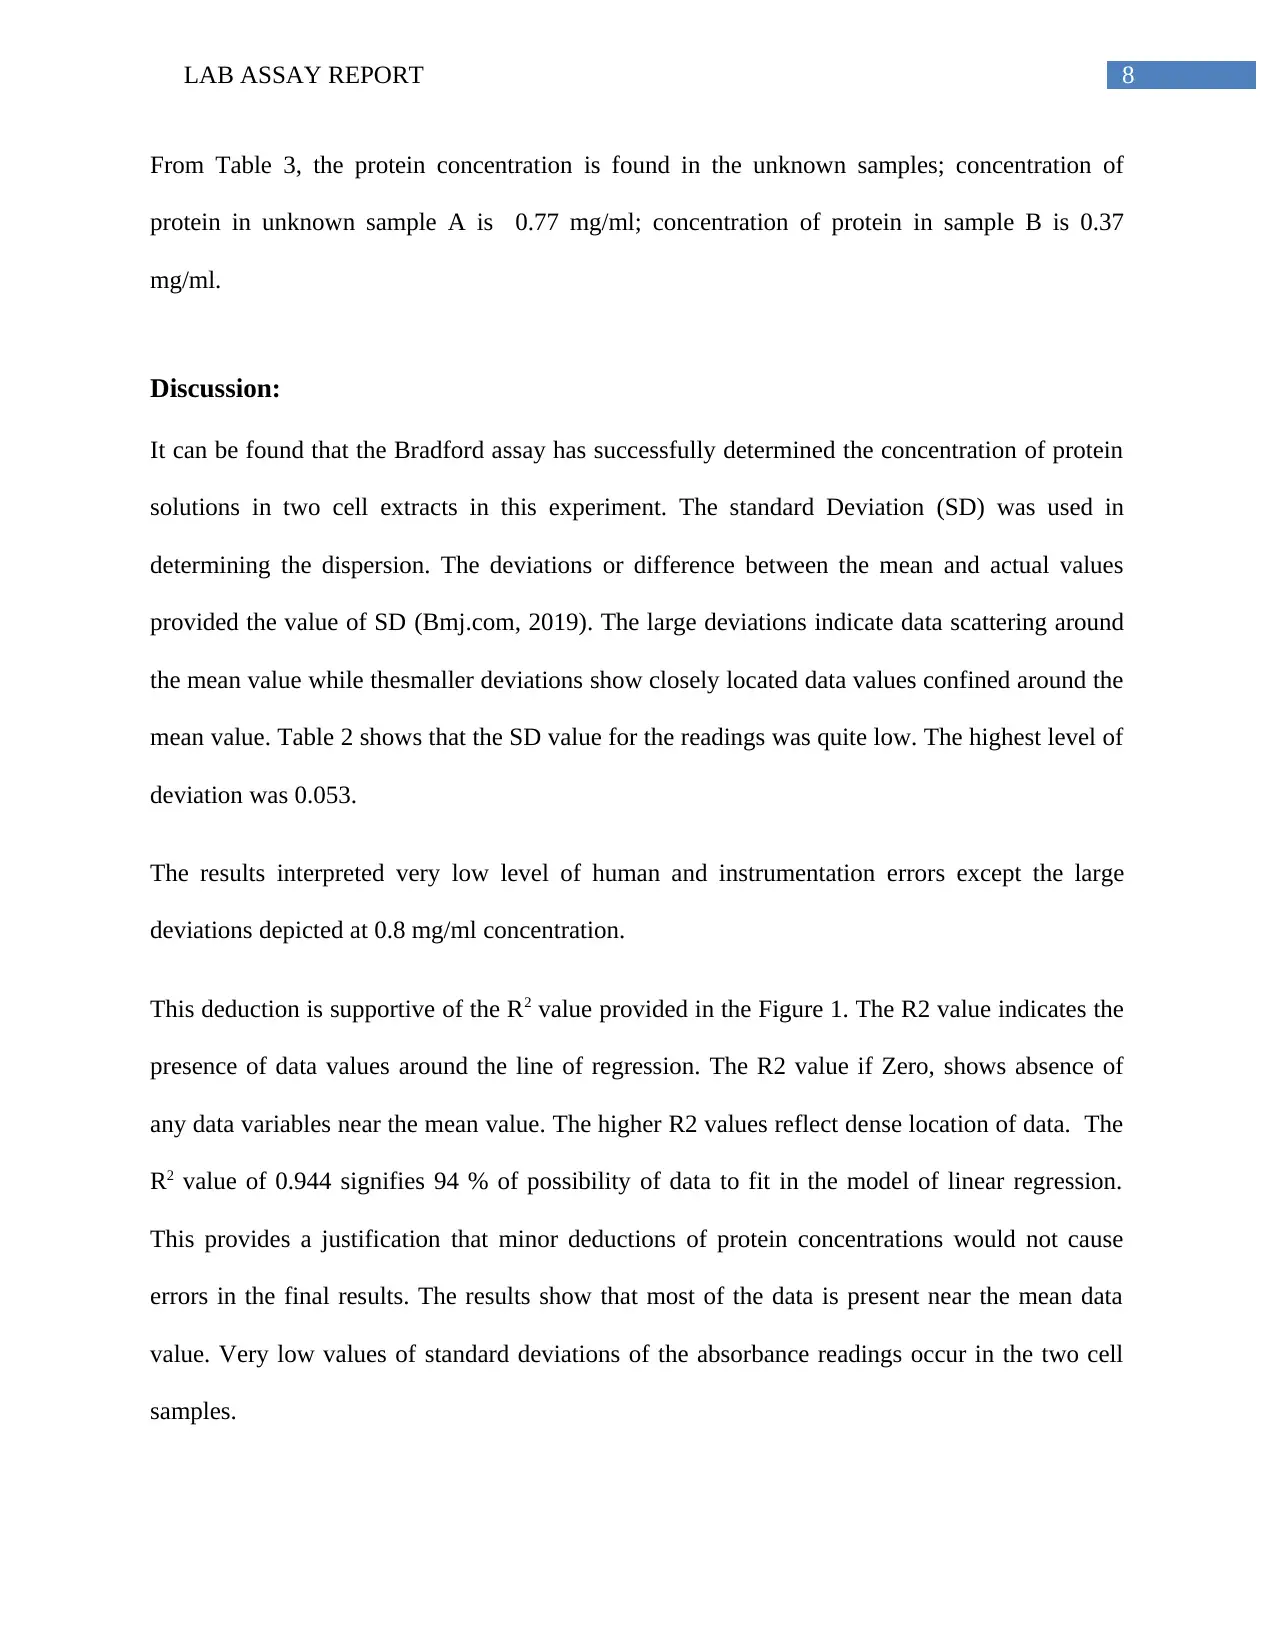
From Table 3, the protein concentration is found in the unknown samples; concentration of
protein in unknown sample A is 0.77 mg/ml; concentration of protein in sample B is 0.37
mg/ml.
Discussion:
It can be found that the Bradford assay has successfully determined the concentration of protein
solutions in two cell extracts in this experiment. The standard Deviation (SD) was used in
determining the dispersion. The deviations or difference between the mean and actual values
provided the value of SD (Bmj.com, 2019). The large deviations indicate data scattering around
the mean value while thesmaller deviations show closely located data values confined around the
mean value. Table 2 shows that the SD value for the readings was quite low. The highest level of
deviation was 0.053.
The results interpreted very low level of human and instrumentation errors except the large
deviations depicted at 0.8 mg/ml concentration.
This deduction is supportive of the R2 value provided in the Figure 1. The R2 value indicates the
presence of data values around the line of regression. The R2 value if Zero, shows absence of
any data variables near the mean value. The higher R2 values reflect dense location of data. The
R2 value of 0.944 signifies 94 % of possibility of data to fit in the model of linear regression.
This provides a justification that minor deductions of protein concentrations would not cause
errors in the final results. The results show that most of the data is present near the mean data
value. Very low values of standard deviations of the absorbance readings occur in the two cell
samples.
⊘ This is a preview!⊘
Do you want full access?
Subscribe today to unlock all pages.
Trusted by 1+ million students worldwide
9LAB ASSAY REPORT
Also, the recorded absorbance values (0.909 to 0.418) as shown in table 3 were identified to be
within the range of absorbance values. Thus we can say that the experimentally calculated
protein concentration present in the unknown samples will be highly accurate. Thus we may
conclude that the overall experimental conduction was accurate with minimum errors, therefore
this minimum error rate can be neglected in the form of instrumental or human errors.
Paraphrase This Document
Need a fresh take? Get an instant paraphrase of this document with our AI Paraphraser
10LAB ASSAY REPORT
References:
Bmj.com. (2019). Mean and standard deviation | The BMJ. Retrieved from
https://www.bmj.com/about-bmj/resources-readers/publications/statistics-square-one/2-
mean-and-standard-deviation
Bio Rad (2019). Bradford Assay. Retrieved from http://www.bio-rad.com/featured/en/bradford-
assay.html
Bradford, M. M. (1976). A rapid and sensitive method for the quantitation of microgram
quantities of protein utilizing the principle of protein-dye binding. Analytical
biochemistry, 72(1-2), 248-254.
Compton, S. J., & Jones, C. G. (1985). Mechanism of dye response and interference in the
Bradford protein assay. Analytical biochemistry, 151(2), 369-374.
Fanger, B. O. (1987). Adaptation of the Bradford protein assay to membrane-bound proteins by
solubilizing in glucopyranoside detergents. Analytical biochemistry, 162(1), 11-17.
Grintzalis, K., Georgiou, C. D., & Schneider, Y. J. (2015). An accurate and sensitive Coomassie
Brilliant Blue G-250-based assay for protein determination. Analytical biochemistry, 480,
28-30.
Olson, B. J. (2016). Assays for determination of protein concentration. Current protocols in
pharmacology, 73(1), A-3A.
Wiśniewski, J. R., & Gaugaz, F. Z. (2015). Fast and sensitive total protein and peptide assays for
proteomic analysis. Analytical chemistry, 87(8), 4110-4116.
1 out of 11


Your All-in-One AI-Powered Toolkit for Academic Success.
+13062052269
info@desklib.com
Available 24*7 on WhatsApp / Email
![[object Object]](/_next/static/media/star-bottom.7253800d.svg)
Unlock your academic potential
Copyright © 2020–2026 A2Z Services. All Rights Reserved. Developed and managed by ZUCOL.