HI5002: Brambles Ltd Financial Analysis and Performance Report
VerifiedAdded on 2023/04/03
|14
|3743
|475
Report
AI Summary
This report provides a comprehensive financial analysis of Brambles Ltd, examining its core business activities and market position. It delves into the company's financial performance using profitability and efficiency ratios, including Return on Equity, Return on Assets, Net Profit Margin, Accounts Receivable Turnover, and Asset Turnover Ratio, over a three-year period. The report assesses cash management, conducts a sensitivity analysis, and identifies both systematic and unsystematic risks. Furthermore, it explores the company's dividend policy. The analysis reveals trends in financial performance, highlighting areas of improvement and potential concerns, with recommendations for future strategies. The report is intended to provide an overview of the company's financial health, performance and position in the market.
Running head: FINANCE FOR BUSINESS
Finance for business
Name of the Student:
Name of the University:
Student ID
Author’s Note:
Finance for business
Name of the Student:
Name of the University:
Student ID
Author’s Note:
Paraphrase This Document
Need a fresh take? Get an instant paraphrase of this document with our AI Paraphraser
1FINANCE FOR BUSINESS
Abstract
Aim of the report is to highlight core activities of Brambles Ltd, analysis of the market
under which it is operating and the factor that may help it to obtain competitive
advantage. This report will even look to assess the performance of the organization on
the basis of the results that would be attained by calculating different kinds of ratios like
profitability and efficiency ratios. The report will even identify the securities that are
marketable for the organization and thereafter discuss about the securities in order to
manage cash. The report will also highlight the systematic as well as unsystematic risks
associated with the company like macro – economic condition, Industry trend,
competitors and safety that may adversely impact the entity’s financial performance. It
will further look upon the dividend policy and dividend payout ratio of the entity.
2FINANCE FOR BUSINESS
Table of Contents
I. Introduction.................................................................................................................4
II. Financial Analysis.......................................................................................................4
2.1 Description of Brambles Ltd.....................................................................................4
2.2 Calculations and analysis of the performance ratios...............................................5
Profitability ratio..........................................................................................................5
Efficiency ratio............................................................................................................6
2.3 Cash management cycle.........................................................................................8
2.4 Sensitivity analysis...................................................................................................8
2.5 Systematic and unsystematic risk..........................................................................10
2.6 Dividend policy.......................................................................................................10
III. Recommendation letter..........................................................................................11
IV. Conclusion.............................................................................................................12
Reference List..................................................................................................................13
⊘ This is a preview!⊘
Do you want full access?
Subscribe today to unlock all pages.
Trusted by 1+ million students worldwide
3FINANCE FOR BUSINESS
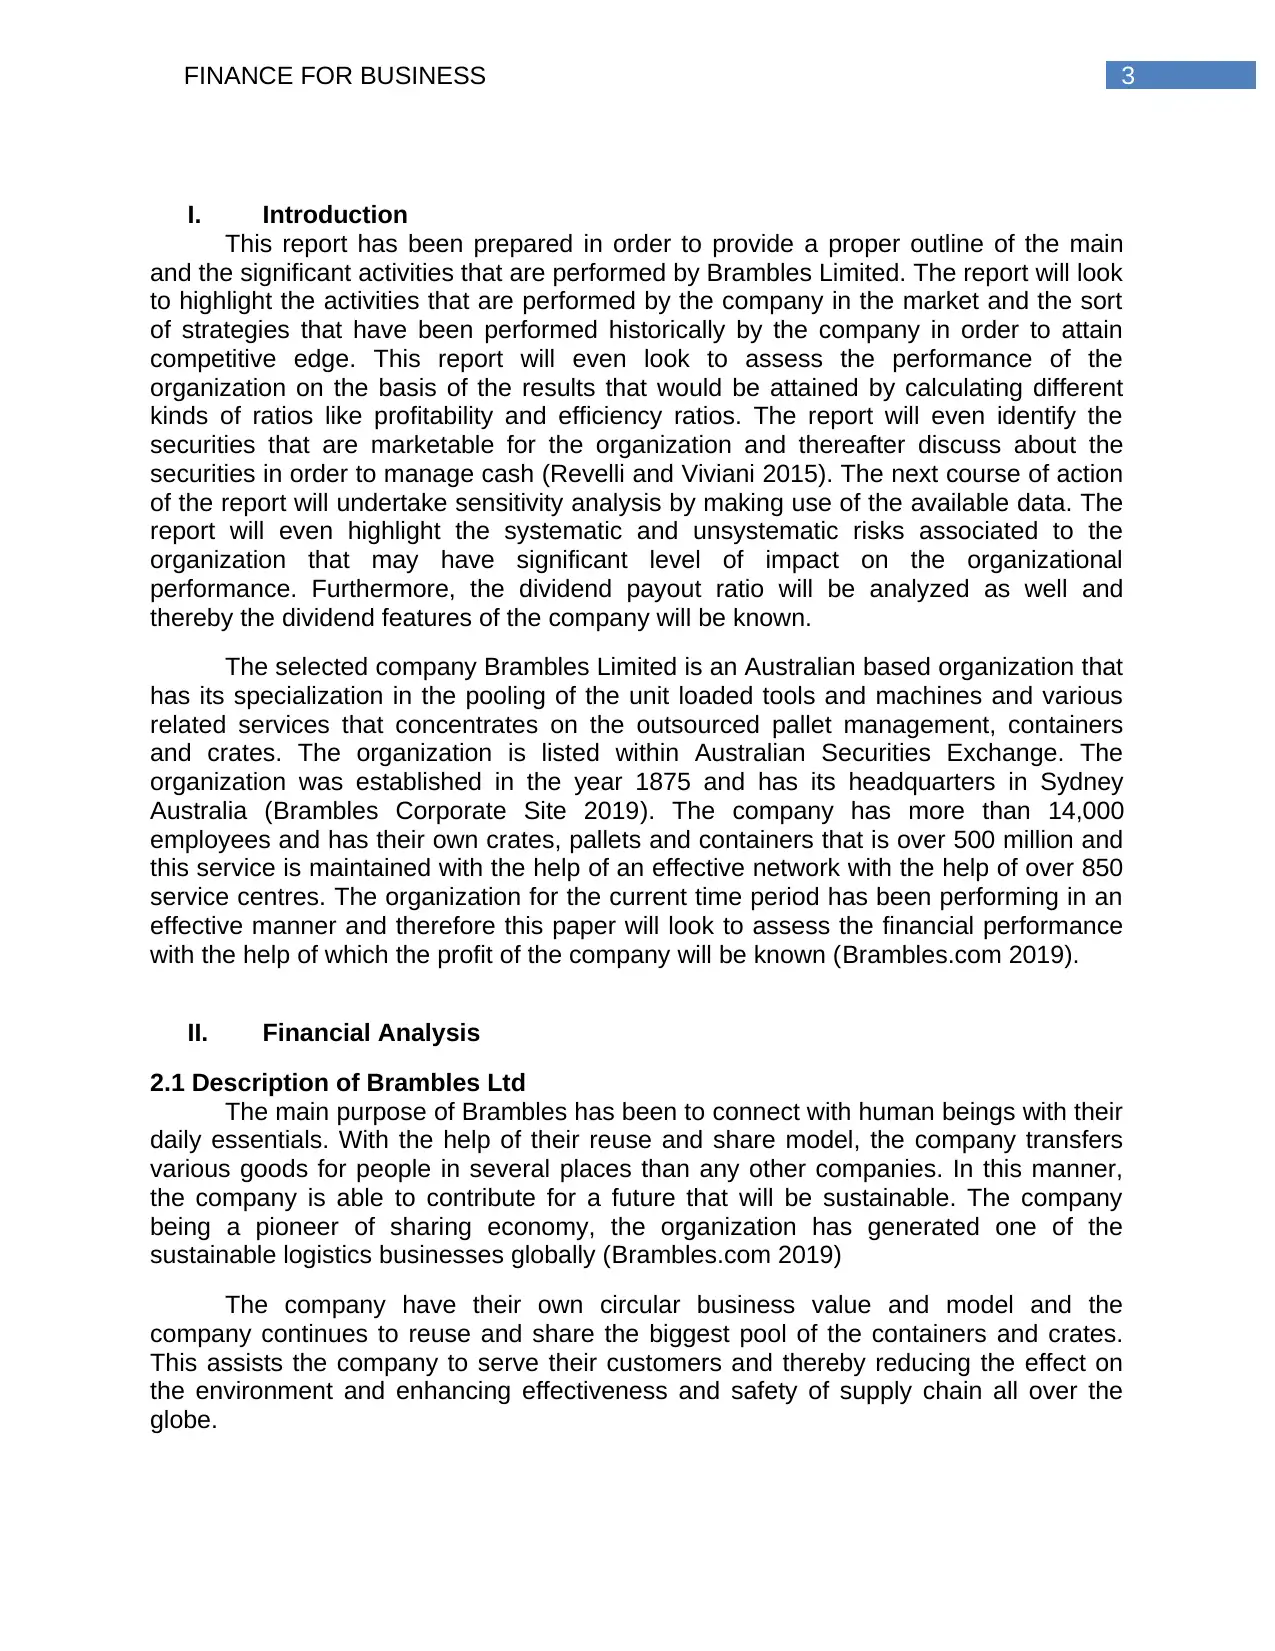
I. Introduction
This report has been prepared in order to provide a proper outline of the main
and the significant activities that are performed by Brambles Limited. The report will look
to highlight the activities that are performed by the company in the market and the sort
of strategies that have been performed historically by the company in order to attain
competitive edge. This report will even look to assess the performance of the
organization on the basis of the results that would be attained by calculating different
kinds of ratios like profitability and efficiency ratios. The report will even identify the
securities that are marketable for the organization and thereafter discuss about the
securities in order to manage cash (Revelli and Viviani 2015). The next course of action
of the report will undertake sensitivity analysis by making use of the available data. The
report will even highlight the systematic and unsystematic risks associated to the
organization that may have significant level of impact on the organizational
performance. Furthermore, the dividend payout ratio will be analyzed as well and
thereby the dividend features of the company will be known.
The selected company Brambles Limited is an Australian based organization that
has its specialization in the pooling of the unit loaded tools and machines and various
related services that concentrates on the outsourced pallet management, containers
and crates. The organization is listed within Australian Securities Exchange. The
organization was established in the year 1875 and has its headquarters in Sydney
Australia (Brambles Corporate Site 2019). The company has more than 14,000
employees and has their own crates, pallets and containers that is over 500 million and
this service is maintained with the help of an effective network with the help of over 850
service centres. The organization for the current time period has been performing in an
effective manner and therefore this paper will look to assess the financial performance
with the help of which the profit of the company will be known (Brambles.com 2019).
II. Financial Analysis
2.1 Description of Brambles Ltd
The main purpose of Brambles has been to connect with human beings with their
daily essentials. With the help of their reuse and share model, the company transfers
various goods for people in several places than any other companies. In this manner,
the company is able to contribute for a future that will be sustainable. The company
being a pioneer of sharing economy, the organization has generated one of the
sustainable logistics businesses globally (Brambles.com 2019)
The company have their own circular business value and model and the
company continues to reuse and share the biggest pool of the containers and crates.
This assists the company to serve their customers and thereby reducing the effect on
the environment and enhancing effectiveness and safety of supply chain all over the
globe.
Paraphrase This Document
Need a fresh take? Get an instant paraphrase of this document with our AI Paraphraser
4FINANCE FOR BUSINESS
The platform of the company creates an invisible background of the world wide
supply chains and primarily serves towards the fast moving consumer goods and
various other industries. In this manner the company is able to maintain their effective
logistics services (Brambles.com 2019)
2.2 Calculations and analysis of the performance ratios
Profitability ratio
Profitability ratio is calculated in order to measure the ability of n organization to
create income after completing sales after incurring the expenses for the performance
of the business. The ratio is utilised by the researchers in order to understand the ability
of the company to create income and thereby provide returns to their shareholders. This
assists in revealing the effectiveness of the organization in making use of their assets in
order to create value and thereby attain profits for their stakeholders (Wagner et al.
2015). The higher value of the ratios addresses the fact that the organization is
performing in an effective manner and thereby attaining increased profits and more and
more revenues.
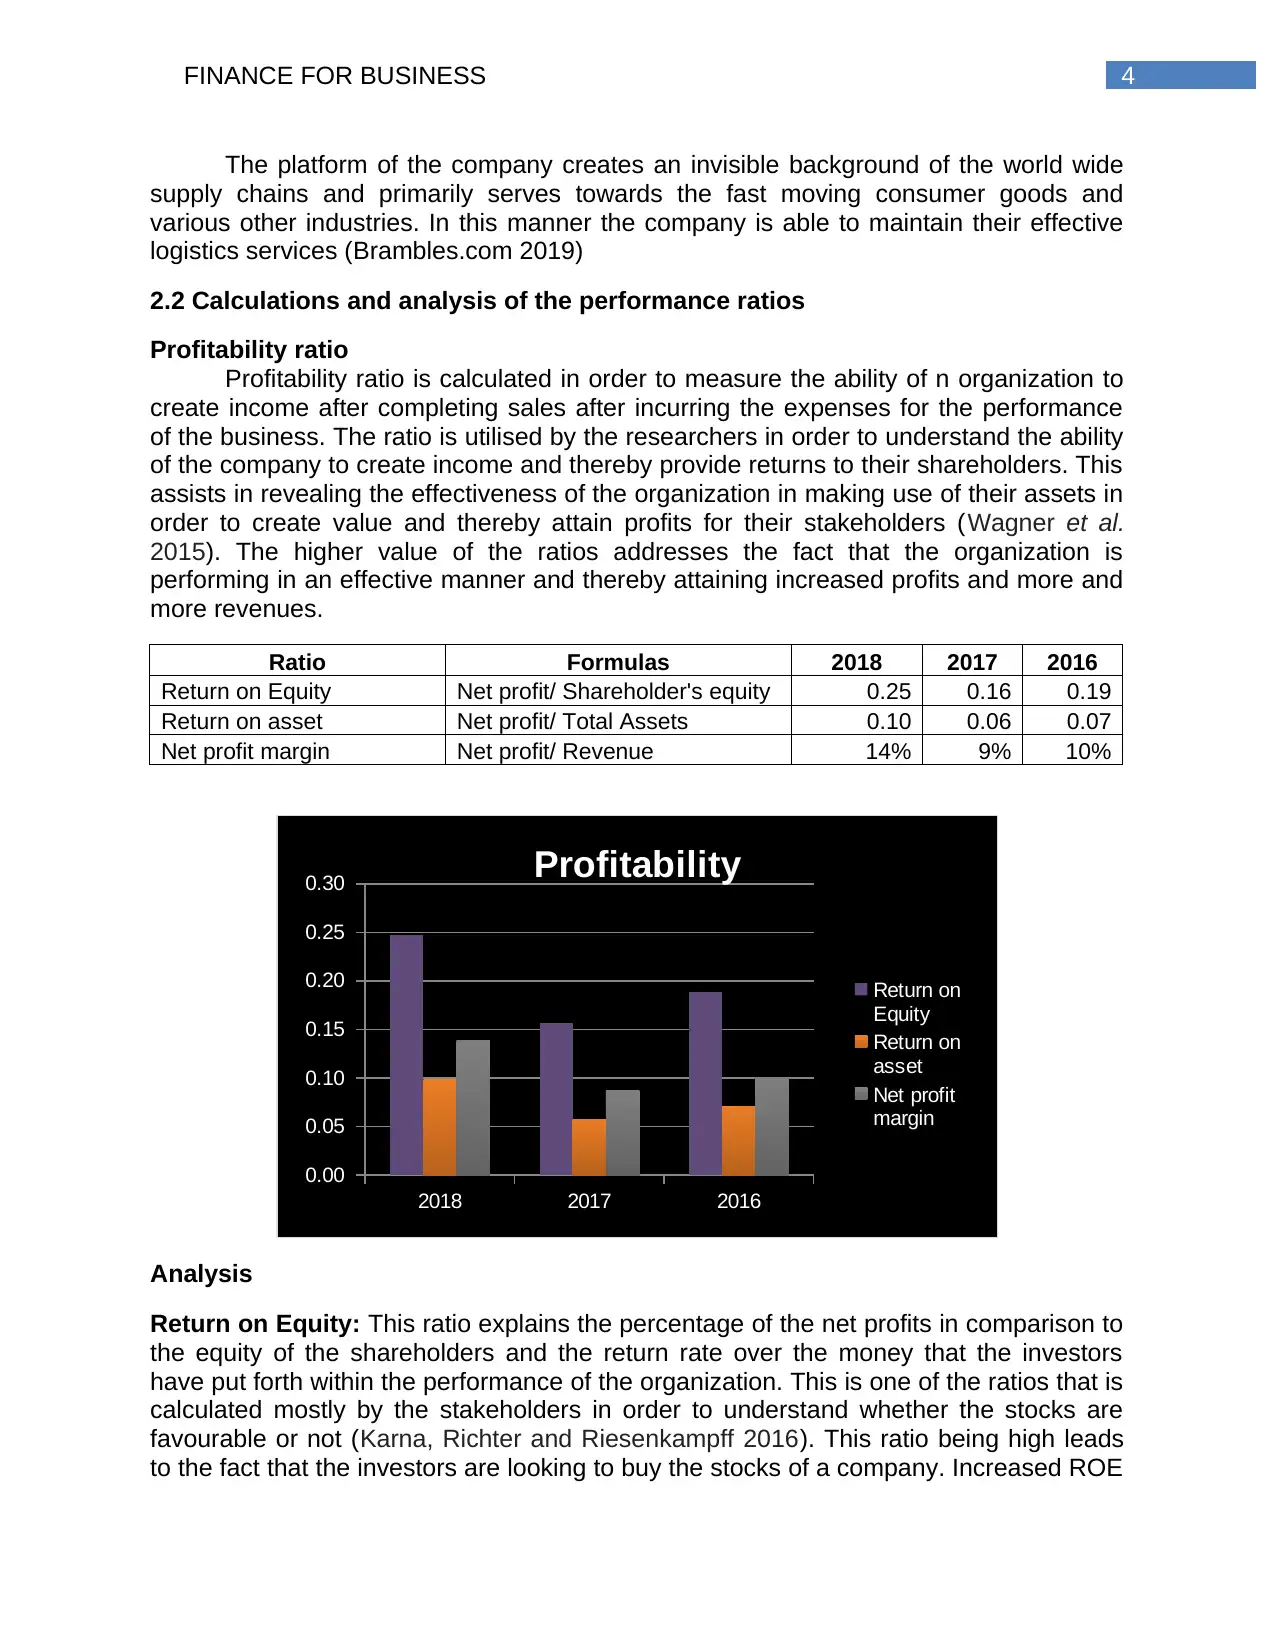
Ratio Formulas 2018 2017 2016
Return on Equity Net profit/ Shareholder's equity 0.25 0.16 0.19
Return on asset Net profit/ Total Assets 0.10 0.06 0.07
Net profit margin Net profit/ Revenue 14% 9% 10%
2018 2017 2016
0.00
0.05
0.10
0.15
0.20
0.25
0.30 Profitability
Return on
Equity
Return on
asset
Net profit
margin
Analysis
Return on Equity: This ratio explains the percentage of the net profits in comparison to
the equity of the shareholders and the return rate over the money that the investors
have put forth within the performance of the organization. This is one of the ratios that is
calculated mostly by the stakeholders in order to understand whether the stocks are
favourable or not (Karna, Richter and Riesenkampff 2016). This ratio being high leads
to the fact that the investors are looking to buy the stocks of a company. Increased ROE
The platform of the company creates an invisible background of the world wide
supply chains and primarily serves towards the fast moving consumer goods and
various other industries. In this manner the company is able to maintain their effective
logistics services (Brambles.com 2019)
2.2 Calculations and analysis of the performance ratios
Profitability ratio
Profitability ratio is calculated in order to measure the ability of n organization to
create income after completing sales after incurring the expenses for the performance
of the business. The ratio is utilised by the researchers in order to understand the ability
of the company to create income and thereby provide returns to their shareholders. This
assists in revealing the effectiveness of the organization in making use of their assets in
order to create value and thereby attain profits for their stakeholders (Wagner et al.
2015). The higher value of the ratios addresses the fact that the organization is
performing in an effective manner and thereby attaining increased profits and more and
more revenues.
Ratio Formulas 2018 2017 2016
Return on Equity Net profit/ Shareholder's equity 0.25 0.16 0.19
Return on asset Net profit/ Total Assets 0.10 0.06 0.07
Net profit margin Net profit/ Revenue 14% 9% 10%
2018 2017 2016
0.00
0.05
0.10
0.15
0.20
0.25
0.30 Profitability
Return on
Equity
Return on
asset
Net profit
margin
Analysis
Return on Equity: This ratio explains the percentage of the net profits in comparison to
the equity of the shareholders and the return rate over the money that the investors
have put forth within the performance of the organization. This is one of the ratios that is
calculated mostly by the stakeholders in order to understand whether the stocks are
favourable or not (Karna, Richter and Riesenkampff 2016). This ratio being high leads
to the fact that the investors are looking to buy the stocks of a company. Increased ROE
5FINANCE FOR BUSINESS
explains that a company is able to create internal cash and therefore the companies rely
less on debt. By looking at the ROE of Brambles Ltd, it can be cited that for the past
three years the ratio of the company has increased. In the year 2016, the ratio was 0.19
and the value declined to 0.16 in the year 2017. However, there has been a significant
level of increase in the year 2018 as the value increased to 0.25. This indicates that the
company has the ability to create its own cash and the ability of the company to
generate profit has increased as well and this explains that the investors are gaining
proper returns out of it (Brambles.com 2019)
Return on Assets: Return on Asset tries to explain the percentage of income in
comparison to the total asset of the organization. This ratio explains the profit after tax
attained by an organization on every dollar of the asset the company has. It even
explains the intensity the asset of the company has on its business performance
(Alexakis et al. 2019). By assessing the performance of Brambles for the last 3 years, it
is seen that the value in the year 2016 has been 0.07 and 0.06 in the year 2017.
However, the value increased in the year 2018 and the value has been 0.10. This
explains that the performance of the company with respect to other years. Therefore,
the ability of the company to create profits with the help of the assets has increased
(Brambles.com 2019)
Net Profit Margin: This ratio looks into the net income of an organization and
undertakes a comparison with the net profit with revenues. In this manner, by assessing
the performance of the company, it can be stated that in 2016, the percentage has been
10%, which reduced to 9% in the year 2017 (Lakshmi, Martin and Venkatesan 2015).
However, the percentage increased to 14% in the year 2018. Hence, it can be said that
the capability of the company in creating profits has increased with the help of
revenues. It is therefore seen that the performance of the company has improved in
accordance to the last year (Brambles.com 2019)
Efficiency ratio
Efficiency ratios those are also called as the activity ratios are used for
measuring the efficiency of the entity in context of deploying its assets for generating
earnings. Efficiency ratios focus on the time taken by the company to collect the cash
due from the debtors or the turnover generated by it through deploying its assets.
Efficiency ratios are used by the management to assist in improving the performance of
the company and is used by the by the creditors as by the investors to analyse the
profitability of the entity (Ahmed 2015)
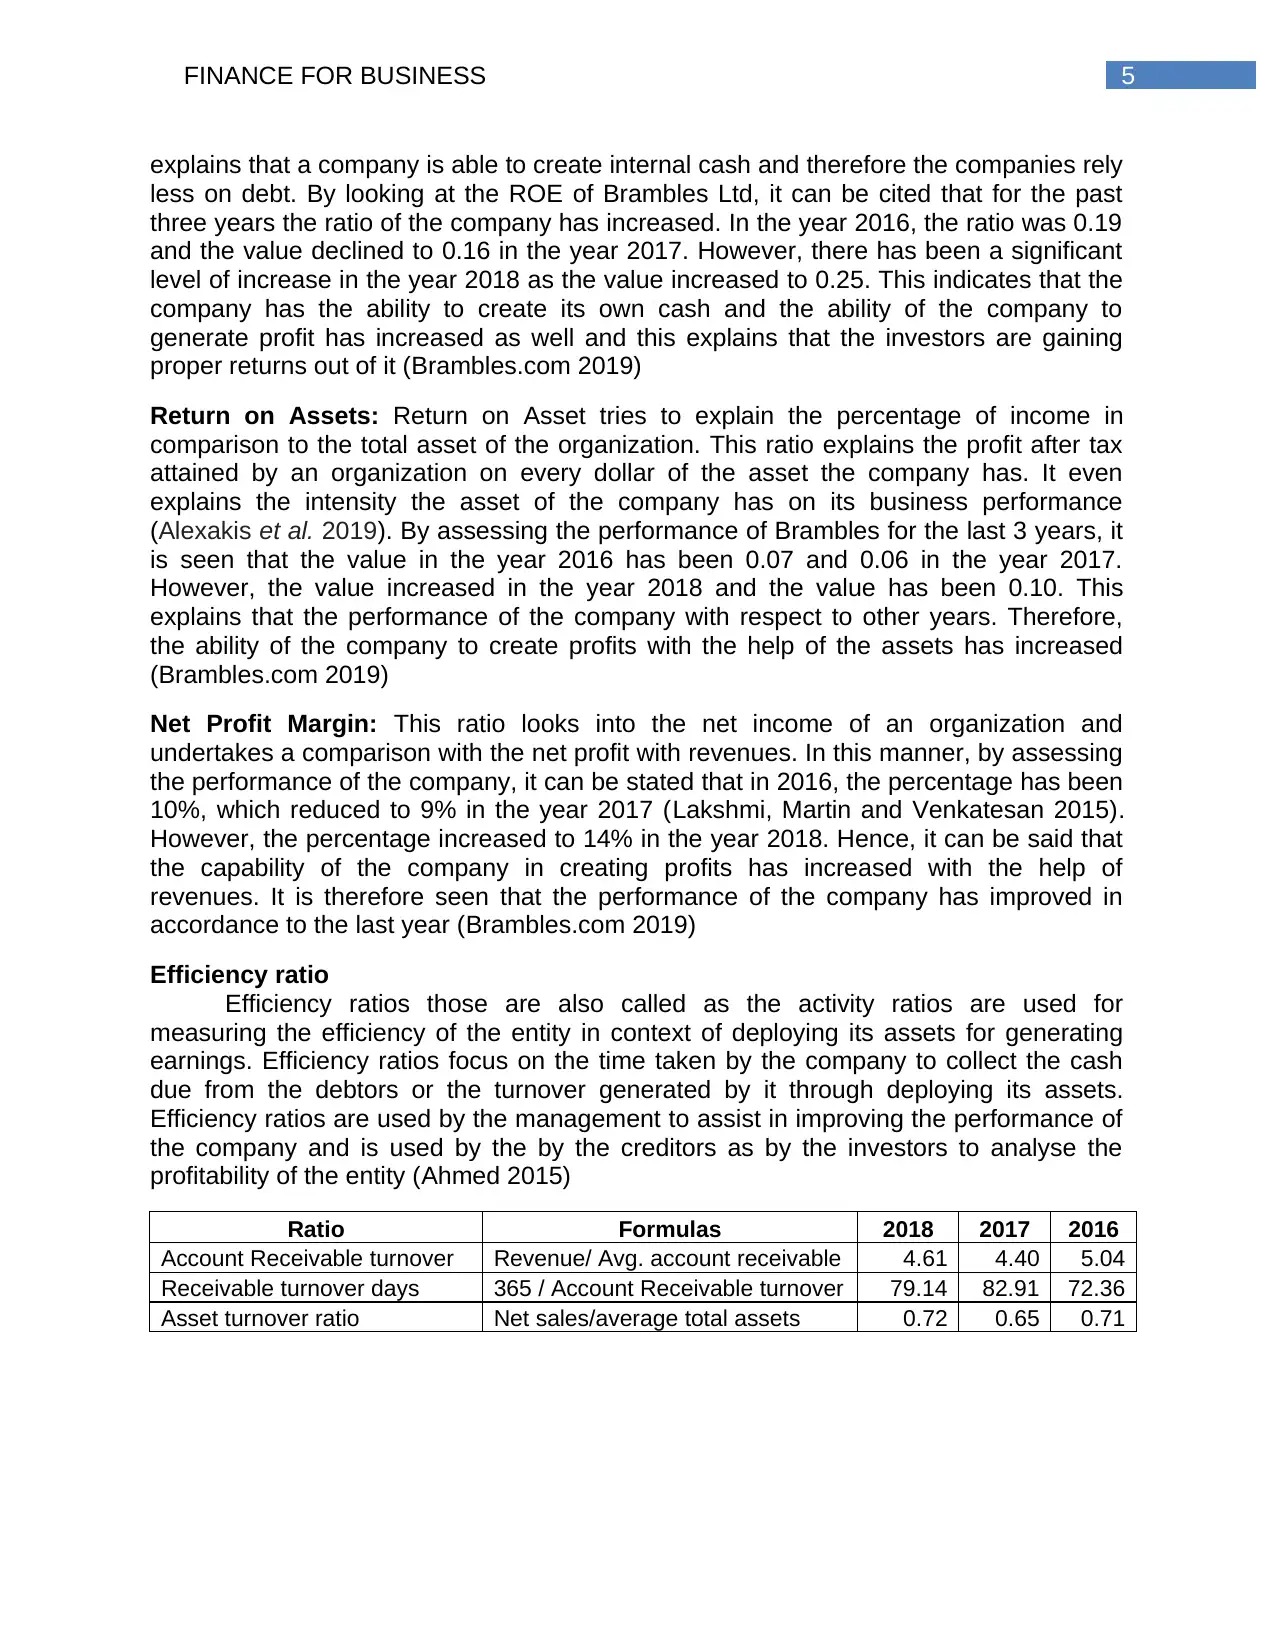
Ratio Formulas 2018 2017 2016
Account Receivable turnover Revenue/ Avg. account receivable 4.61 4.40 5.04
Receivable turnover days 365 / Account Receivable turnover 79.14 82.91 72.36
Asset turnover ratio Net sales/average total assets 0.72 0.65 0.71
explains that a company is able to create internal cash and therefore the companies rely
less on debt. By looking at the ROE of Brambles Ltd, it can be cited that for the past
three years the ratio of the company has increased. In the year 2016, the ratio was 0.19
and the value declined to 0.16 in the year 2017. However, there has been a significant
level of increase in the year 2018 as the value increased to 0.25. This indicates that the
company has the ability to create its own cash and the ability of the company to
generate profit has increased as well and this explains that the investors are gaining
proper returns out of it (Brambles.com 2019)
Return on Assets: Return on Asset tries to explain the percentage of income in
comparison to the total asset of the organization. This ratio explains the profit after tax
attained by an organization on every dollar of the asset the company has. It even
explains the intensity the asset of the company has on its business performance
(Alexakis et al. 2019). By assessing the performance of Brambles for the last 3 years, it
is seen that the value in the year 2016 has been 0.07 and 0.06 in the year 2017.
However, the value increased in the year 2018 and the value has been 0.10. This
explains that the performance of the company with respect to other years. Therefore,
the ability of the company to create profits with the help of the assets has increased
(Brambles.com 2019)
Net Profit Margin: This ratio looks into the net income of an organization and
undertakes a comparison with the net profit with revenues. In this manner, by assessing
the performance of the company, it can be stated that in 2016, the percentage has been
10%, which reduced to 9% in the year 2017 (Lakshmi, Martin and Venkatesan 2015).
However, the percentage increased to 14% in the year 2018. Hence, it can be said that
the capability of the company in creating profits has increased with the help of
revenues. It is therefore seen that the performance of the company has improved in
accordance to the last year (Brambles.com 2019)
Efficiency ratio
Efficiency ratios those are also called as the activity ratios are used for
measuring the efficiency of the entity in context of deploying its assets for generating
earnings. Efficiency ratios focus on the time taken by the company to collect the cash
due from the debtors or the turnover generated by it through deploying its assets.
Efficiency ratios are used by the management to assist in improving the performance of
the company and is used by the by the creditors as by the investors to analyse the
profitability of the entity (Ahmed 2015)
Ratio Formulas 2018 2017 2016
Account Receivable turnover Revenue/ Avg. account receivable 4.61 4.40 5.04
Receivable turnover days 365 / Account Receivable turnover 79.14 82.91 72.36
Asset turnover ratio Net sales/average total assets 0.72 0.65 0.71
⊘ This is a preview!⊘
Do you want full access?
Subscribe today to unlock all pages.
Trusted by 1+ million students worldwide
6FINANCE FOR BUSINESS
2018 2017 2016
0.00
1.00
2.00
3.00
4.00
5.00
6.00 Efficiency
Account
Receivable
turnover
Asset turnover
rtaio
Analysis
Accounts receivable turnover – it is the efficiency ratio or the activity ratio used for
measuring frequency of the times the entity can turn the accounts receivable into cash
during the concerned period. To be more specific, accounts receivables turnover ratio is
used for measuring how many times the entity is able to collect its dues during the
concerned period (Dokas, Giokas and Tsamis 2014). If the accounts receivable turnover
for the company is looked after it can be observed that the same for the entity has been
reduced from 5.04 times to 4.61 times over the period from 2016 to 2018. This fact can
be established through another aspect that is the receivable turnover days which is
increased from 72.36 days to 79.14 days over the period from 2016 to 2018. This is
signifying that the entity is taking more time in collecting its dues in 2018 as compared
to the 2016 (Brambles.com 2019)
Asset turnover ratio – it is the efficiency ratio that is used for measuring the ability of the
entity to generate sales from the assets through comparing the net sales against the
average total assets. To be more specific, asset turnover ratio reveals efficiency of the
entity in context of deploying its assets for generating sales (Gamayuni 2015). If the
asset turnover ratio for the company is looked after it can be observed that the same for
the entity has been increased from 0.71 to 0.72 over the period from 2016 to 2018.
Hence, the company is able to generate 0.72 cents of earning on each dollar of asset
(Brambles.com 2019)
Ratio trend –
Particulars 2016 2017 2018
Change (2016-
2017)
Change (2017-
2018)
Paraphrase This Document
Need a fresh take? Get an instant paraphrase of this document with our AI Paraphraser
7FINANCE FOR BUSINESS
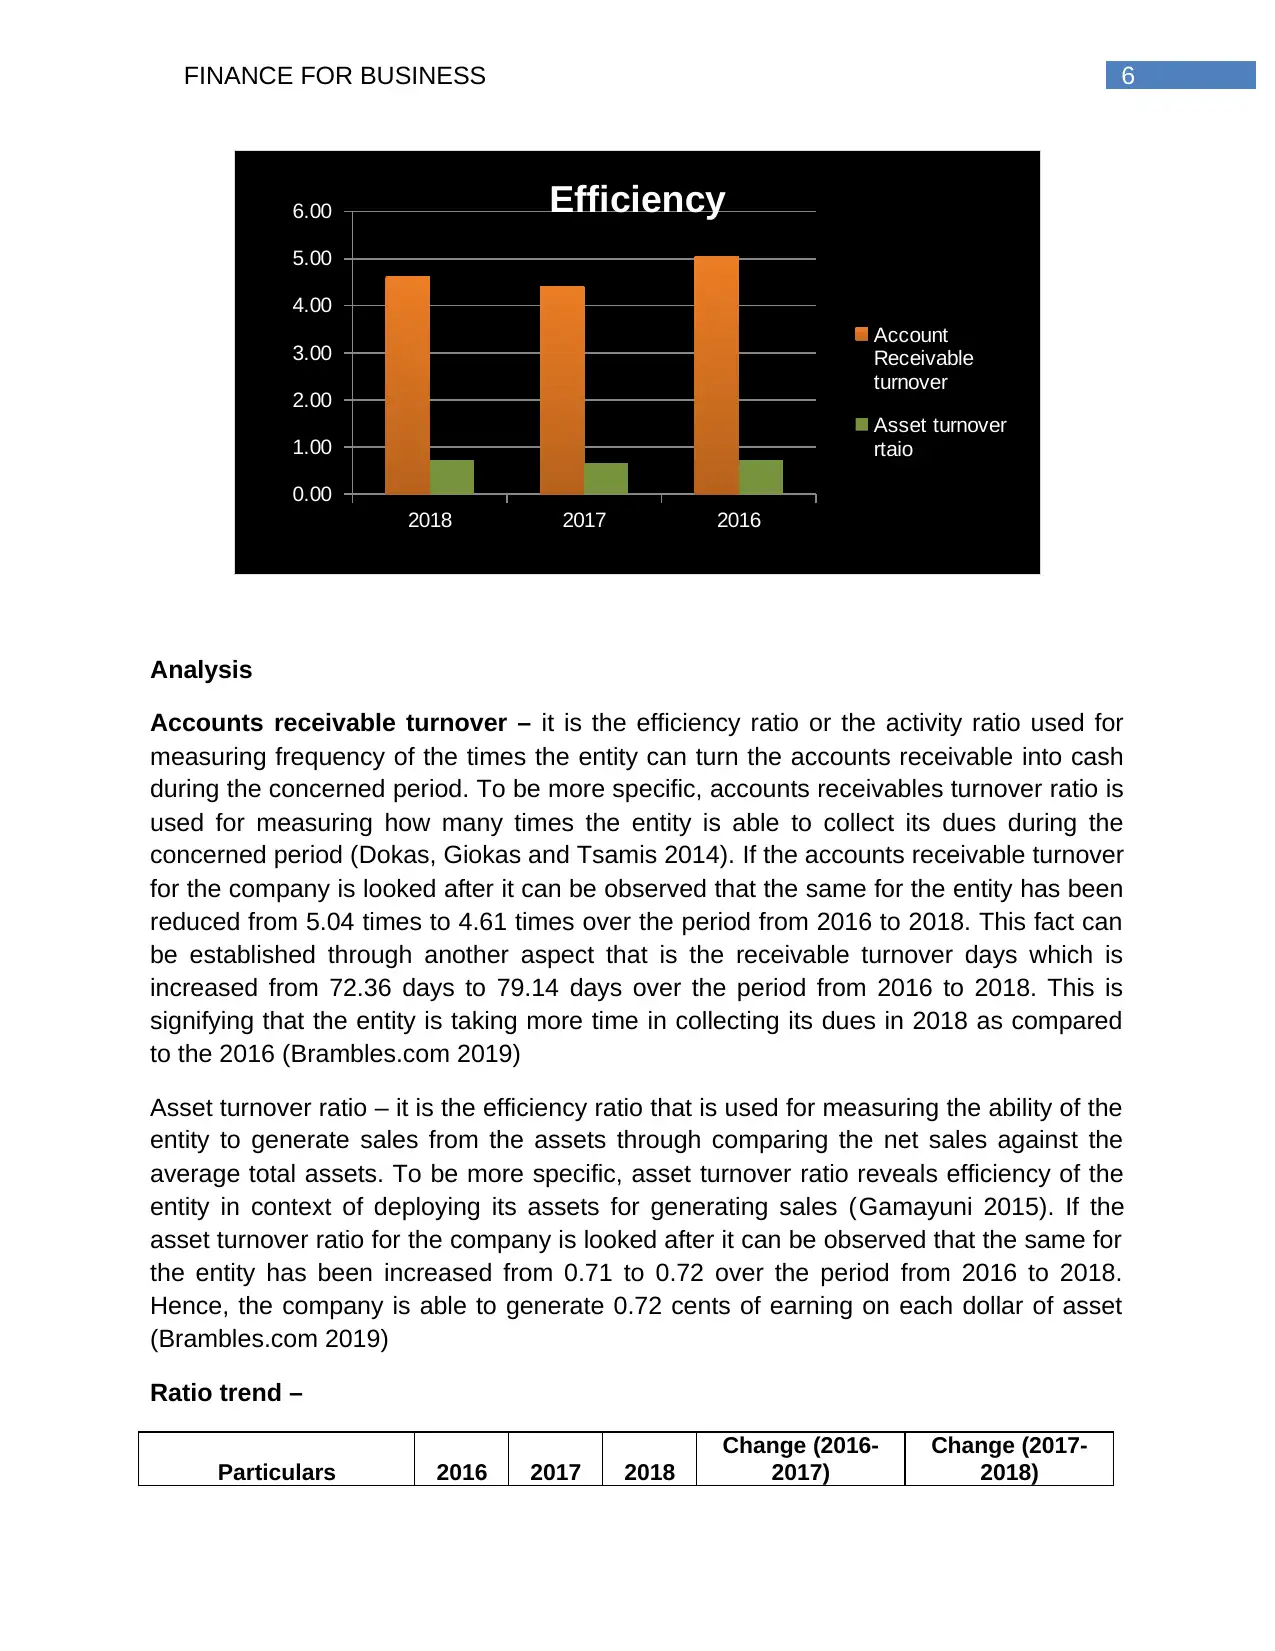
Profitability
Return on Equity 0.1886 0.1563 0.2474 -17.14% 58.33%
Return on asset 0.0706 0.0574 0.0987 -18.65% 71.85%
Net profit margin 0.1007 0.0872 0.1382 -13.44% 58.57%
Efficiency
Account Receivable
turnover 5.0446 4.4022 4.6121 -12.73% 4.77%
Receivable turnover
days
72.355
1
82.913
9
79.139
0 14.59% -4.55%
Asset turnover ratio 0.7147 0.6526 0.7181 -8.69% 10.05%
Looking into the trend of the profitability ratios it can be identified that over the
year from 2016 to 2017 all the profitability ratios of the entity are is reducing trend.
However, if the trend over the period of 2017 to 2018 is considered it can be identified
that the entity is able to improve its profitability position and the profitability ratios over
the same period is in improving trend. On the other hand, if the trend for efficiency ratio
is considered it can be stated that the same over the year from 2016 to 2017 are is
reducing trend. However, if the trend over the period from 2017 to 2018 is considered it
can be identified that the entity is able to improve its efficiency position and the
efficiency ratios over the same period is in improving trend (Omar et al. 2014)
2.3 Cash management cycle
Looking into the annual report of the entity for the year ended 30th June 2018 it
can be recognised that it had reported marketable securities as derivative financial
instruments amounting to $ 5.7 million. Any entity can use the marketable securities for
improving its cash management cycle as the same like any other quick assets can
easily be converted into cash and that too in short span of time. Hence, the marketable
securities can be used by the entity in case there is urgent requirement for cash,
marketable securities that will improve the company’s cash management cycle
(Robinson et al. 2015).
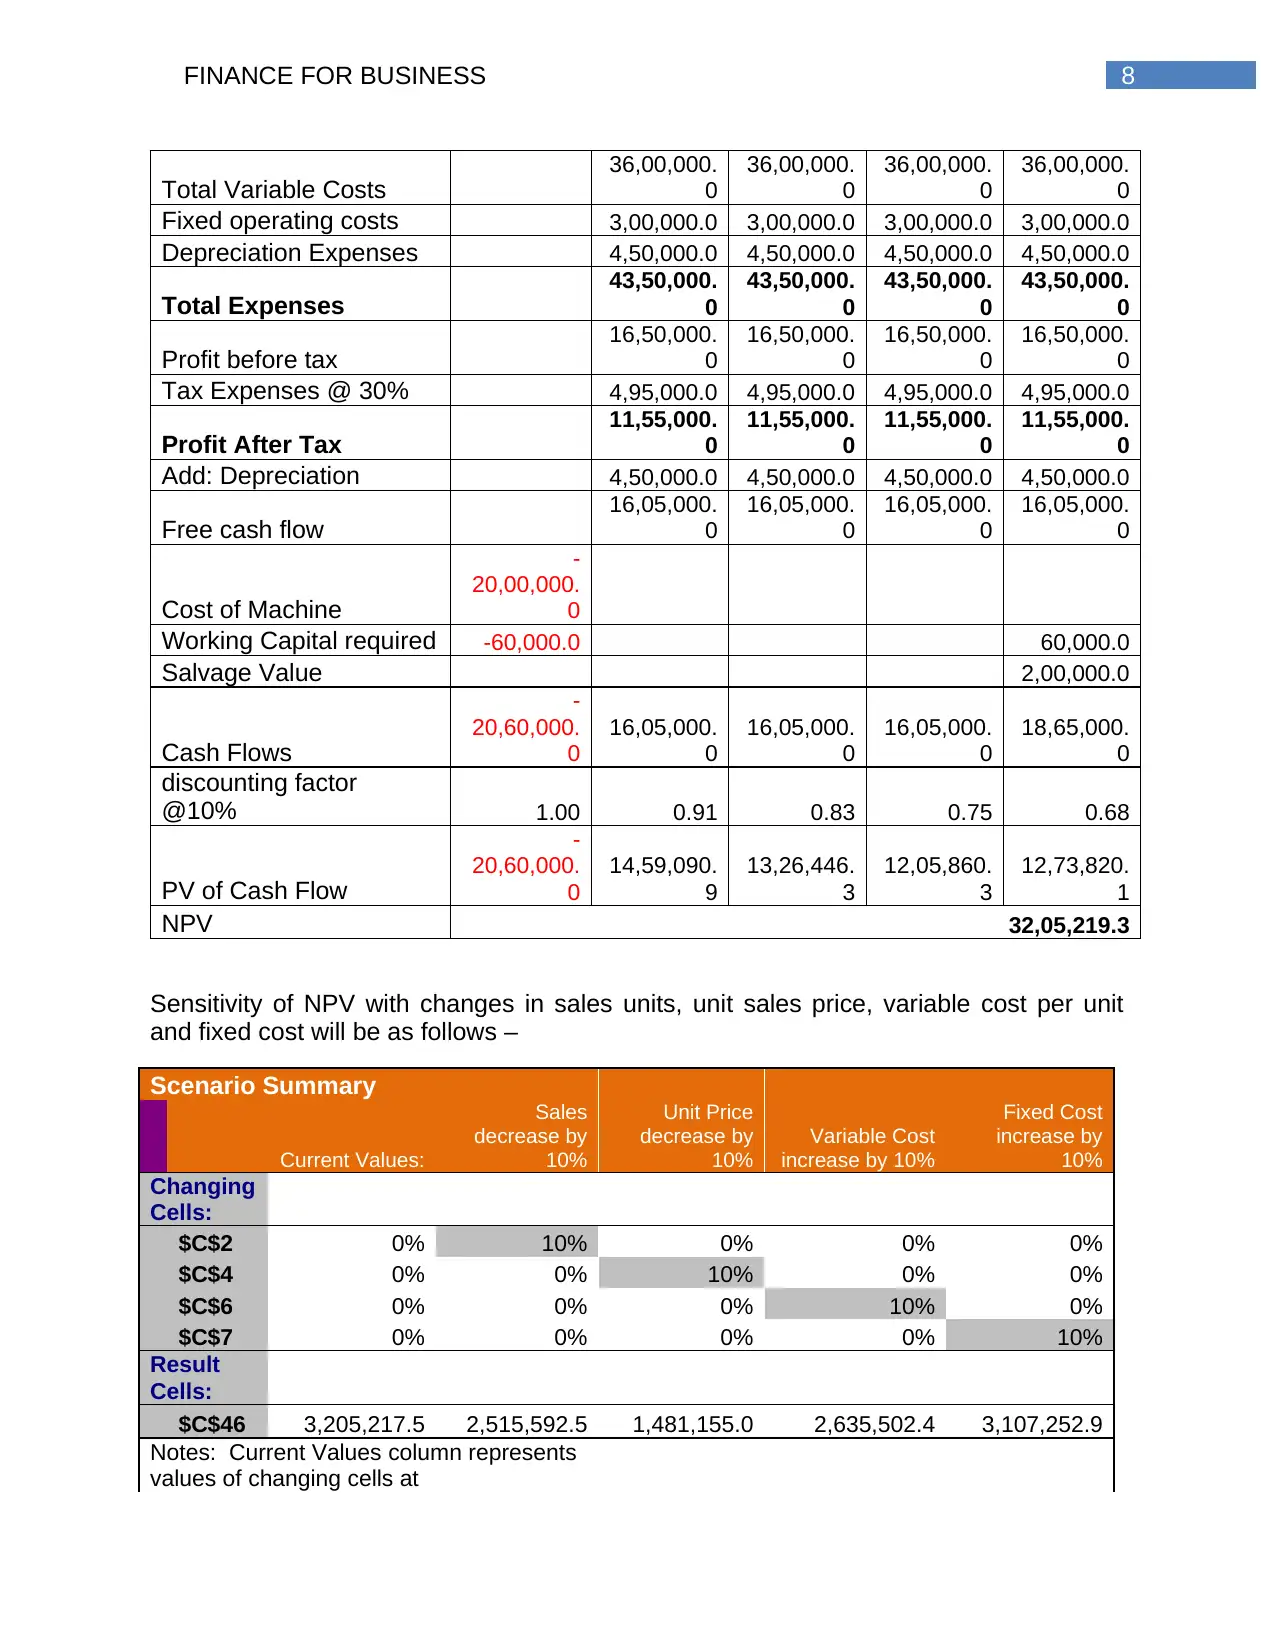
2.4 Sensitivity analysis
Sensitivity analysis is used to determine the way in which different values of
independent variable under the given assumption. This approach is used within the
particular boundaries that are dependent upon one or more than on e variables like
impact of changes in the interest rates has its impact on the prices of bond (Seay 2014).
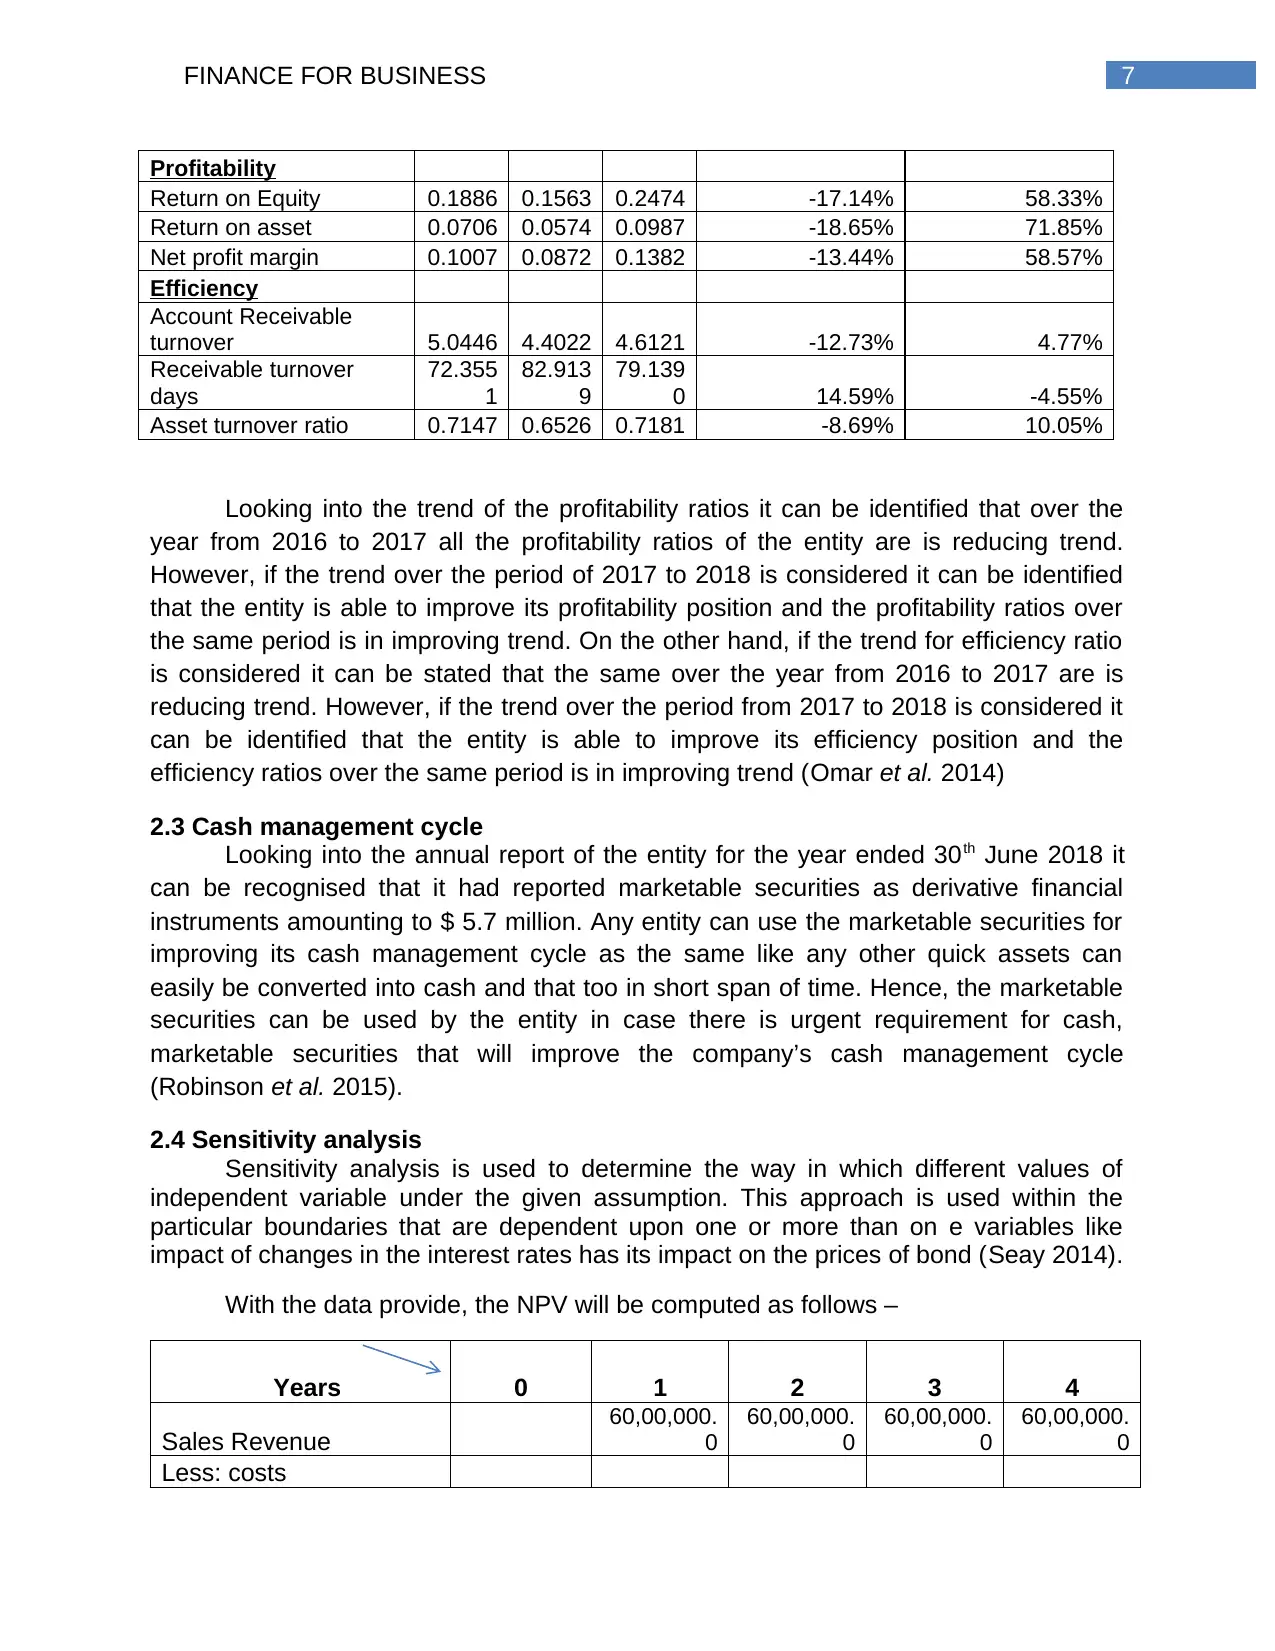
With the data provide, the NPV will be computed as follows –
Years 0 1 2 3 4
Sales Revenue
60,00,000.
0
60,00,000.
0
60,00,000.
0
60,00,000.
0
Less: costs
Profitability
Return on Equity 0.1886 0.1563 0.2474 -17.14% 58.33%
Return on asset 0.0706 0.0574 0.0987 -18.65% 71.85%
Net profit margin 0.1007 0.0872 0.1382 -13.44% 58.57%
Efficiency
Account Receivable
turnover 5.0446 4.4022 4.6121 -12.73% 4.77%
Receivable turnover
days
72.355
1
82.913
9
79.139
0 14.59% -4.55%
Asset turnover ratio 0.7147 0.6526 0.7181 -8.69% 10.05%
Looking into the trend of the profitability ratios it can be identified that over the
year from 2016 to 2017 all the profitability ratios of the entity are is reducing trend.
However, if the trend over the period of 2017 to 2018 is considered it can be identified
that the entity is able to improve its profitability position and the profitability ratios over
the same period is in improving trend. On the other hand, if the trend for efficiency ratio
is considered it can be stated that the same over the year from 2016 to 2017 are is
reducing trend. However, if the trend over the period from 2017 to 2018 is considered it
can be identified that the entity is able to improve its efficiency position and the
efficiency ratios over the same period is in improving trend (Omar et al. 2014)
2.3 Cash management cycle
Looking into the annual report of the entity for the year ended 30th June 2018 it
can be recognised that it had reported marketable securities as derivative financial
instruments amounting to $ 5.7 million. Any entity can use the marketable securities for
improving its cash management cycle as the same like any other quick assets can
easily be converted into cash and that too in short span of time. Hence, the marketable
securities can be used by the entity in case there is urgent requirement for cash,
marketable securities that will improve the company’s cash management cycle
(Robinson et al. 2015).
2.4 Sensitivity analysis
Sensitivity analysis is used to determine the way in which different values of
independent variable under the given assumption. This approach is used within the
particular boundaries that are dependent upon one or more than on e variables like
impact of changes in the interest rates has its impact on the prices of bond (Seay 2014).
With the data provide, the NPV will be computed as follows –
Years 0 1 2 3 4
Sales Revenue
60,00,000.
0
60,00,000.
0
60,00,000.
0
60,00,000.
0
Less: costs
8FINANCE FOR BUSINESS
Total Variable Costs
36,00,000.
0
36,00,000.
0
36,00,000.
0
36,00,000.
0
Fixed operating costs 3,00,000.0 3,00,000.0 3,00,000.0 3,00,000.0
Depreciation Expenses 4,50,000.0 4,50,000.0 4,50,000.0 4,50,000.0
Total Expenses
43,50,000.
0
43,50,000.
0
43,50,000.
0
43,50,000.
0
Profit before tax
16,50,000.
0
16,50,000.
0
16,50,000.
0
16,50,000.
0
Tax Expenses @ 30% 4,95,000.0 4,95,000.0 4,95,000.0 4,95,000.0
Profit After Tax
11,55,000.
0
11,55,000.
0
11,55,000.
0
11,55,000.
0
Add: Depreciation 4,50,000.0 4,50,000.0 4,50,000.0 4,50,000.0
Free cash flow
16,05,000.
0
16,05,000.
0
16,05,000.
0
16,05,000.
0
Cost of Machine
-
20,00,000.
0
Working Capital required -60,000.0 60,000.0
Salvage Value 2,00,000.0
Cash Flows
-
20,60,000.
0
16,05,000.
0
16,05,000.
0
16,05,000.
0
18,65,000.
0
discounting factor
@10% 1.00 0.91 0.83 0.75 0.68
PV of Cash Flow
-
20,60,000.
0
14,59,090.
9
13,26,446.
3
12,05,860.
3
12,73,820.
1
NPV 32,05,219.3
Sensitivity of NPV with changes in sales units, unit sales price, variable cost per unit
and fixed cost will be as follows –
Scenario Summary
Current Values:
Sales
decrease by
10%
Unit Price
decrease by
10%
Variable Cost
increase by 10%
Fixed Cost
increase by
10%
Changing
Cells:
$C$2 0% 10% 0% 0% 0%
$C$4 0% 0% 10% 0% 0%
$C$6 0% 0% 0% 10% 0%
$C$7 0% 0% 0% 0% 10%
Result
Cells:
$C$46 3,205,217.5 2,515,592.5 1,481,155.0 2,635,502.4 3,107,252.9
Notes: Current Values column represents
values of changing cells at
⊘ This is a preview!⊘
Do you want full access?
Subscribe today to unlock all pages.
Trusted by 1+ million students worldwide
9FINANCE FOR BUSINESS
Time Scenario Summary Report was
created. Changing cells for each
Scenarios are highlighted
in gray.
It can be observed from the above table that with reduction in sales price and
number of unit and increase in variable cost as well as fixed cost NPV of the project will
be reduced (Mayes 2014).
2.5 Systematic and unsystematic risk
Systematic risk is the risk arising from the market that will not be controlled by
the entity. On the contrary the unsystematic risks take place dur to issues within the
company (Huang and Kou 2014). The entity is exposed to both systematic as well as
unsystematic risks as mentioned in its annual report as follows –
Systematic risks –
Macro – economic condition – it affects the supply chain or the industry under which the
company operates. It may have adverse impact on the demand of product as well as
services that will in turn, will impact the financial performances.
Industry trend – industry trend like growth of e-commerce, fragmentation of retail supply
chain and demand of the entity’s present service offerings, value of the company’s
existing assets and service offerings that will have adverse impact on the financial
performances (Brambles.com 2019)
Unsystematic risks –
Competitors – the entity operates under the competitive market and the increasing
intensity of the competitors activity mat have an impact on the financial performances
and market penetration.
Safety – the entity is exposed to the inherent operational risks that include road traffic,
industrial hazards, transportation accidents that may lead to serious injury of the fatality
to the contractors, members in public or employees (Brambles.com 2019)
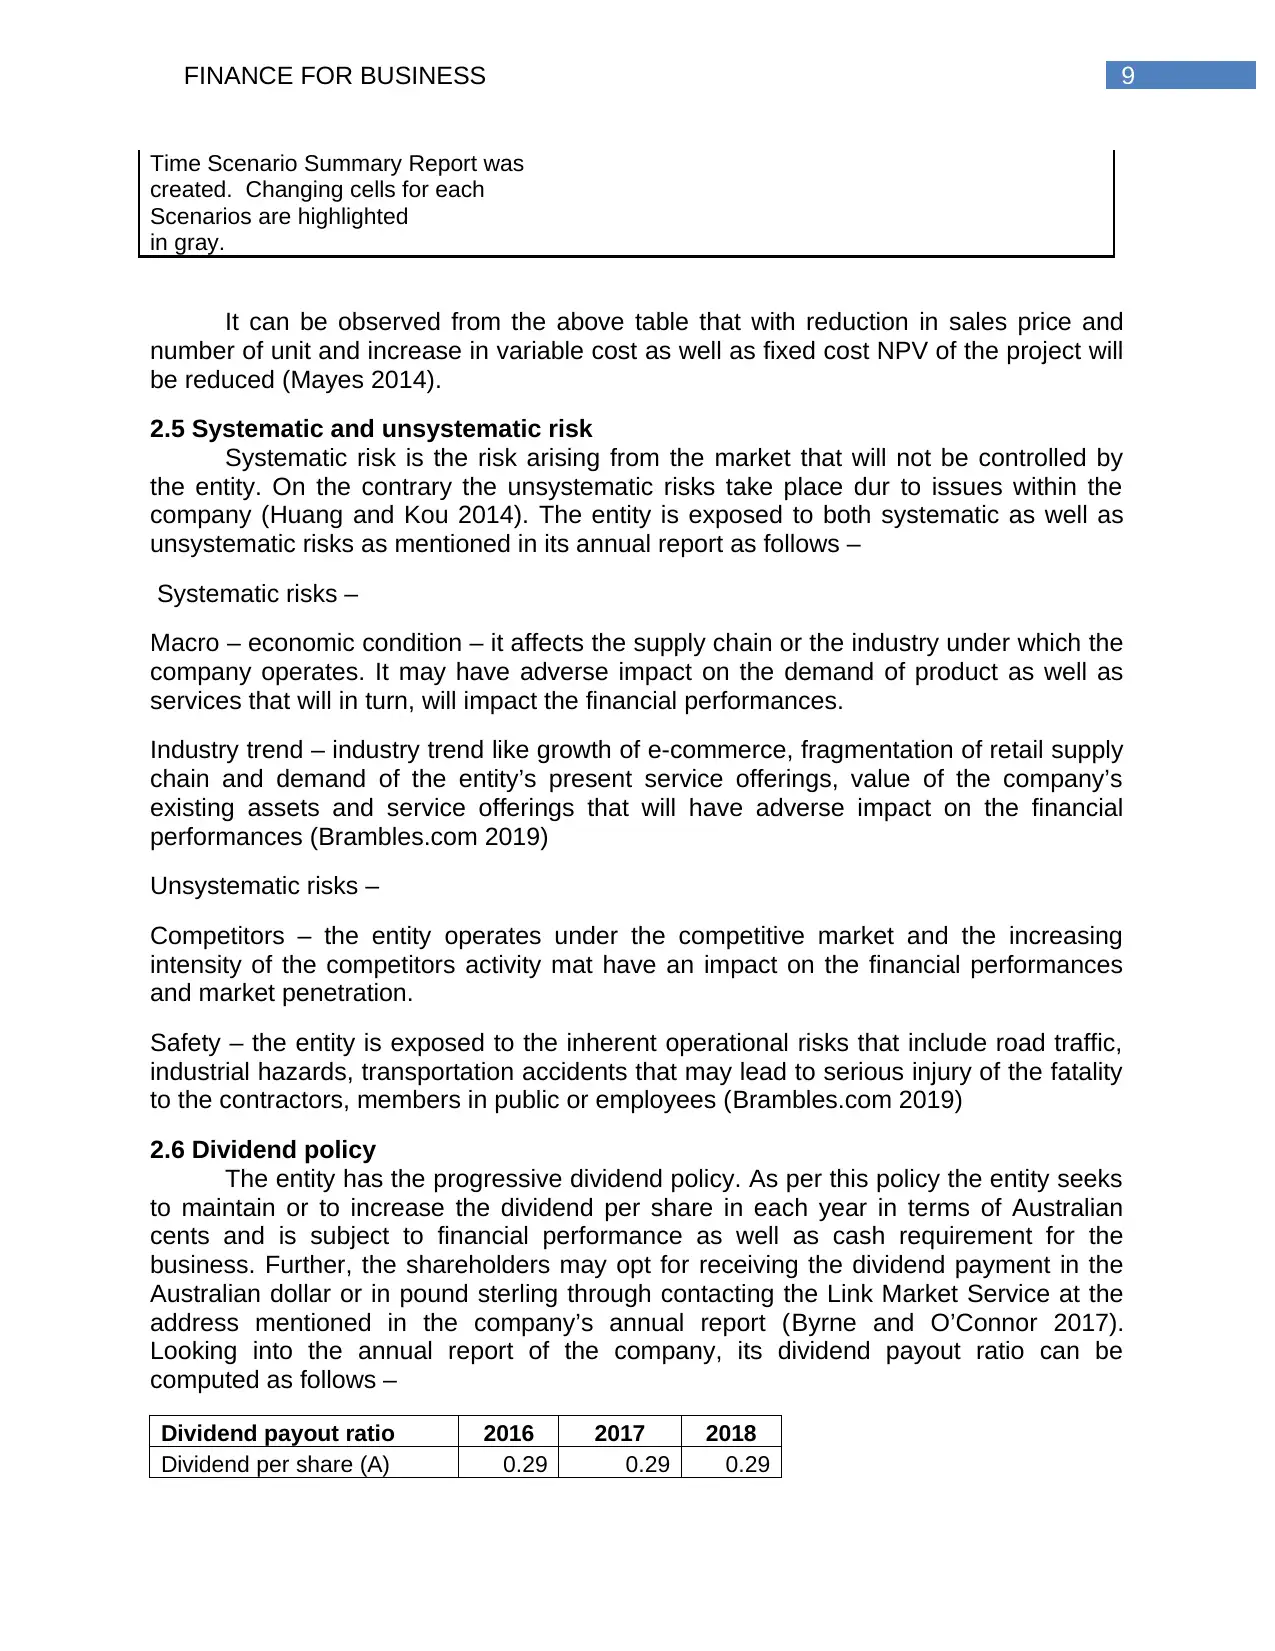
2.6 Dividend policy
The entity has the progressive dividend policy. As per this policy the entity seeks
to maintain or to increase the dividend per share in each year in terms of Australian
cents and is subject to financial performance as well as cash requirement for the
business. Further, the shareholders may opt for receiving the dividend payment in the
Australian dollar or in pound sterling through contacting the Link Market Service at the
address mentioned in the company’s annual report (Byrne and O’Connor 2017).
Looking into the annual report of the company, its dividend payout ratio can be
computed as follows –
Dividend payout ratio 2016 2017 2018
Dividend per share (A) 0.29 0.29 0.29
Time Scenario Summary Report was
created. Changing cells for each
Scenarios are highlighted
in gray.
It can be observed from the above table that with reduction in sales price and
number of unit and increase in variable cost as well as fixed cost NPV of the project will
be reduced (Mayes 2014).
2.5 Systematic and unsystematic risk
Systematic risk is the risk arising from the market that will not be controlled by
the entity. On the contrary the unsystematic risks take place dur to issues within the
company (Huang and Kou 2014). The entity is exposed to both systematic as well as
unsystematic risks as mentioned in its annual report as follows –
Systematic risks –
Macro – economic condition – it affects the supply chain or the industry under which the
company operates. It may have adverse impact on the demand of product as well as
services that will in turn, will impact the financial performances.
Industry trend – industry trend like growth of e-commerce, fragmentation of retail supply
chain and demand of the entity’s present service offerings, value of the company’s
existing assets and service offerings that will have adverse impact on the financial
performances (Brambles.com 2019)
Unsystematic risks –
Competitors – the entity operates under the competitive market and the increasing
intensity of the competitors activity mat have an impact on the financial performances
and market penetration.
Safety – the entity is exposed to the inherent operational risks that include road traffic,
industrial hazards, transportation accidents that may lead to serious injury of the fatality
to the contractors, members in public or employees (Brambles.com 2019)
2.6 Dividend policy
The entity has the progressive dividend policy. As per this policy the entity seeks
to maintain or to increase the dividend per share in each year in terms of Australian
cents and is subject to financial performance as well as cash requirement for the
business. Further, the shareholders may opt for receiving the dividend payment in the
Australian dollar or in pound sterling through contacting the Link Market Service at the
address mentioned in the company’s annual report (Byrne and O’Connor 2017).
Looking into the annual report of the company, its dividend payout ratio can be
computed as follows –
Dividend payout ratio 2016 2017 2018
Dividend per share (A) 0.29 0.29 0.29
Paraphrase This Document
Need a fresh take? Get an instant paraphrase of this document with our AI Paraphraser
10FINANCE FOR BUSINESS
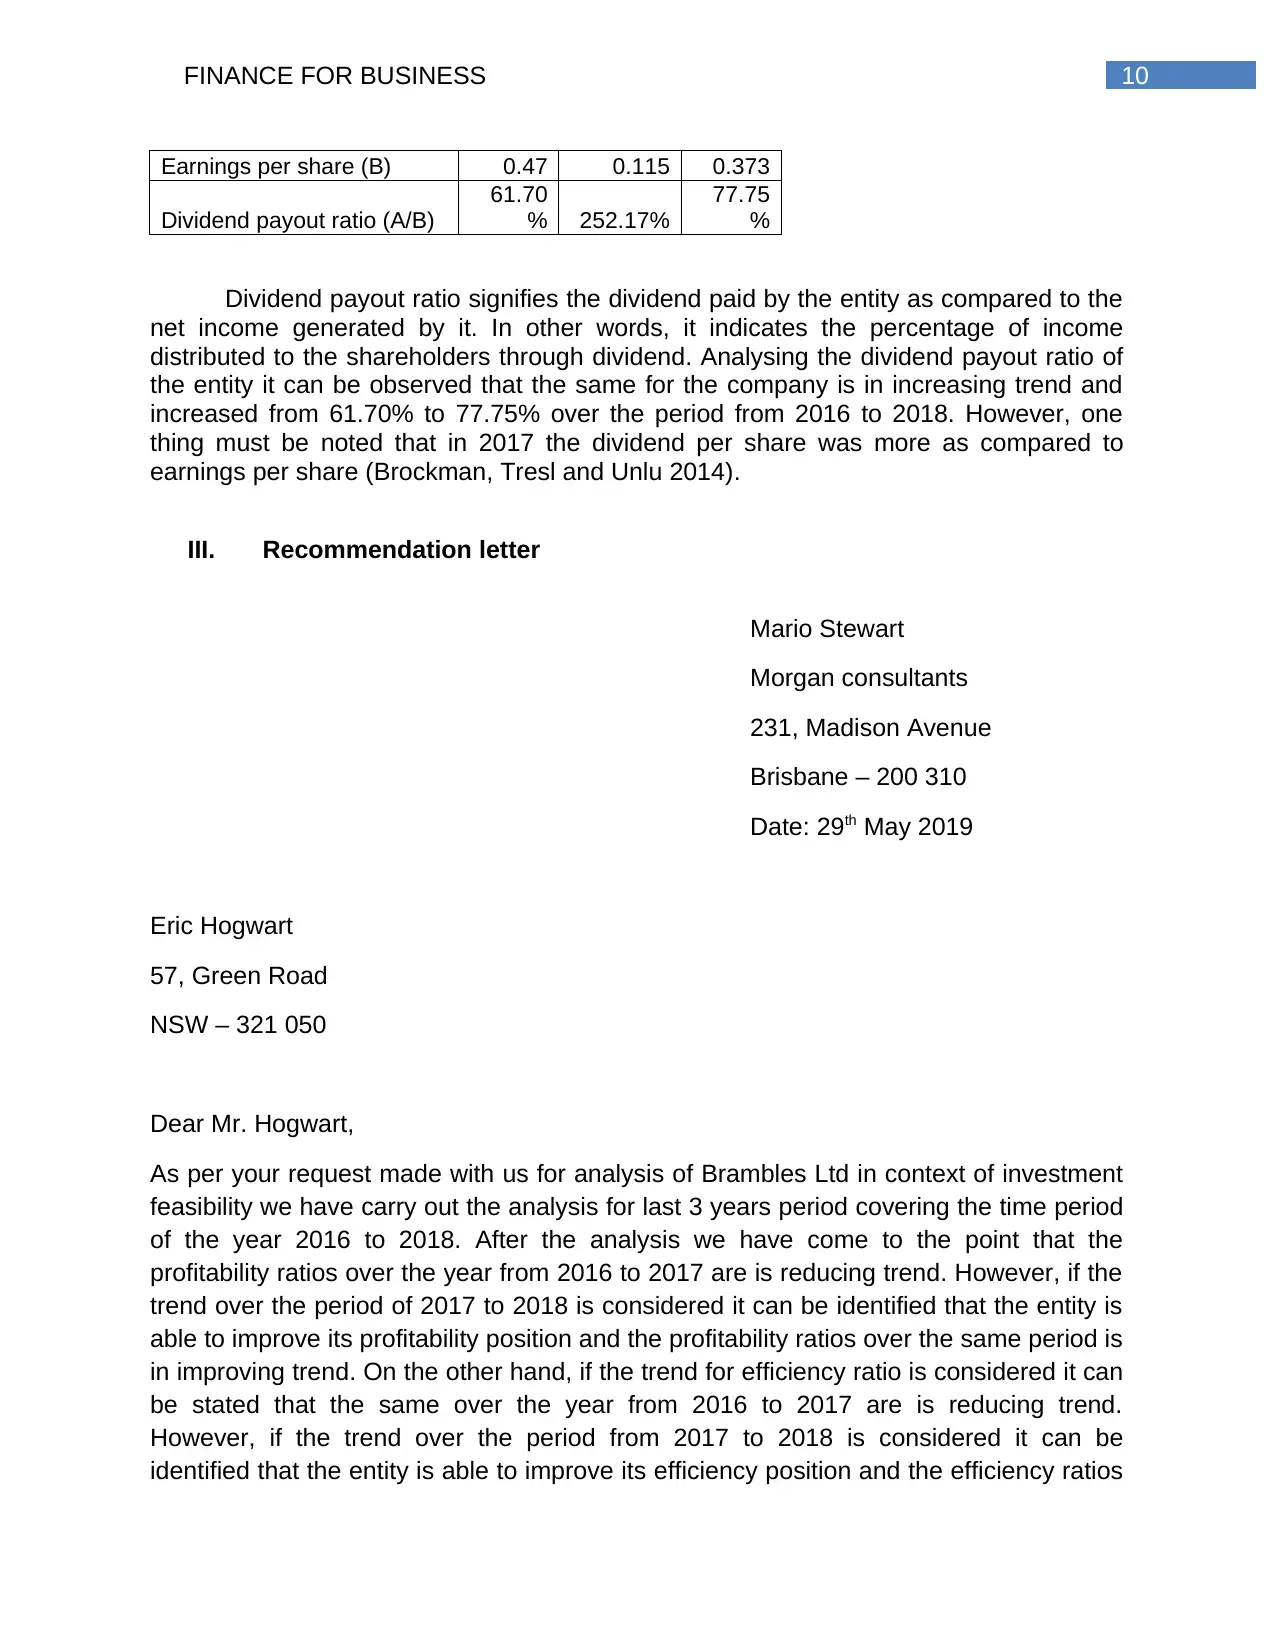
Earnings per share (B) 0.47 0.115 0.373
Dividend payout ratio (A/B)
61.70
% 252.17%
77.75
%
Dividend payout ratio signifies the dividend paid by the entity as compared to the
net income generated by it. In other words, it indicates the percentage of income
distributed to the shareholders through dividend. Analysing the dividend payout ratio of
the entity it can be observed that the same for the company is in increasing trend and
increased from 61.70% to 77.75% over the period from 2016 to 2018. However, one
thing must be noted that in 2017 the dividend per share was more as compared to
earnings per share (Brockman, Tresl and Unlu 2014).
III. Recommendation letter
Mario Stewart
Morgan consultants
231, Madison Avenue
Brisbane – 200 310
Date: 29th May 2019
Eric Hogwart
57, Green Road
NSW – 321 050
Dear Mr. Hogwart,
As per your request made with us for analysis of Brambles Ltd in context of investment
feasibility we have carry out the analysis for last 3 years period covering the time period
of the year 2016 to 2018. After the analysis we have come to the point that the
profitability ratios over the year from 2016 to 2017 are is reducing trend. However, if the
trend over the period of 2017 to 2018 is considered it can be identified that the entity is
able to improve its profitability position and the profitability ratios over the same period is
in improving trend. On the other hand, if the trend for efficiency ratio is considered it can
be stated that the same over the year from 2016 to 2017 are is reducing trend.
However, if the trend over the period from 2017 to 2018 is considered it can be
identified that the entity is able to improve its efficiency position and the efficiency ratios
11FINANCE FOR BUSINESS
over the same period is in improving trend. Further, it is found that the dividend payout
ratio is in rising trend.
Hence, it is recommended that the company shall be considered for the purpose of
investment as it is expected that the entity will be able to provide positive returns to its
shareholders.
Sincerely,
Mario Stewart
Investment analyst, Morgan consultants
IV. Conclusion
Considering the above presented analysis and interpretation it can be concluded
that the company have its own circular business value and model and the company
continues to reuse and share the biggest pool of the containers and crates. Looking into
the financial performance of the company over the past 3 years it can be stated that
though the profitability as well as efficiency ratios are in reducing trend over 2016 to
2017, the entity was able to improve its position and has improved the profitability as
well as efficiency ratios over 2017 to 2018. Further, it can be observed that the dividend
payout ratio for the company is in increasing trend and increased from 61.70% to
77.75% over the period from 2016 to 2018. Hence, the company shall be considered for
the purpose of investment as it is expected that the entity will be able to provide positive
returns to its shareholders.
⊘ This is a preview!⊘
Do you want full access?
Subscribe today to unlock all pages.
Trusted by 1+ million students worldwide
1 out of 14
Related Documents


Your All-in-One AI-Powered Toolkit for Academic Success.
+13062052269
info@desklib.com
Available 24*7 on WhatsApp / Email
![[object Object]](/_next/static/media/star-bottom.7253800d.svg)
Unlock your academic potential
Copyright © 2020–2026 A2Z Services. All Rights Reserved. Developed and managed by ZUCOL.