Case Study: Impact of Brand Value on Sales in the Automotive Industry
VerifiedAdded on 2020/10/05
|17
|4002
|196
Report
AI Summary
This report investigates the influence of brand value on sales performance within the automotive industry, focusing on five major companies: Toyota, BMW, Honda, Daimler, and Volkswagen. The study aims to identify the correlation between brand value and revenue generation, analyzing data from 2013 to 2017. The objectives include assessing brand value's impact on organizational growth, evaluating the effectiveness of capital markets in creating business wealth, developing strategies to improve sales volume, and suggesting solutions to increase market value. The research employs both exploratory and secondary data analysis, utilizing statistical models such as correlation, ANOVA, and regression analysis to determine the relationship between brand value and sales figures. The findings reveal a positive correlation between brand value and sales, indicating that changes in brand value significantly affect sales revenue. The report concludes with recommendations and limitations, providing insights into how automotive companies can leverage brand value to enhance their sales and market position. The analysis includes raw data, correlation analysis, ANOVA, regression analysis and model summary.
Impact of brand value on sales. Case
study, of top 5 automotive industries and
their sales in last 5
study, of top 5 automotive industries and
their sales in last 5
Paraphrase This Document
Need a fresh take? Get an instant paraphrase of this document with our AI Paraphraser
TABLE OF CONTENTS
INTRODUCTION...........................................................................................................................1
Literature Review.............................................................................................................................2
HYPOTHESIS............................................................................................................................5
Findings from secondary data analysis............................................................................................5
Raw data......................................................................................................................................5
DISCUSSION................................................................................................................................10
CONCLUSION INCLUDING RECOMMENDATIONS AND LIMITATION...........................11
REFERENCES..............................................................................................................................13
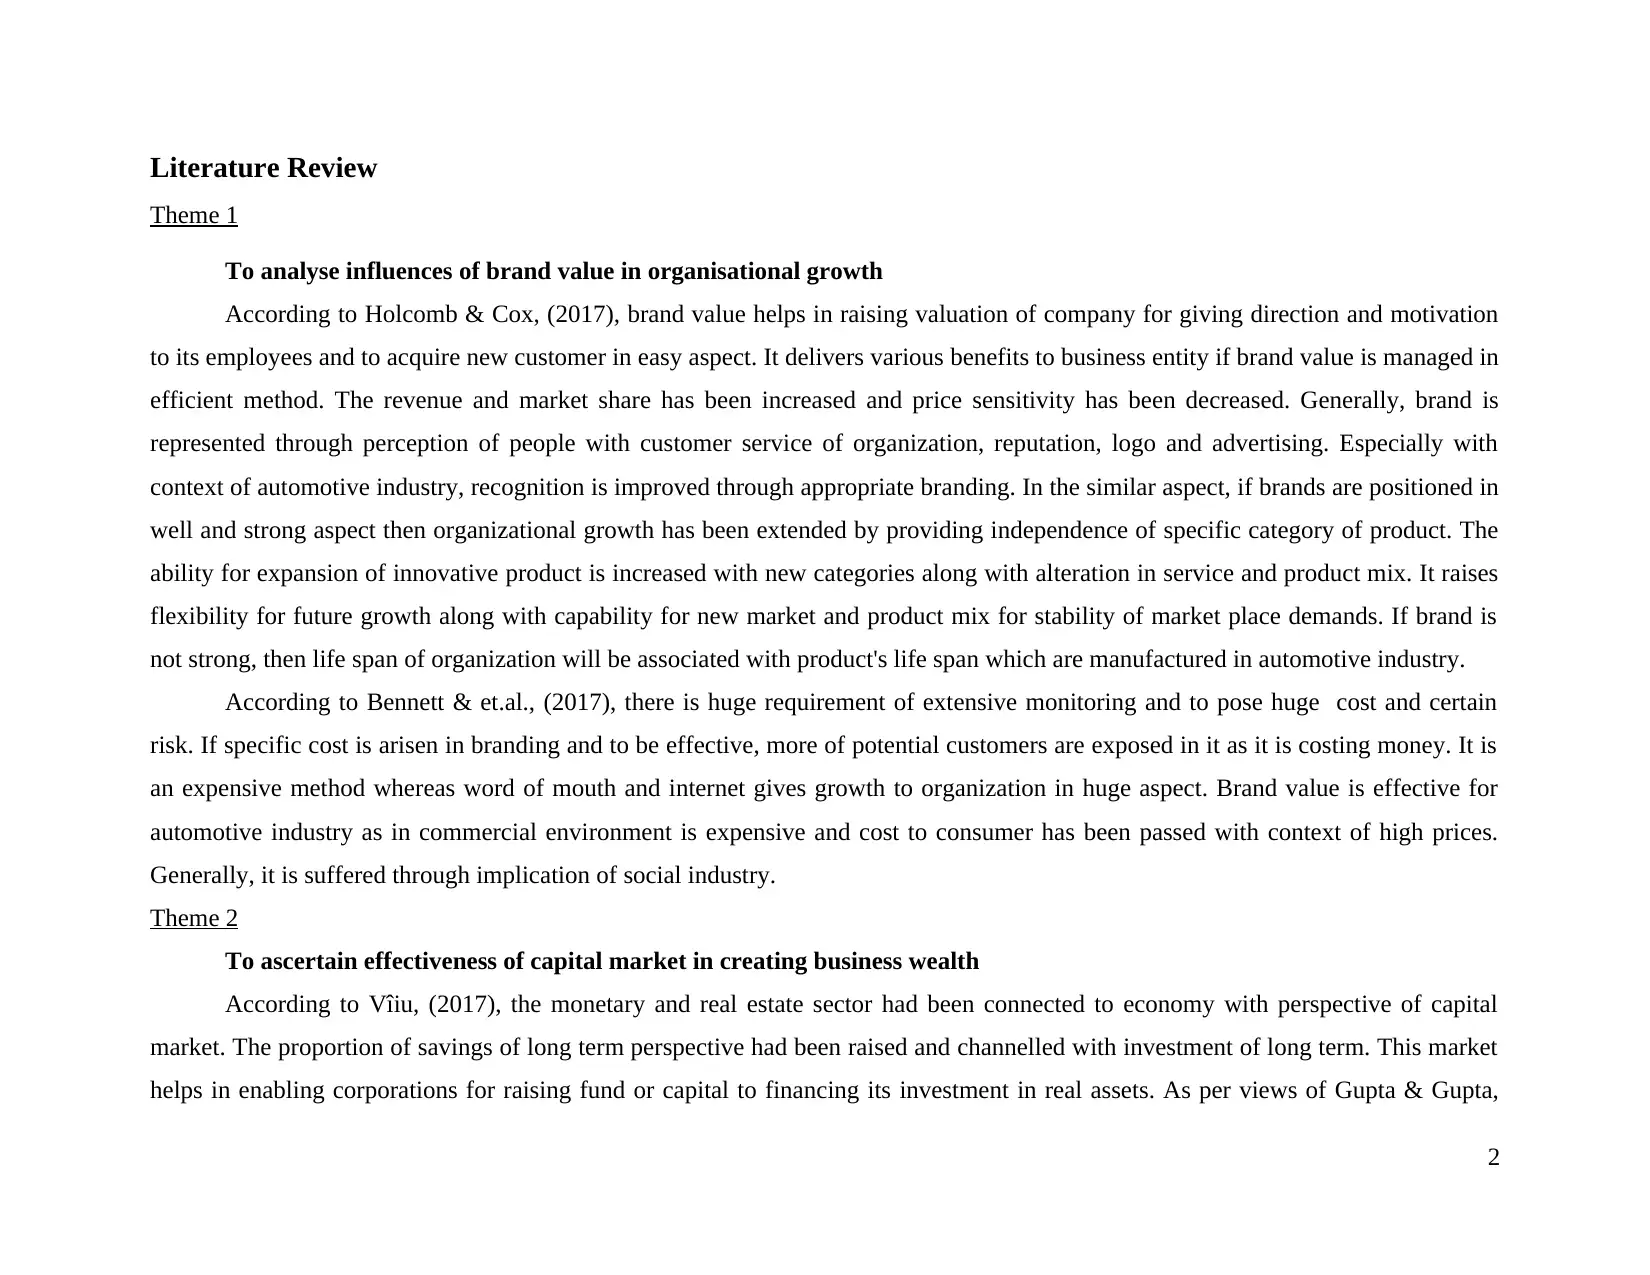
INTRODUCTION
Brand has been appeared with corporate strategy in this present scenario. The business organizations of every sector have fully
embraced with for forming strategy to determine via corporate brands. It is associated as marketing strategy which is driven and
managed through organization or management and marketing head as well. Sales are replicated as backbone of generating profitability
or margin of any business entity. The present will discuss about assessing impact on brand value on sales with its four objectives
which are specified in this. It has considered various journals for critically analysing its objectives related to brand value. It will reflect
its desired outcome with application of different statistical methods which are explained briefly in this report. For reaching its
outcome, this report will be formed on basis of automotive industry with 5 major companies such as Toyota motor Corporation, BMW
Groups, Honda motors, Daimler and Volkswagen. In the similar aspect, for assisting impact of brand value on sales, it will consider
unit of sales and brand value of year 2013 to 2017 of every company.
Aim and Objectives
Aim: To identify the impacts of brand value on revenue generation in automotive industries
Objectives:
To analyse influences of brand value in organisational growth.
To ascertain effectiveness of capital market in creating business wealth.
To develop techniques for improving sales volume of an industry.
To suggest effective solution for rising market value in capital environment.
Research question
How brand value gives influences on growth of business entity?
Why capital market is effective for generating business wealth?
What are techniques for improving volume of sale with context of automotive industry?
What are recommendations for giving effective solution for increasing market value associated to capital environment?
⊘ This is a preview!⊘
Do you want full access?
Subscribe today to unlock all pages.
Trusted by 1+ million students worldwide
Literature Review
Theme 1
To analyse influences of brand value in organisational growth
According to Holcomb & Cox, (2017), brand value helps in raising valuation of company for giving direction and motivation
to its employees and to acquire new customer in easy aspect. It delivers various benefits to business entity if brand value is managed in
efficient method. The revenue and market share has been increased and price sensitivity has been decreased. Generally, brand is
represented through perception of people with customer service of organization, reputation, logo and advertising. Especially with
context of automotive industry, recognition is improved through appropriate branding. In the similar aspect, if brands are positioned in
well and strong aspect then organizational growth has been extended by providing independence of specific category of product. The
ability for expansion of innovative product is increased with new categories along with alteration in service and product mix. It raises
flexibility for future growth along with capability for new market and product mix for stability of market place demands. If brand is
not strong, then life span of organization will be associated with product's life span which are manufactured in automotive industry.
According to Bennett & et.al., (2017), there is huge requirement of extensive monitoring and to pose huge cost and certain
risk. If specific cost is arisen in branding and to be effective, more of potential customers are exposed in it as it is costing money. It is
an expensive method whereas word of mouth and internet gives growth to organization in huge aspect. Brand value is effective for
automotive industry as in commercial environment is expensive and cost to consumer has been passed with context of high prices.
Generally, it is suffered through implication of social industry.
Theme 2
To ascertain effectiveness of capital market in creating business wealth
According to Vîiu, (2017), the monetary and real estate sector had been connected to economy with perspective of capital
market. The proportion of savings of long term perspective had been raised and channelled with investment of long term. This market
helps in enabling corporations for raising fund or capital to financing its investment in real assets. As per views of Gupta & Gupta,
2
Paraphrase This Document
Need a fresh take? Get an instant paraphrase of this document with our AI Paraphraser
(2017), productivity is raised within leading economy for huge employment along with increment in consumption, development and
growth. Especially, with context of broad ownership of its productive assets are increased. The benefit by economic growth and
distribution of wealth has given avenues for opportunities of investment which encourages thrift culture for raising investment ratios
and domestic savings which are necessary for rapid industrialization.
According to Okagbue & et.al., (2017), it has presence of demerits also related to business risk which is reflected in credit
crunch and crash of stock market in recent decades. It is indirectly linked to brand value as flexibility for setting capital account has
gained responsibility for undue payment related to services of promoters and good will. In the similar aspect, management with
absence of standard value which might split for receiving price in two categories such as nominal amount might be credited to specify
paid up capital and rest credited to capital surplus. It might be utilized for distribution of dividends.
Theme 3
To develop techniques for improving sales volume of an industry
According to Vergura & Carpentieri, (2017), sales are very important for growth of business entity. The mission must be
clarified in appropriate aspect and mission could be break into specific goals. In the similar aspect, penetration could be raises in
existing market. If business entity has gained good image then foundational proportion of business will be able for extracting easiest
and quick sales. Further, most popular strategy should be applied for increasing its sales for extending product line into innovative
complementary product which were pleased to offer for its existing clients especially in automotive industry.
As per views of Gibbison, (2017), giving focus on segment of new client is associated to strong growth in this industry. The
activities of client are identified and observed with purchase of commodities from others as well. The client segment had been
broadened with individual on similar place. In this similar context, perspective to client’s confidence for easier growth.
RESEARCH METHODOLOGY
Research Type: Research are of two types such as qualitative and quantitative (Watson & English, 2017). For accomplishing
our objective and desired outcome, it has initially used exploratory research for gaining an appropriate understanding of specified
3
reasons, motivations and opinions (Odukoya & et.al., 2018). The whole research is giving insight about research problem for
developing ideas and hypotheses on basis of potential qualitative research.
Data Collection: The data has been collected as brand value and sales of each selected organization (Dean & Illowsky, 2017 ).
This is referred as secondary data such as annual reports of automotive organization of year 2013 to 2017.
Sampling: In this research, there is absence of specific sampling but 5 automotive companies are selected as Toyota Motor
Corporation, BMW Groups, Honda motors, Daimler and Volkswagen (Kestens & et.al., 2017).
Analysis: The research would be considering number of sales of selected auto-mobile organizations. It would be analysing its
whole data with statistical models such as Correlation, Annova and Regression analysis (Bethapudi & Desai, 2017).
Correlation Analysis: It is referred as statistical evaluation with application for assessing strength of relationship among two
variables which are numerically measured and continuous variables as well. Generally, it is used for testing link among
categorical and qualitative variables. In simple words, it reflects relationship among them. In nutshell, it identifies strength and
direction among specified variables (Khayat & et.al., 2017). Correlation analysis helps in measuring about how things are
related as it helps in making projections about behaviour of future. Furthermore, strength of linear relationships has been
measured for implying association among variables (Thompson & et.al., 2017).
Anova Analysis: It is replicated as collection of specific statistical model associated with estimating its procedures and for
analysing variations among group mean and sample (Salmona & et.al., 2017). The unique part of Anova analysis as it provides
comparison from 3 or more group mean for significance of statistics. It might seem very odd technique which is known as
analysis of variance instead of analysis of means (One-way Anova, 2018).
Regression Analysis: It is referred as very reliable method for identifying several or single independent variables which gives
impact on dependent variable (Brett & et.al., 2017). It is used as model which shows relationship of both response and
predictor variables. In this context, there are different types of regression analysis along with core and examining influence of
one or more variables such as independent on dependent (Regression Testing, 2018).
4
⊘ This is a preview!⊘
Do you want full access?
Subscribe today to unlock all pages.
Trusted by 1+ million students worldwide
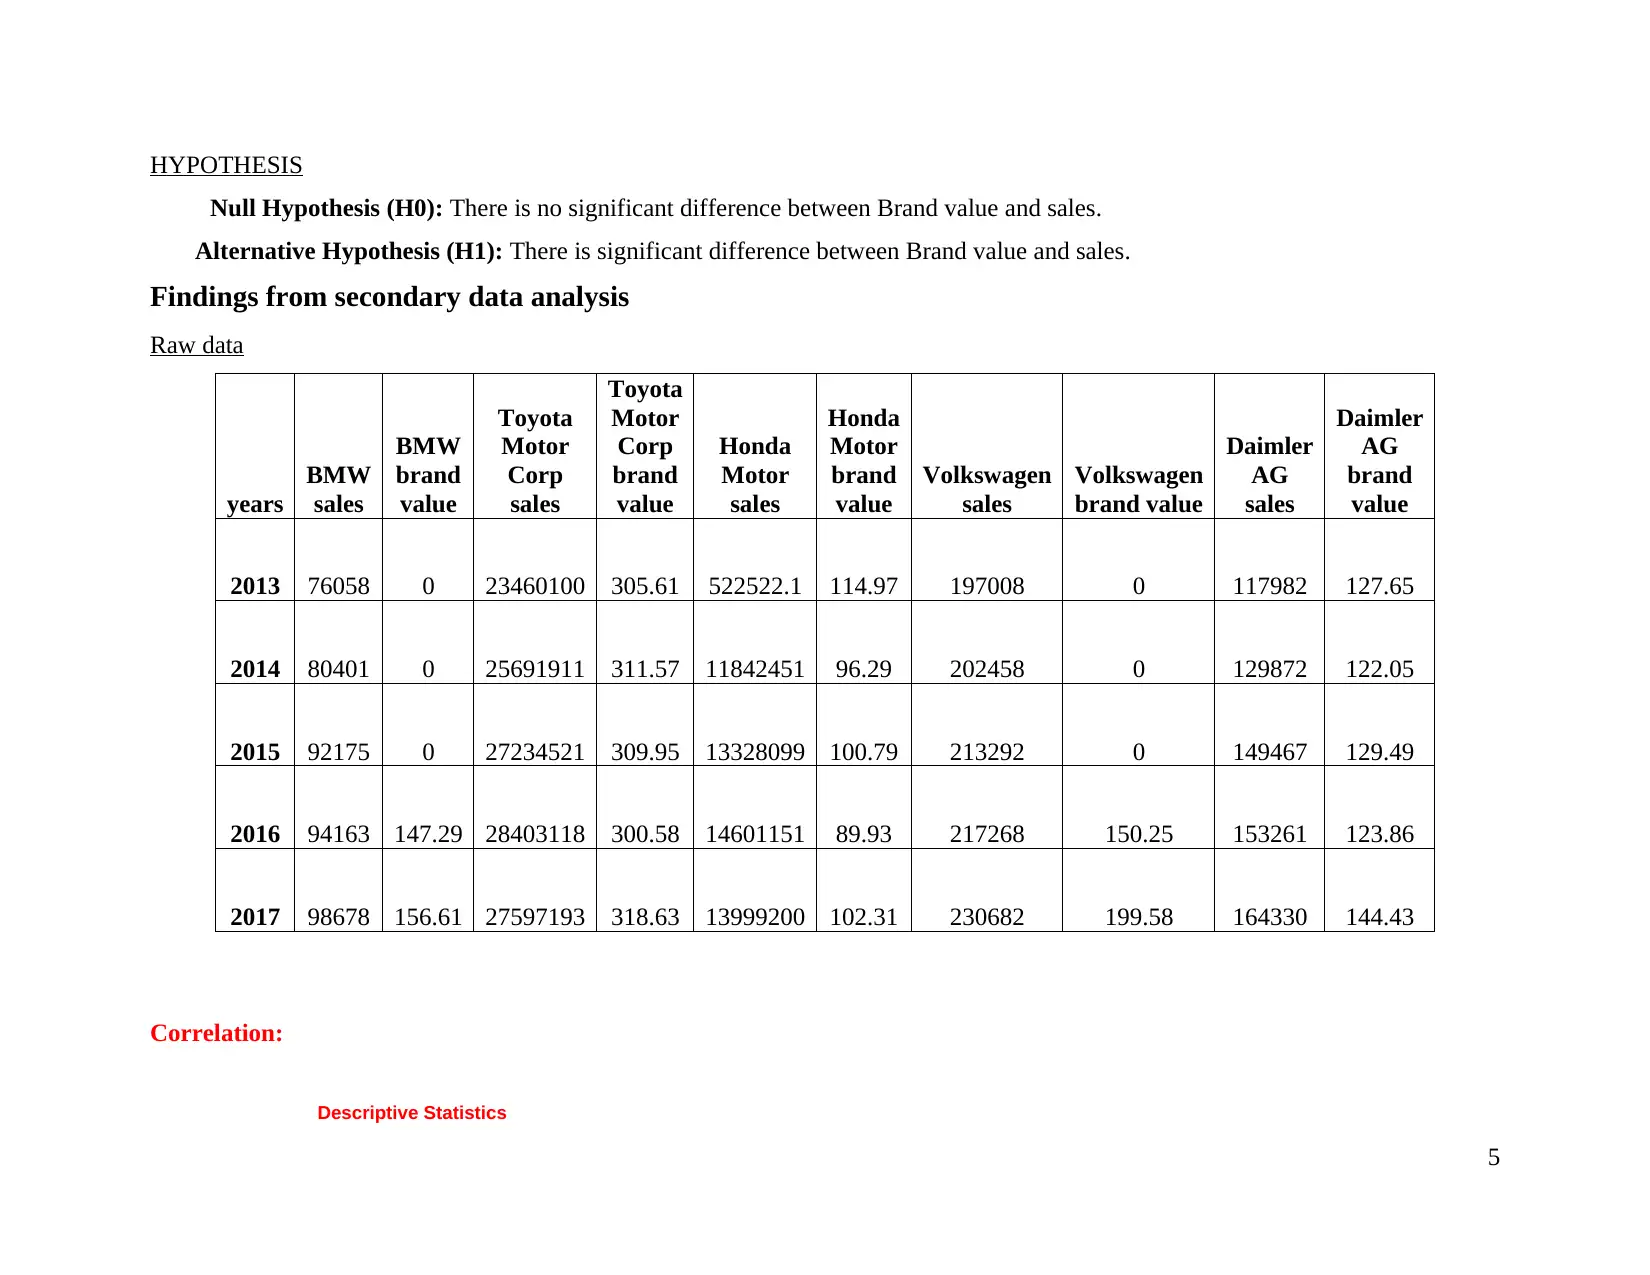
HYPOTHESIS
Null Hypothesis (H0): There is no significant difference between Brand value and sales.
Alternative Hypothesis (H1): There is significant difference between Brand value and sales.
Findings from secondary data analysis
Raw data
years
BMW
sales
BMW
brand
value
Toyota
Motor
Corp
sales
Toyota
Motor
Corp
brand
value
Honda
Motor
sales
Honda
Motor
brand
value
Volkswagen
sales
Volkswagen
brand value
Daimler
AG
sales
Daimler
AG
brand
value
2013 76058 0 23460100 305.61 522522.1 114.97 197008 0 117982 127.65
2014 80401 0 25691911 311.57 11842451 96.29 202458 0 129872 122.05
2015 92175 0 27234521 309.95 13328099 100.79 213292 0 149467 129.49
2016 94163 147.29 28403118 300.58 14601151 89.93 217268 150.25 153261 123.86
2017 98678 156.61 27597193 318.63 13999200 102.31 230682 199.58 164330 144.43
Correlation:
Descriptive Statistics
5
Paraphrase This Document
Need a fresh take? Get an instant paraphrase of this document with our AI Paraphraser
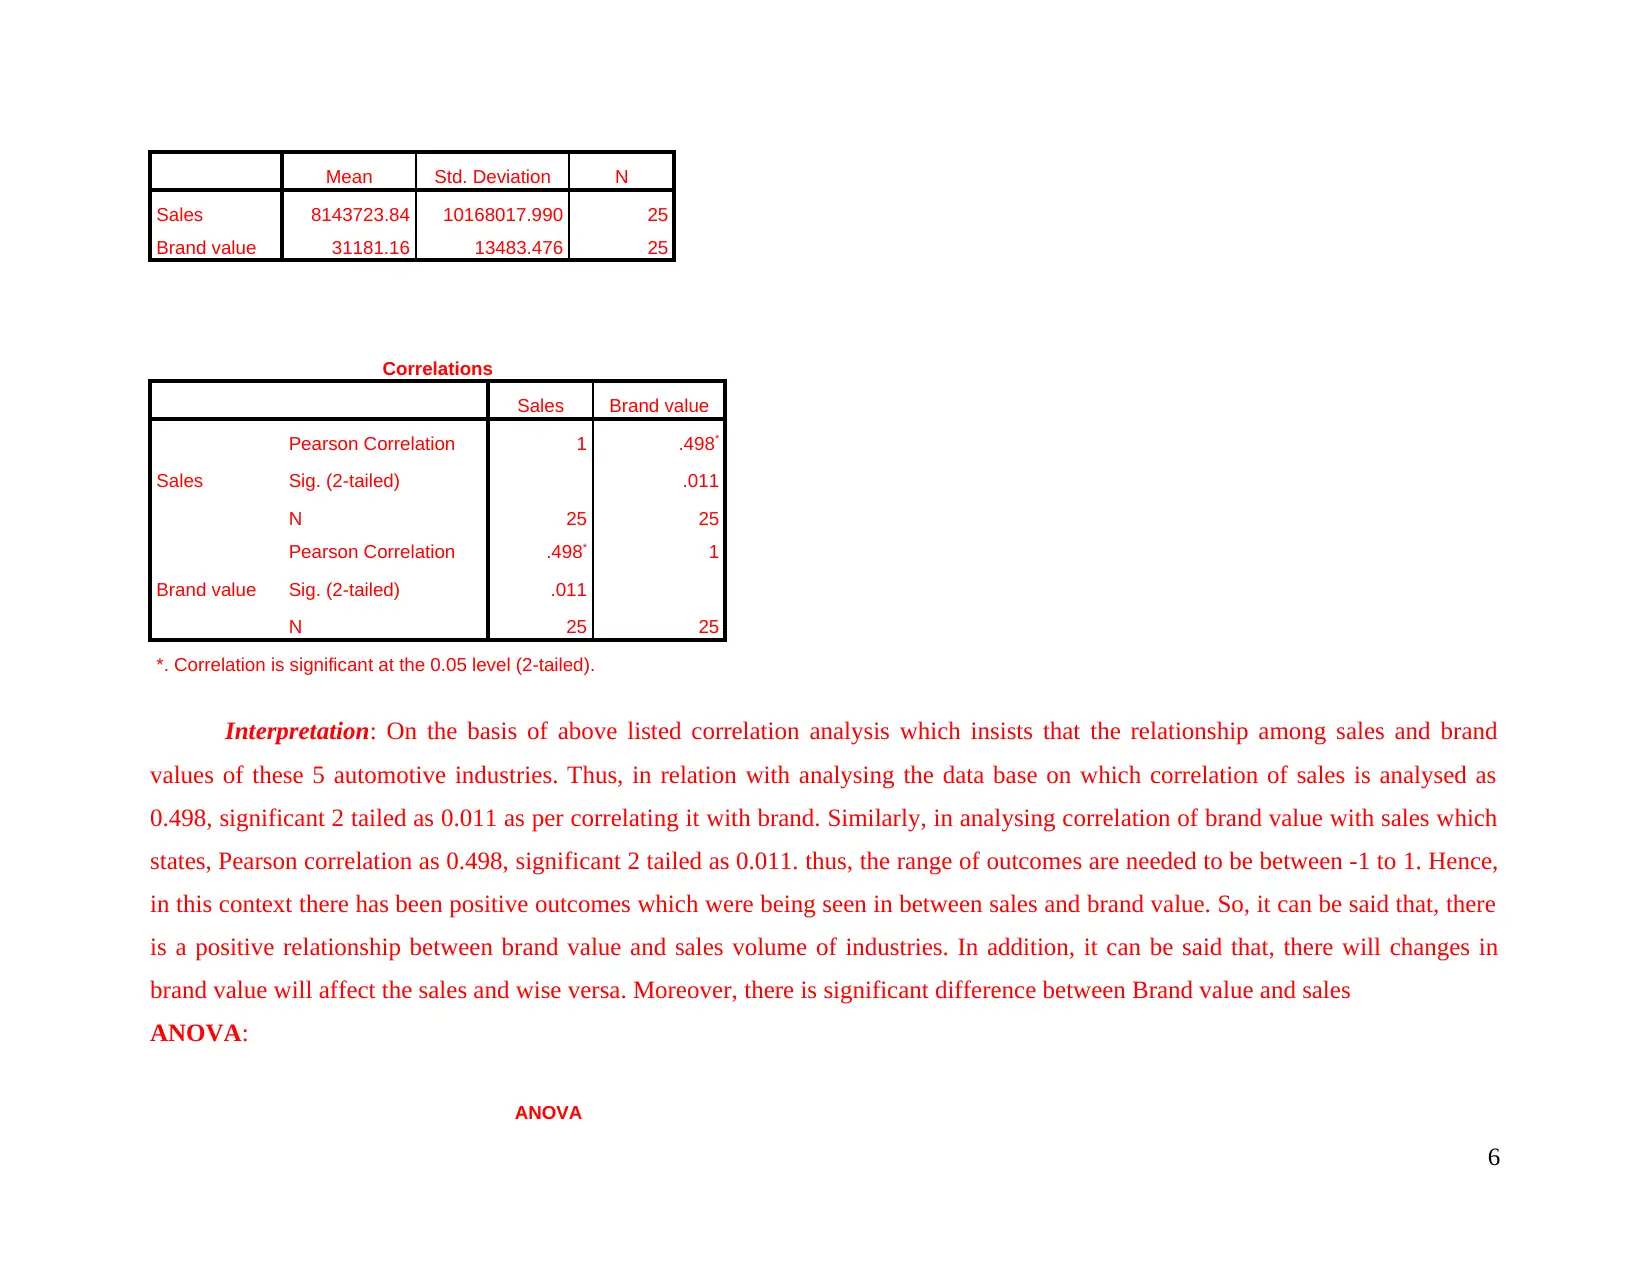
Mean Std. Deviation N
Sales 8143723.84 10168017.990 25
Brand value 31181.16 13483.476 25
Correlations
Sales Brand value
Sales
Pearson Correlation 1 .498*
Sig. (2-tailed) .011
N 25 25
Brand value
Pearson Correlation .498* 1
Sig. (2-tailed) .011
N 25 25
*. Correlation is significant at the 0.05 level (2-tailed).
Interpretation: On the basis of above listed correlation analysis which insists that the relationship among sales and brand
values of these 5 automotive industries. Thus, in relation with analysing the data base on which correlation of sales is analysed as
0.498, significant 2 tailed as 0.011 as per correlating it with brand. Similarly, in analysing correlation of brand value with sales which
states, Pearson correlation as 0.498, significant 2 tailed as 0.011. thus, the range of outcomes are needed to be between -1 to 1. Hence,
in this context there has been positive outcomes which were being seen in between sales and brand value. So, it can be said that, there
is a positive relationship between brand value and sales volume of industries. In addition, it can be said that, there will changes in
brand value will affect the sales and wise versa. Moreover, there is significant difference between Brand value and sales
ANOVA:
ANOVA
6
Brand value
Sum of Squares df Mean Square F Sig.
Between Groups 4363298907.36
0 24 181804121.140 . .
Within Groups .000 0 .
Total 4363298907.36
0 24
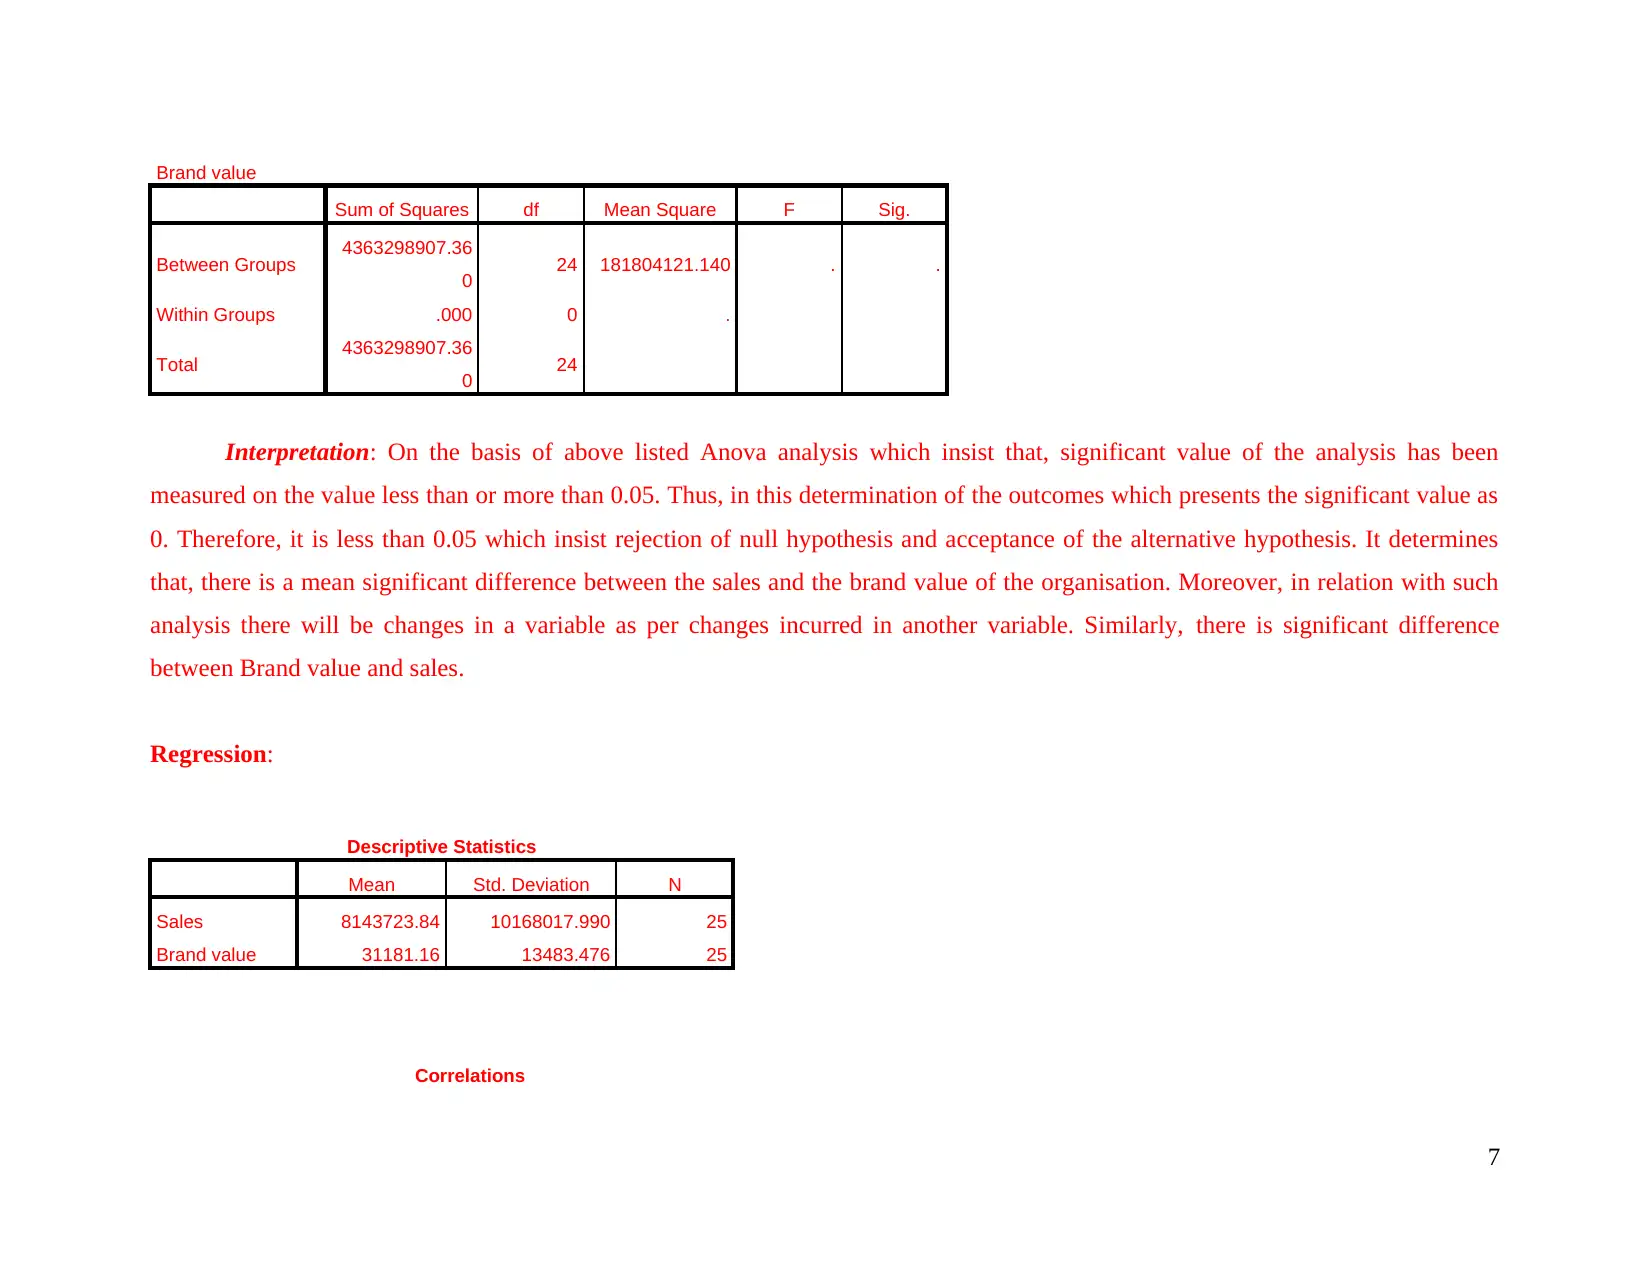
Interpretation: On the basis of above listed Anova analysis which insist that, significant value of the analysis has been
measured on the value less than or more than 0.05. Thus, in this determination of the outcomes which presents the significant value as
0. Therefore, it is less than 0.05 which insist rejection of null hypothesis and acceptance of the alternative hypothesis. It determines
that, there is a mean significant difference between the sales and the brand value of the organisation. Moreover, in relation with such
analysis there will be changes in a variable as per changes incurred in another variable. Similarly, there is significant difference
between Brand value and sales.
Regression:
Descriptive Statistics
Mean Std. Deviation N
Sales 8143723.84 10168017.990 25
Brand value 31181.16 13483.476 25
Correlations
7
Sum of Squares df Mean Square F Sig.
Between Groups 4363298907.36
0 24 181804121.140 . .
Within Groups .000 0 .
Total 4363298907.36
0 24
Interpretation: On the basis of above listed Anova analysis which insist that, significant value of the analysis has been
measured on the value less than or more than 0.05. Thus, in this determination of the outcomes which presents the significant value as
0. Therefore, it is less than 0.05 which insist rejection of null hypothesis and acceptance of the alternative hypothesis. It determines
that, there is a mean significant difference between the sales and the brand value of the organisation. Moreover, in relation with such
analysis there will be changes in a variable as per changes incurred in another variable. Similarly, there is significant difference
between Brand value and sales.
Regression:
Descriptive Statistics
Mean Std. Deviation N
Sales 8143723.84 10168017.990 25
Brand value 31181.16 13483.476 25
Correlations
7
⊘ This is a preview!⊘
Do you want full access?
Subscribe today to unlock all pages.
Trusted by 1+ million students worldwide
Sales Brand value
Pearson Correlation Sales 1.000 .498
Brand value .498 1.000
Sig. (1-tailed) Sales . .006
Brand value .006 .
N Sales 25 25
Brand value 25 25
Model Summary
Model R R Square Adjusted R Square Std. Error of the
Estimate
Change Statistics
R Square Change F Change df1 df2 Sig. F Change
1 .498a .248 .215 9009943.778 .248 7.566 1 23 .011
a. Predictors: (Constant), Brand value
ANOVAa
Model Sum of Squares df Mean Square F Sig.
1
Regression 614207158202619
.500 1 614207158202619
.500 7.566 .011b
Residual 186711899831366
2.500 23 81179086883202.
720
Total 248132615651628
2.000 24
a. Dependent Variable: Sales
8
Paraphrase This Document
Need a fresh take? Get an instant paraphrase of this document with our AI Paraphraser
b. Predictors: (Constant), Brand value
Coefficientsa
Model Unstandardized Coefficients Standardized
Coefficients
t Sig. 95.0% Confidence Interval for
B
Correlations
B Std. Error Beta Lower Bound Upper Bound Zero-order Partial Part
1 (Constant) -3555100.551 4619104.789 -.770 .449 -
13110446.825 6000245.724
Brand value 375.189 136.400 .498 2.751 .011 93.024 657.354 .498 .498 .498
a. Dependent Variable: Sales
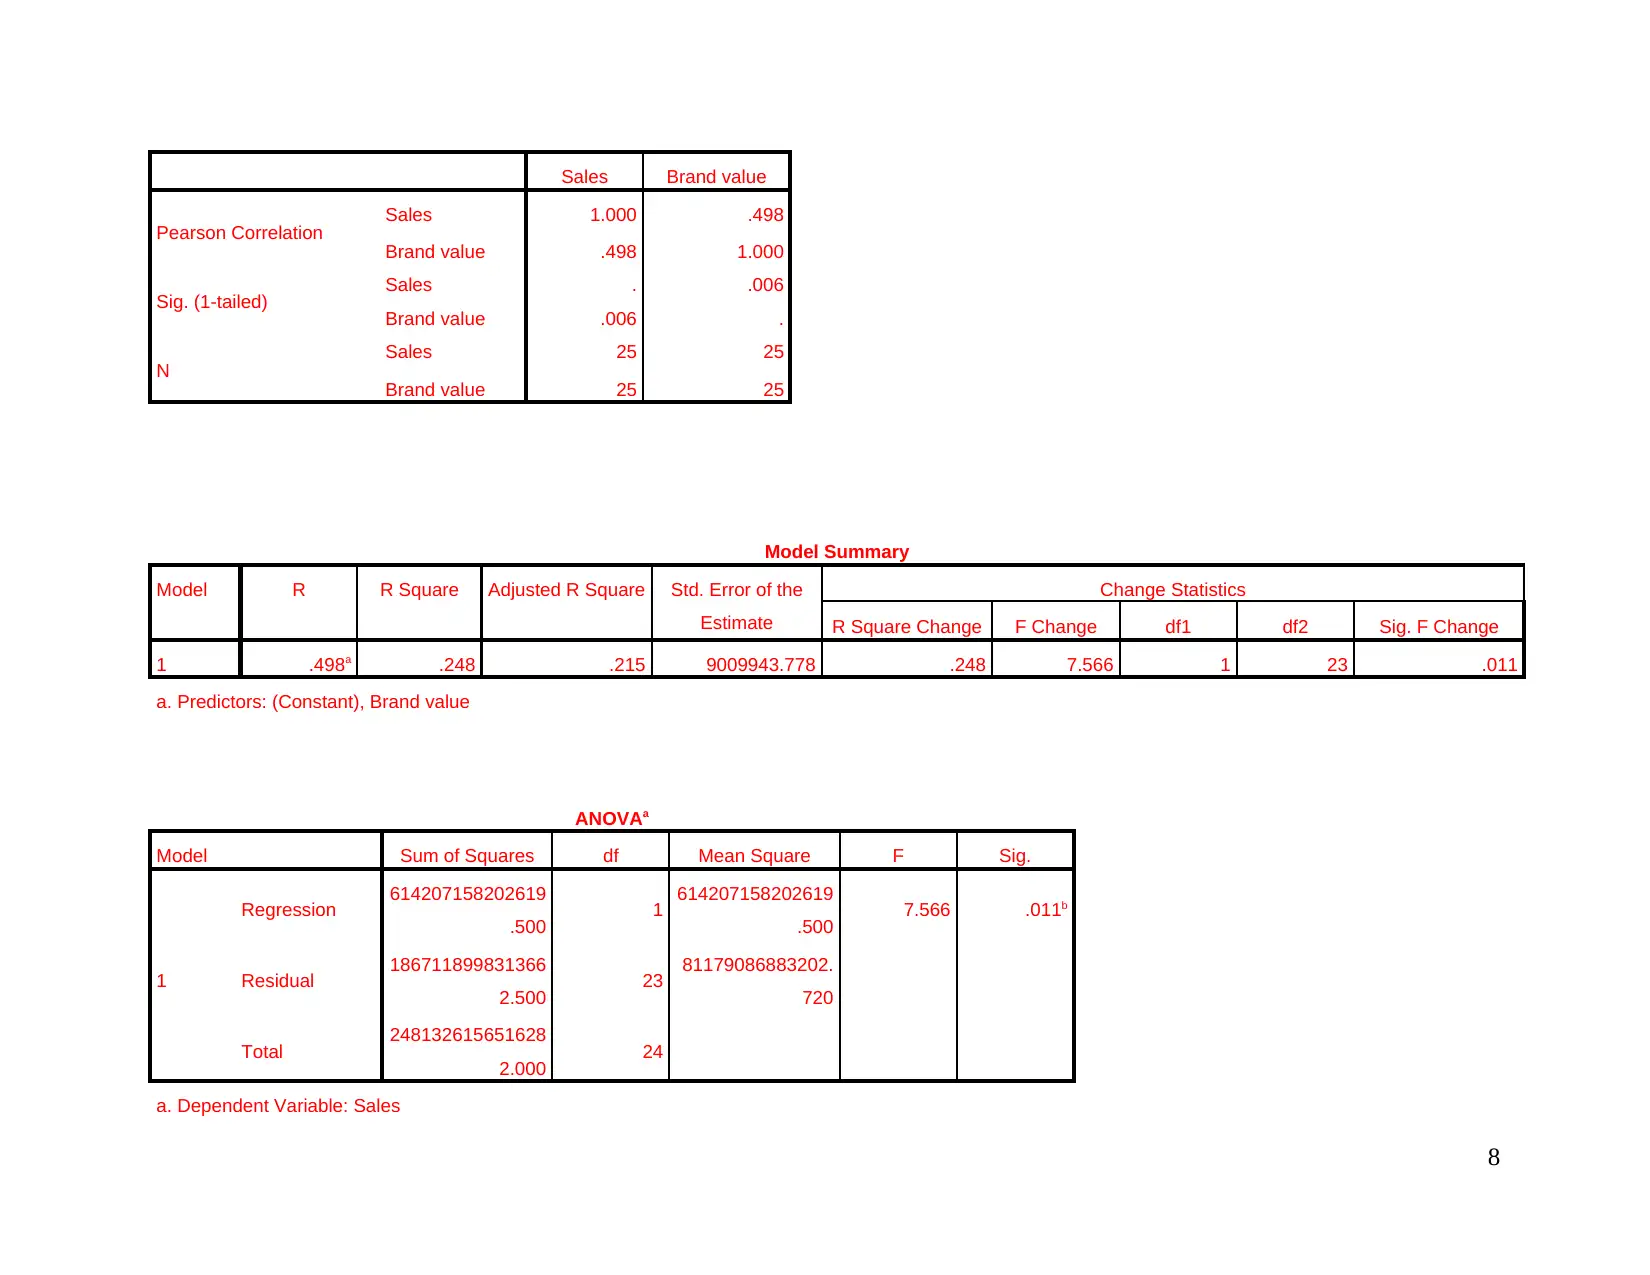
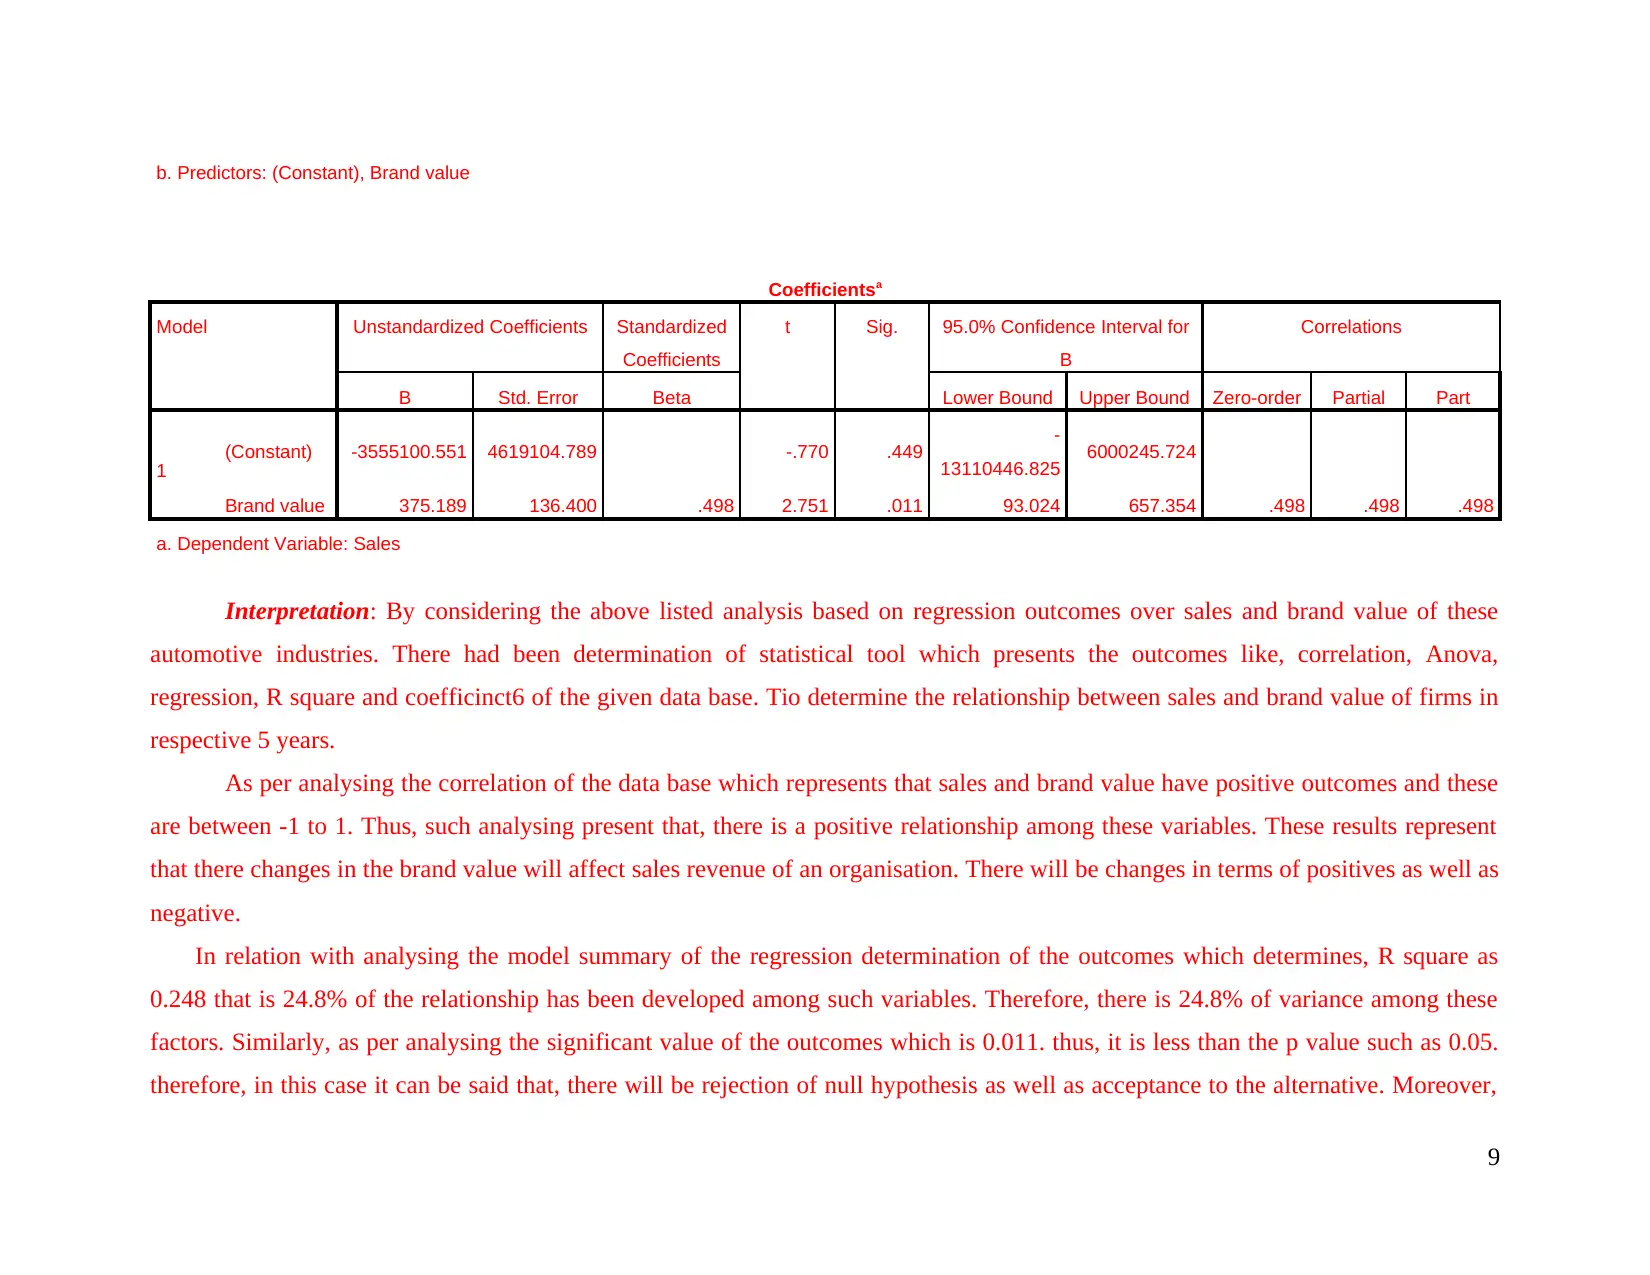
Interpretation: By considering the above listed analysis based on regression outcomes over sales and brand value of these
automotive industries. There had been determination of statistical tool which presents the outcomes like, correlation, Anova,
regression, R square and coefficinct6 of the given data base. Tio determine the relationship between sales and brand value of firms in
respective 5 years.
As per analysing the correlation of the data base which represents that sales and brand value have positive outcomes and these
are between -1 to 1. Thus, such analysing present that, there is a positive relationship among these variables. These results represent
that there changes in the brand value will affect sales revenue of an organisation. There will be changes in terms of positives as well as
negative.
In relation with analysing the model summary of the regression determination of the outcomes which determines, R square as
0.248 that is 24.8% of the relationship has been developed among such variables. Therefore, there is 24.8% of variance among these
factors. Similarly, as per analysing the significant value of the outcomes which is 0.011. thus, it is less than the p value such as 0.05.
therefore, in this case it can be said that, there will be rejection of null hypothesis as well as acceptance to the alternative. Moreover,
9
Coefficientsa
Model Unstandardized Coefficients Standardized
Coefficients
t Sig. 95.0% Confidence Interval for
B
Correlations
B Std. Error Beta Lower Bound Upper Bound Zero-order Partial Part
1 (Constant) -3555100.551 4619104.789 -.770 .449 -
13110446.825 6000245.724
Brand value 375.189 136.400 .498 2.751 .011 93.024 657.354 .498 .498 .498
a. Dependent Variable: Sales
Interpretation: By considering the above listed analysis based on regression outcomes over sales and brand value of these
automotive industries. There had been determination of statistical tool which presents the outcomes like, correlation, Anova,
regression, R square and coefficinct6 of the given data base. Tio determine the relationship between sales and brand value of firms in
respective 5 years.
As per analysing the correlation of the data base which represents that sales and brand value have positive outcomes and these
are between -1 to 1. Thus, such analysing present that, there is a positive relationship among these variables. These results represent
that there changes in the brand value will affect sales revenue of an organisation. There will be changes in terms of positives as well as
negative.
In relation with analysing the model summary of the regression determination of the outcomes which determines, R square as
0.248 that is 24.8% of the relationship has been developed among such variables. Therefore, there is 24.8% of variance among these
factors. Similarly, as per analysing the significant value of the outcomes which is 0.011. thus, it is less than the p value such as 0.05.
therefore, in this case it can be said that, there will be rejection of null hypothesis as well as acceptance to the alternative. Moreover,
9
there is a mean significant difference between brand value and sales of an entity. Similarly, there is significant difference between
Brand value and sales.
DISCUSSION
As per analysing the relationship between sales as well as revenue of the organisation, here has been determination of various
tests which have brought clear analysis on the outcomes (Butt & Bucks, 2017). Thus, in consideration with the regression, correlation,
coefficient and Anova analysis, it can be said that, there are majority of results that are in favour of alternative hypothesis. That is,
there is a significant difference between Brand value and sales due to p value is less than the required rate such as 0.05.
Moreover, it can be said that there is a relation between brand value and sales volume of an organisation. Thus, rise in brand value
is affecting the revenue generation in the business (Rashid & Rahim, 2017). In relation with this aspect, these industries have to make
revolutionary changes in operations such as bringing reforms in dividend policies as well as in pricing strategies (He & Wang, 2018).
Increment in the operational efficiency will help in rising the brand image in market. Along with this, in case of Volkswagen and
BMW, there has been acceptance to the alternative hypothesis which states that, there is a significant difference between brand value
and sales. In this case, it can be analysed that, there will be impacts of brand value in rising the sales volume of an entity (Matabos &
et.al., 2017).
However, as per analysing the overall outcome of all these 5 organisations, majority of them defines that there is a relationship
between brand value and sales of the business (Honda brand value, 2018). Thus, brand image of an organisation will affect the
positive or negative changes in sales volume. Therefore, instead of increasing the brand value, firm needed to be focused on rising its
sales revenue (Mora & et.al., 2017). There can be various other factors or operational areas on which organisation has to be focused
such as promotional activities, strengthening the supply chain, consumer relationship as well as pricing tactics which will results in
enhancing image as well as revenue of entity.
10
⊘ This is a preview!⊘
Do you want full access?
Subscribe today to unlock all pages.
Trusted by 1+ million students worldwide
1 out of 17
Related Documents


Your All-in-One AI-Powered Toolkit for Academic Success.
+13062052269
info@desklib.com
Available 24*7 on WhatsApp / Email
![[object Object]](/_next/static/media/star-bottom.7253800d.svg)
Unlock your academic potential
Copyright © 2020–2026 A2Z Services. All Rights Reserved. Developed and managed by ZUCOL.