Report on Recommendation for Balloon Purchase: Branson Ltd Analysis
VerifiedAdded on 2021/06/14
|14
|1860
|26
Report
AI Summary
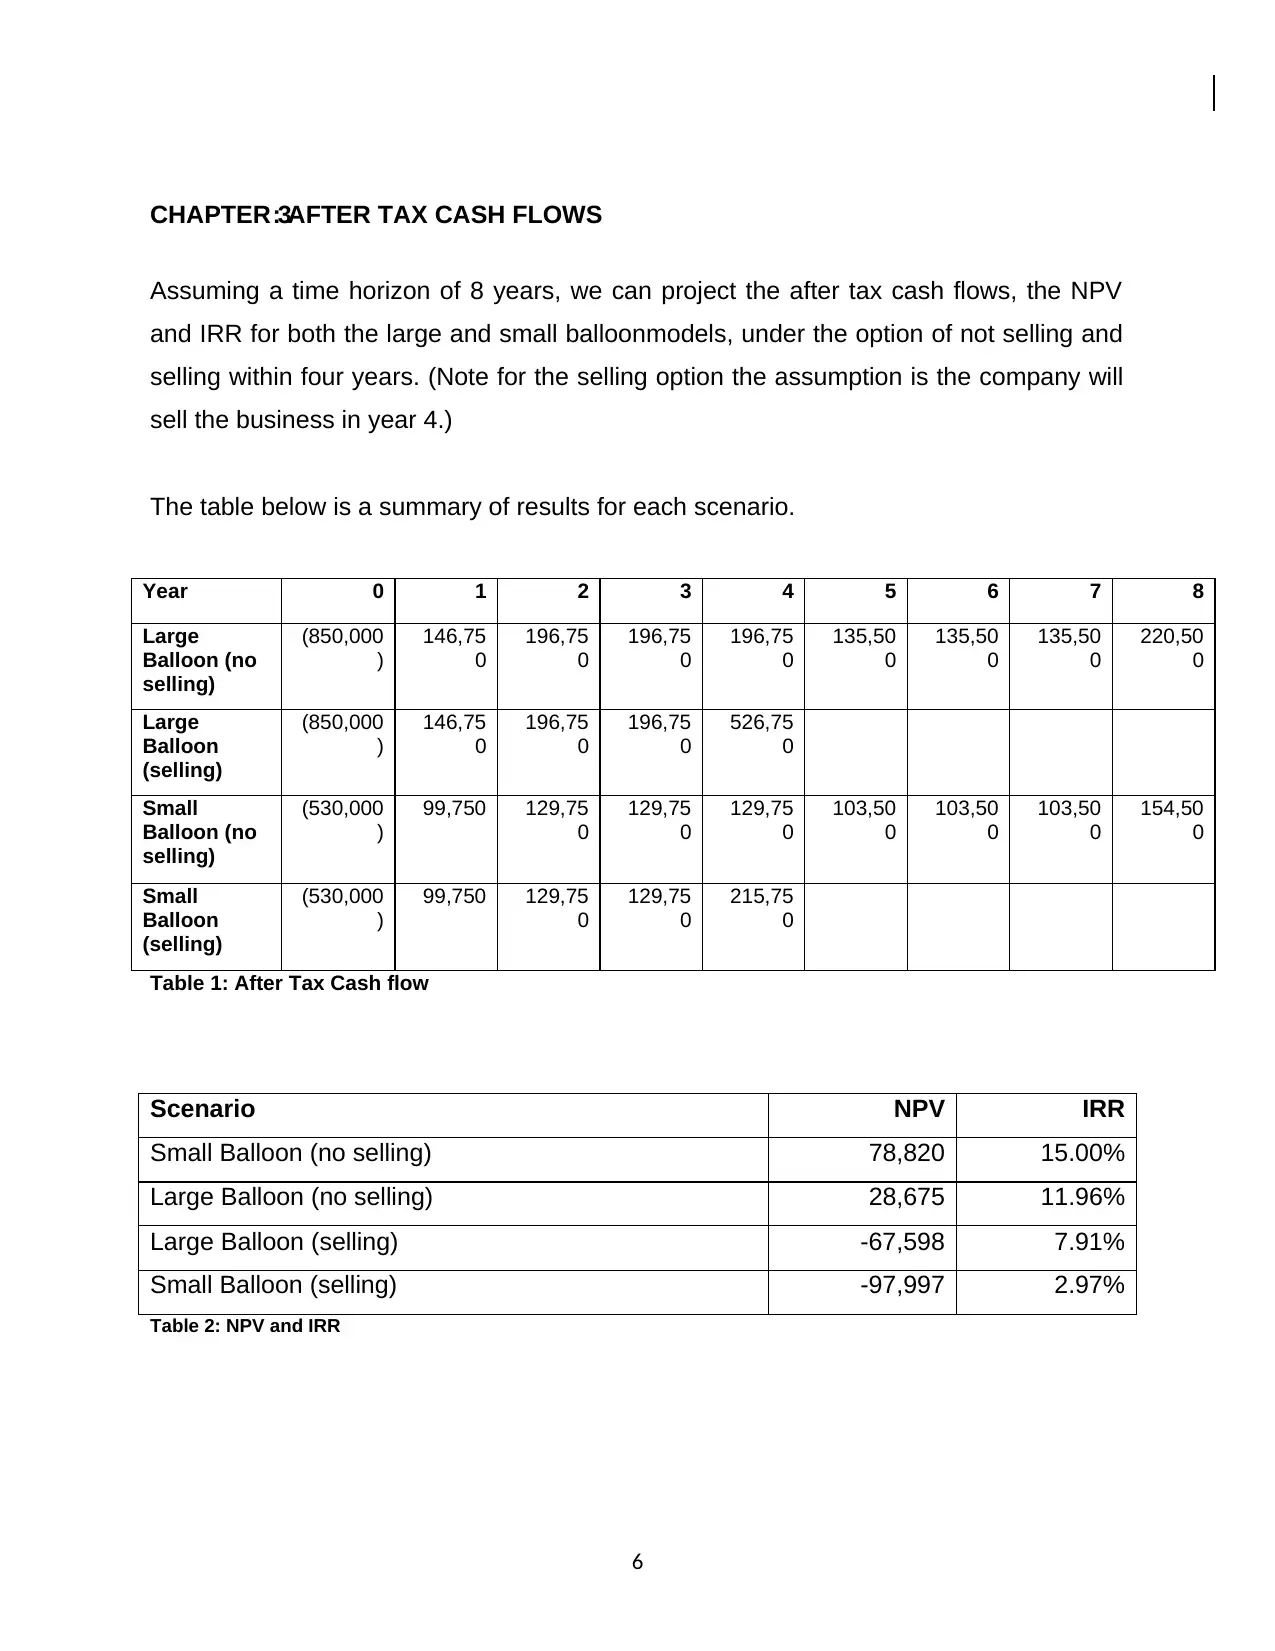
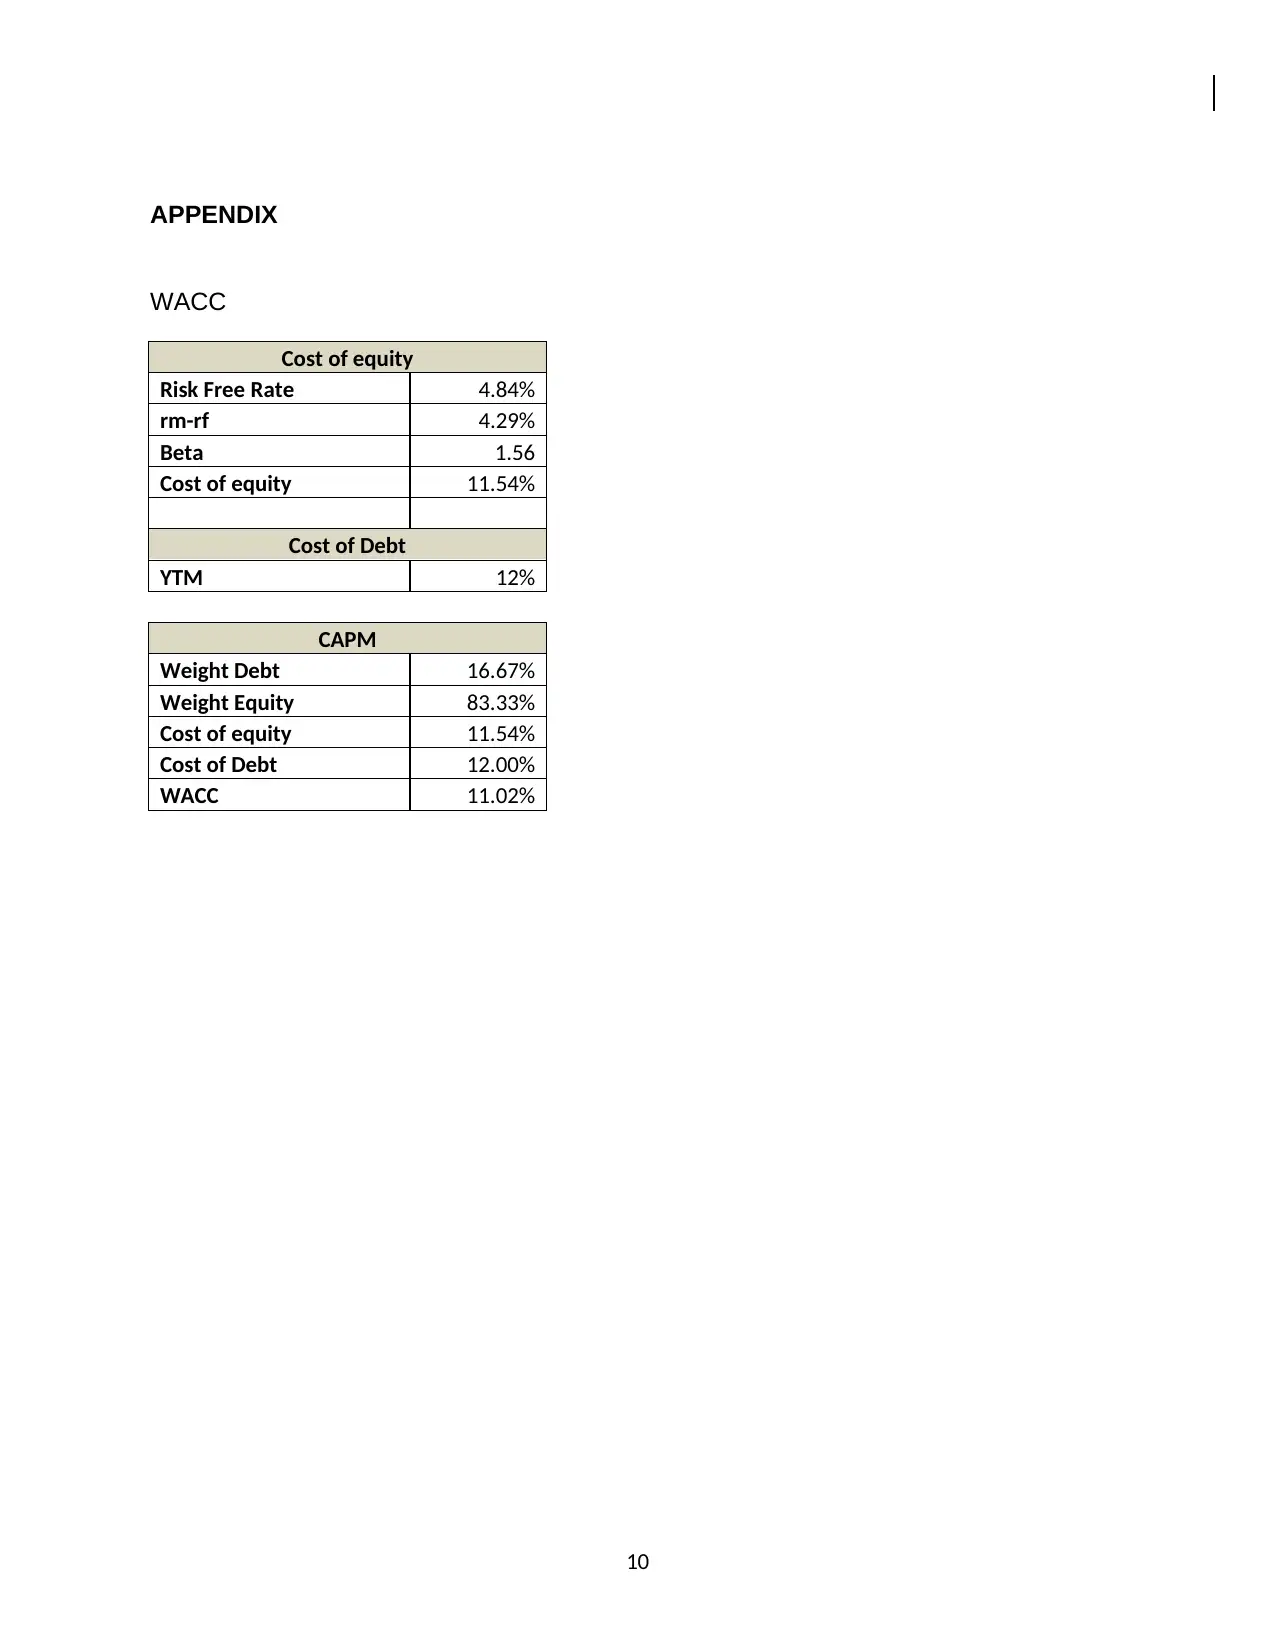
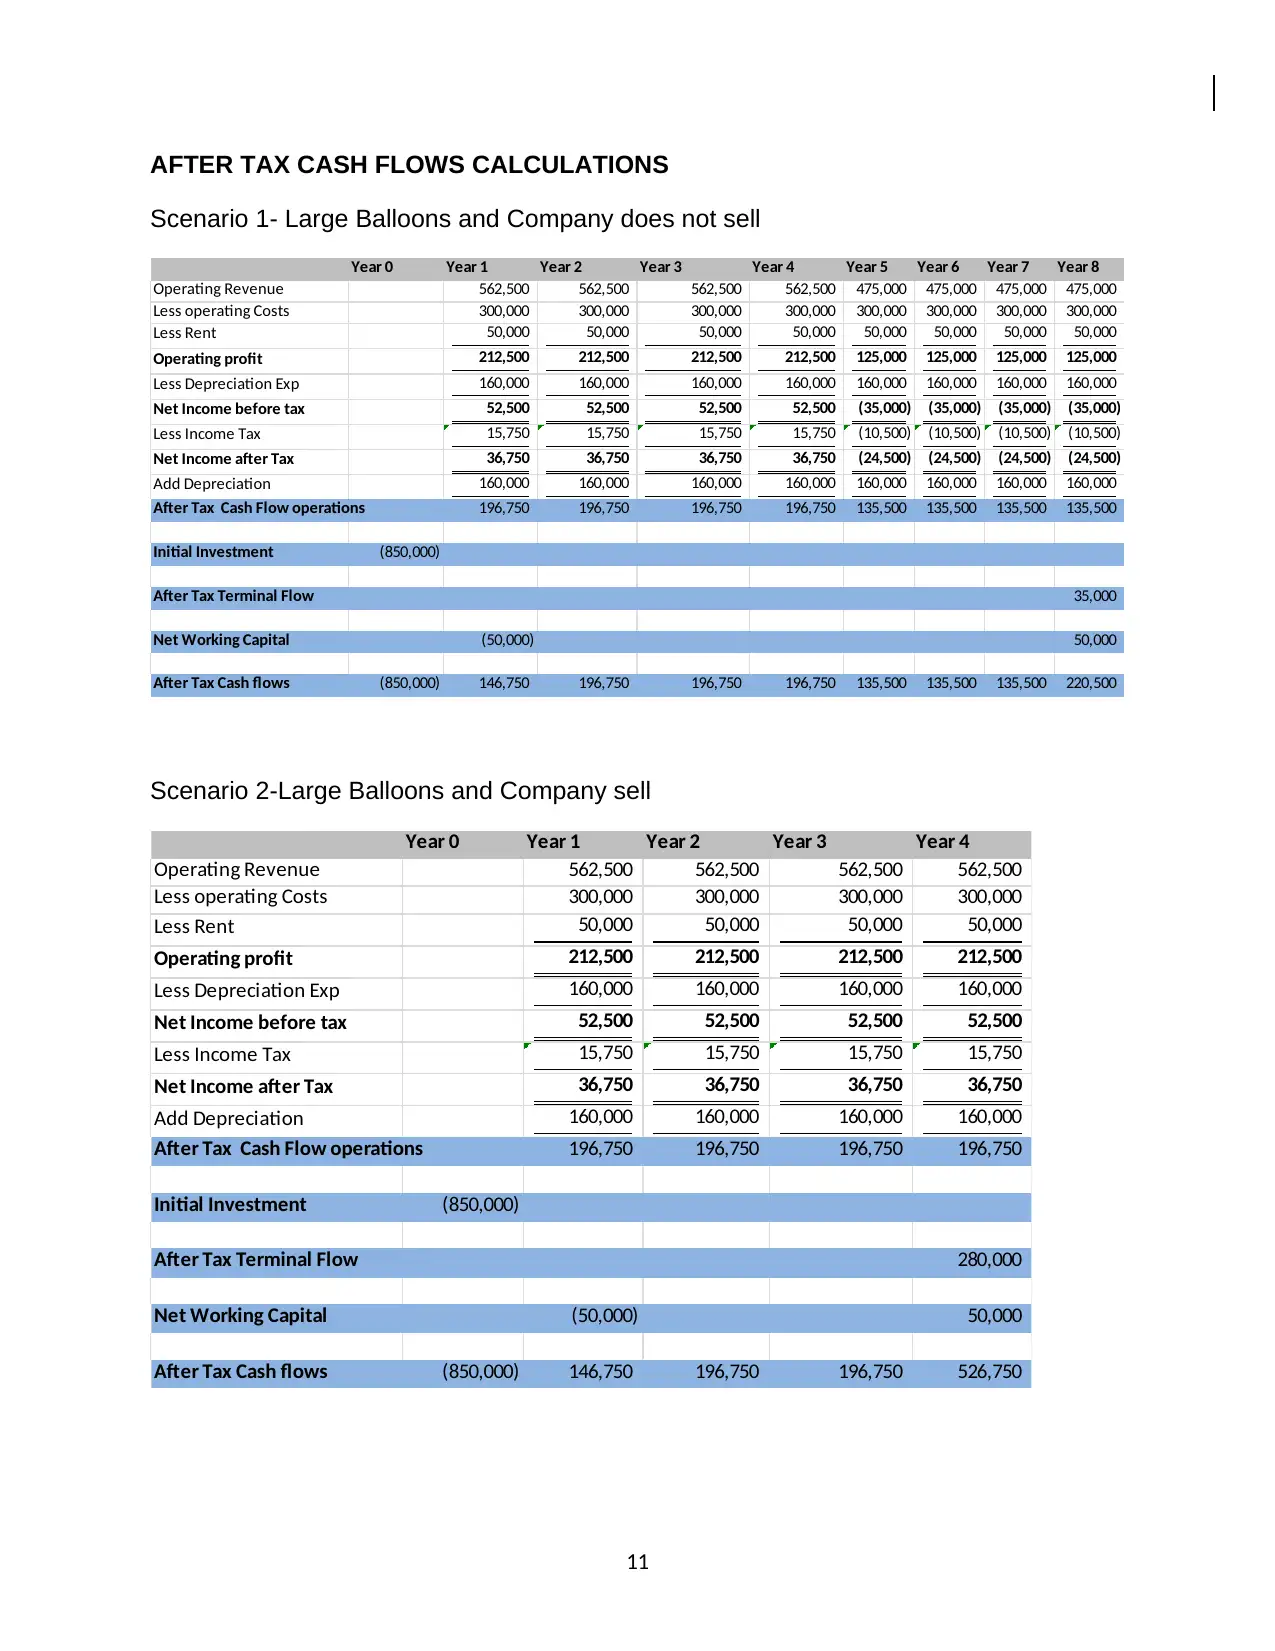
This report provides a financial analysis and recommendation for Branson Ltd regarding the purchase of new balloons. The company needs to decide whether to replace their current balloons with either a large or small model, considering the option of selling the business within four years. The analysis utilizes capital budgeting techniques, including Net Present Value (NPV) and Internal Rate of Return (IRR), to evaluate the profitability of each scenario. The report calculates the Weighted Average Cost of Capital (WACC) to determine the appropriate discount rate, considering the cost of equity and debt. The after-tax cash flows, NPV, and IRR are calculated for different scenarios: large balloons with and without selling the business, and small balloons with and without selling. Based on the financial analysis, the report recommends that Branson Ltd should not sell the business within four years and should operate the business for at least eight years, opting for the smaller balloon model due to its higher NPV and long-term profitability. The report concludes that Branson Ltd should proceed with the small balloon model for the next eight years.

A REPORT ON THE RECOMMENDATION ON THE
PURCHASE OF BALLOONS FOR BRANSON LTD
Prepared by
[Insert Student Name]
PURCHASE OF BALLOONS FOR BRANSON LTD
Prepared by
[Insert Student Name]
Secure Best Marks with AI Grader
Need help grading? Try our AI Grader for instant feedback on your assignments.

EXECUTIVE SUMMARY
To assess the profitability of a new projectsuch as toreplace a new model or purchase
new equipment or a product line, a company will need to analyze the project’s potential
cash inflows and outflowsover a specified time horizon. This process is known as capital
budgeting.
There arefive main methods used in capital budgeting. These include determining the
project’s payback period, profitability index, internal rate of return, discounted payback
period, and /or net present value.
Most, if not all, of the methods above will require the company to know their discount
rate. The discount rate is the minimum rate of return that a business expects to earn on
any of its investment. In most cases, the cost of capital is used as a starting returnfor
the firm’s discount rate.
The objective of this report is to provide a recommendation as to whether Branson Ltd
should replace their current balloons with either a large or a small model using the
quantitative methods above. However, it should be stressed that quantitative methods
should not be used in isolation. Consideration should also be given to qualitative
techniques such as regulation, competitor actions, financing etc. as these may have a
far greater effect on the outcome of the project.
.
1

TABLE OF CONTENTS
EXECUTIVE SUMMARY.........................................................................................................................1
TABLE OF CONTENTS...........................................................................................................................2
CHAPTER 1 : INTRODUCTION.............................................................................................................3
CHAPTER 2 : DISCOUNT RATE...........................................................................................................4
CHAPTER 3 : AFTER TAX CASH FLOWS..........................................................................................6
CHAPTER 4 : CONCLUSION AND RECOMMENDATION................................................................8
REFERENCES..........................................................................................................................................9
APPENDIX...............................................................................................................................................10
2

CHAPTER 1:INTRODUCTION
Branson Ltd is a public listed company in Melbourne. They operate in the tours industry.
Currently, the company’s hot air balloons used for their tours have retired. As a result,
the company is now faced with the decision as to whether to replace their current
balloons with a larger or smaller model. Furthermore, they are also considering the
option of selling the business within 4 years should they proceed with either of the
above models.
The purpose of this report is to determine whether the company should replace its
balloons with either a large or a small model. Furthermore, it determines whether the
company should sell the business within the next 4 years, using either model.
To perform the above analysis, quantitative techniques including the Net present Value
(NPV) and Internal Rate of Return (IRR) were compared and analyzed for both models.
The report is divided into five sections. Section one discussesBranson’s discount rate.
Section two, discusses theafter tax cash flows, NPV and IRR under all scenarios.
Lastly, section three recommends the best model the company should adopt based on
analysis of the quantitative methods.
3
Secure Best Marks with AI Grader
Need help grading? Try our AI Grader for instant feedback on your assignments.

CHAPTER 2: DISCOUNT RATE
1. Introduction
In this section, we calculate the appropriate discount for Branson based on their capital
structure, cost of debt and cost of equity.
A company’s discount rate is their minimum rate of return it should earn on an
investment. In most cases, a company’s cost of capital is used as a good starting point
for the company’s discount rate.
The company’s cost of capital is calculated as the average cost of equity and after tax
cost of debt.
2. Cost of Equity
The cost of equity for Branson Ltd can be determined using the Capital Asset Pricing
Modelbelow.
Re = rf + Beta (rm –rf)
Where rf = Risk free rate, (rm –rf)= Risk premium
The company has provided information for the last 20 years on their historical returns,
market portfolio returns and risk free rates.
Thus, to calculate the Beta for Branson,linear regression was done on the returns. This
gave a beta of 1.56. The average market risk premium was determined as 4.29% and
the average risk free rate was 4.84% over the past 20 years.
Based on the above figures, using CAPM, the cost of equity for Branson was
determined as 11.54%.
4

2. Cost of Debt
Based on the company’s current debenture and the current market yields, the cost of
debt for Branson Ltd is 12%.
3. Weight of Debt and Equity
The company has stated that they have a debt to equity ratio of 1:5. Furthermore, they
have no intentions to change their capital structure in the near future. Thus, this
information can be used to determine the optimum weights of debt and equity, which
are given as 16.67% and 83.33% respectively.
5. Weighted Average Cost of Capital
The company’s cost of capital can be determined using the relationship below
WACC =Weight Debt * cost of debt *(1 – T) + Weight equity *cost of equity
Where T is the corporate tax
Thus, Branson Ltd will require a minimum return of 11.02% to be able to accept any
project.
5

CHAPTER 3: AFTER TAX CASH FLOWS
Assuming a time horizon of 8 years, we can project the after tax cash flows, the NPV
and IRR for both the large and small balloonmodels, under the option of not selling and
selling within four years. (Note for the selling option the assumption is the company will
sell the business in year 4.)
The table below is a summary of results for each scenario.
Year 0 1 2 3 4 5 6 7 8
Large
Balloon (no
selling)
(850,000
)
146,75
0
196,75
0
196,75
0
196,75
0
135,50
0
135,50
0
135,50
0
220,50
0
Large
Balloon
(selling)
(850,000
)
146,75
0
196,75
0
196,75
0
526,75
0
Small
Balloon (no
selling)
(530,000
)
99,750 129,75
0
129,75
0
129,75
0
103,50
0
103,50
0
103,50
0
154,50
0
Small
Balloon
(selling)
(530,000
)
99,750 129,75
0
129,75
0
215,75
0
Table 1: After Tax Cash flow
Scenario NPV IRR
Small Balloon (no selling) 78,820 15.00%
Large Balloon (no selling) 28,675 11.96%
Large Balloon (selling) -67,598 7.91%
Small Balloon (selling) -97,997 2.97%
Table 2: NPV and IRR
6
Paraphrase This Document
Need a fresh take? Get an instant paraphrase of this document with our AI Paraphraser

3.1 Results – Option 1:Large Balloons and Company does not sell
Applying the discount rate of 11.02%, the NPV is calculated as $28,675. Since NPV is
positive, Branson should accept the project. Furthermore, the IRR is 11.96% which is
greater than 10.41%, again suggesting the business will be profitable under this option.
3.2 Results – Option 2: Small Balloons and Company does not sell
For the small balloon model, applying the discount rate of 11.02%, the NPV is
calculated as $89,541. Since NPV is positive, Branson should accept the project.
Furthermore, the IRR is 15% which is greater than 10.41%, again suggesting the
business will be profitable under this option
3.3 Results – Option 3: Large Balloons and Company Sells Business in Year 4
Under the option of selling the business in year 4, applying the discount rate of 11.02%,
the NPV is calculated as $(67,598). Since NPV is negative, Branson should not sell the
business in 4 years. Furthermore, the IRR (7.91%) is lower than 10.41% suggesting that
selling is not a good option.
3.4 Results – Option 4:Small Balloons and Company Sells Business in Year 4
Under the option of selling, applying the discount rate of 11.02%, the NPV is calculated
as $(97,997). Since NPV is negative, Branson should not sell the business in 4 years.
Furthermore, the IRR is lower than 11.02% suggesting that selling is not a good option.
7

CHAPTER 4: CONCLUSION AND RECOMMENDATION
Based on the above NPV and IRR analysis, Branson should proceed not to sell the
business within 4 years and operate the business for at least 8 years. This is because
the NPV was less than zero under the selling option and positive under the 8 year
option.
Secondly, production of the smaller balloon model had a higher NPV than the larger
balloons. Therefore, Branson Ltd should proceed to produce smaller balloons as it is
more profitable than large balloons in the long term.
In conclusion, it is recommended that Branson should go with the small balloon model
for the next 8 years.
8

REFERENCES
Accounting Explained. (2017). Capital Budgeting. Retrieved September 2017, from Accounting
Explained: http://accountingexplained.com/managerial/capital-budgeting/
Tucker, J. (2009). How to set the hurdle rate for capital investments. Retrieved from
https://www.eprints.uwe.ac.uk/11334/1/Tucker_2009_QFinance_book_chapter.doc
9
Secure Best Marks with AI Grader
Need help grading? Try our AI Grader for instant feedback on your assignments.

APPENDIX
WACC
Cost of equity
Risk Free Rate 4.84%
rm-rf 4.29%
Beta 1.56
Cost of equity 11.54%
Cost of Debt
YTM 12%
CAPM
Weight Debt 16.67%
Weight Equity 83.33%
Cost of equity 11.54%
Cost of Debt 12.00%
WACC 11.02%
10
WACC
Cost of equity
Risk Free Rate 4.84%
rm-rf 4.29%
Beta 1.56
Cost of equity 11.54%
Cost of Debt
YTM 12%
CAPM
Weight Debt 16.67%
Weight Equity 83.33%
Cost of equity 11.54%
Cost of Debt 12.00%
WACC 11.02%
10

AFTER TAX CASH FLOWS CALCULATIONS
Scenario 1- Large Balloons and Company does not sell
Year 0 Year 1 Year 2 Year 3 Year 4 Year 5 Year 6 Year 7 Year 8
Operating Revenue 562,500 562,500 562,500 562,500 475,000 475,000 475,000 475,000
Less operating Costs 300,000 300,000 300,000 300,000 300,000 300,000 300,000 300,000
Less Rent 50,000 50,000 50,000 50,000 50,000 50,000 50,000 50,000
Operating profit 212,500 212,500 212,500 212,500 125,000 125,000 125,000 125,000
Less Depreciation Exp 160,000 160,000 160,000 160,000 160,000 160,000 160,000 160,000
Net Income before tax 52,500 52,500 52,500 52,500 (35,000) (35,000) (35,000) (35,000)
Less Income Tax 15,750 15,750 15,750 15,750 (10,500) (10,500) (10,500) (10,500)
Net Income after Tax 36,750 36,750 36,750 36,750 (24,500) (24,500) (24,500) (24,500)
Add Depreciation 160,000 160,000 160,000 160,000 160,000 160,000 160,000 160,000
After Tax Cash Flow operations 196,750 196,750 196,750 196,750 135,500 135,500 135,500 135,500
Initial Investment (850,000)
After Tax Terminal Flow 35,000
Net Working Capital (50,000) 50,000
After Tax Cash flows (850,000) 146,750 196,750 196,750 196,750 135,500 135,500 135,500 220,500
Scenario 2-Large Balloons and Company sell
Year 0 Year 1 Year 2 Year 3 Year 4
Operating Revenue 562,500 562,500 562,500 562,500
Less operating Costs 300,000 300,000 300,000 300,000
Less Rent 50,000 50,000 50,000 50,000
Operating profit 212,500 212,500 212,500 212,500
Less Depreciation Exp 160,000 160,000 160,000 160,000
Net Income before tax 52,500 52,500 52,500 52,500
Less Income Tax 15,750 15,750 15,750 15,750
Net Income after Tax 36,750 36,750 36,750 36,750
Add Depreciation 160,000 160,000 160,000 160,000
After Tax Cash Flow operations 196,750 196,750 196,750 196,750
Initial Investment (850,000)
After Tax Terminal Flow 280,000
Net Working Capital (50,000) 50,000
After Tax Cash flows (850,000) 146,750 196,750 196,750 526,750
11

Scenario 3-Small Balloons and Company does not sell
Year 0 Year 1 Year 2 Year 3 Year 4 Year 5 Year 6 Year 7 Year 8
Operating Revenue 262,500 262,500 262,500 262,500 225,000 225,000 225,000 225,000
Less operating Costs 120,000 120,000 120,000 120,000 120,000 120,000 120,000 120,000
Less Rent - - - - - - - -
Operating profit 142,500 142,500 142,500 142,500 105,000 105,000 105,000 105,000
Less Depreciation Exp 100,000 100,000 100,000 100,000 100,000 100,000 100,000 100,000
Net Income before tax 42,500 42,500 42,500 42,500 5,000 5,000 5,000 5,000
Less Income Tax 12,750 12,750 12,750 12,750 1,500 1,500 1,500 1,500
Net Income after Tax 29,750 29,750 29,750 29,750 3,500 3,500 3,500 3,500
Add Depreciation 100,000 100,000 100,000 100,000 100,000 100,000 100,000 100,000
After Tax Cash Flow operations 129,750 129,750 129,750 129,750 103,500 103,500 103,500 103,500
Initial Investment (530,000)
After Tax Terminal Flow 21,000
Net Working Capital (30,000) 30,000
After Tax Cash flows (530,000) 99,750 129,750 129,750 129,750 103,500 103,500 103,500 154,500
Scenario 4-Small Balloons and Company sell
Year 0 Year 1 Year 2 Year 3 Year 4
Operating Revenue 262,500 262,500 262,500 262,500
Less operating Costs 120,000 120,000 120,000 120,000
Less Rent - - - -
Operating profit 142,500 142,500 142,500 142,500
Less Depreciation Exp 100,000 100,000 100,000 100,000
Net Income before tax 42,500 42,500 42,500 42,500
Less Income Tax 12,750 12,750 12,750 12,750
Net Income after Tax 29,750 29,750 29,750 29,750
Add Depreciation 100,000 100,000 100,000 100,000
After Tax Cash Flow operations 129,750 129,750 129,750 129,750
Initial Investment (530,000)
After Tax Terminal Flow 56,000
Net Working Capital (30,000) 30,000
After Tax Cash flows (530,000) 99,750 129,750 129,750 215,750
12
Paraphrase This Document
Need a fresh take? Get an instant paraphrase of this document with our AI Paraphraser

Calculations and Formula
1 Operating revenue = Revenue_High *50% + Revenue_low * 25%+ Revenue_High *25%
Operating revenue = Revenue_High *50% + Revenue_low * 25%+ Revenue_low *25%
2 Operating costs are given variable and fixed costs
3 Rent is $50,000 p.a Large balloon and nill for small balloons
4 Operating profit =operating revenue - operating costs-rent
5 Depreciation expense p.a = cost of ballooon*20%
6 Net Income before tax = operating profit - depreciation expense
7 Income tax = Net income before tax *tax rate (30%)
8 Net Income after tax = Net income before tax - income tax
9 After Tax Cash Flow operations =Net income after tax + depreciation expense
10 Initial Investment= cost of ballloon plus shipping and installation
11 After Tax Terminal Cash flow = Salvage value *(1- tax rate)
12 Net Working Change is given and recoverable at end of project
13
After Tax cash flows = After Tax cash flow operations + Initial investment +After Tax Terminal
Cash flows +Net Working change in capital
14 NPV is the Net present value of the after tax cash flows at the company's discount rate
15 IRR ( Internal Rate of Return) is the return required when NPV is set to zero
13
1 out of 14
Related Documents

Your All-in-One AI-Powered Toolkit for Academic Success.
+13062052269
info@desklib.com
Available 24*7 on WhatsApp / Email
Unlock your academic potential
© 2024 | Zucol Services PVT LTD | All rights reserved.