Brazil Market Research: Launching the Climp Fecha Facil Garbage Bag
VerifiedAdded on 2023/06/12
|19
|2224
|429
Report
AI Summary
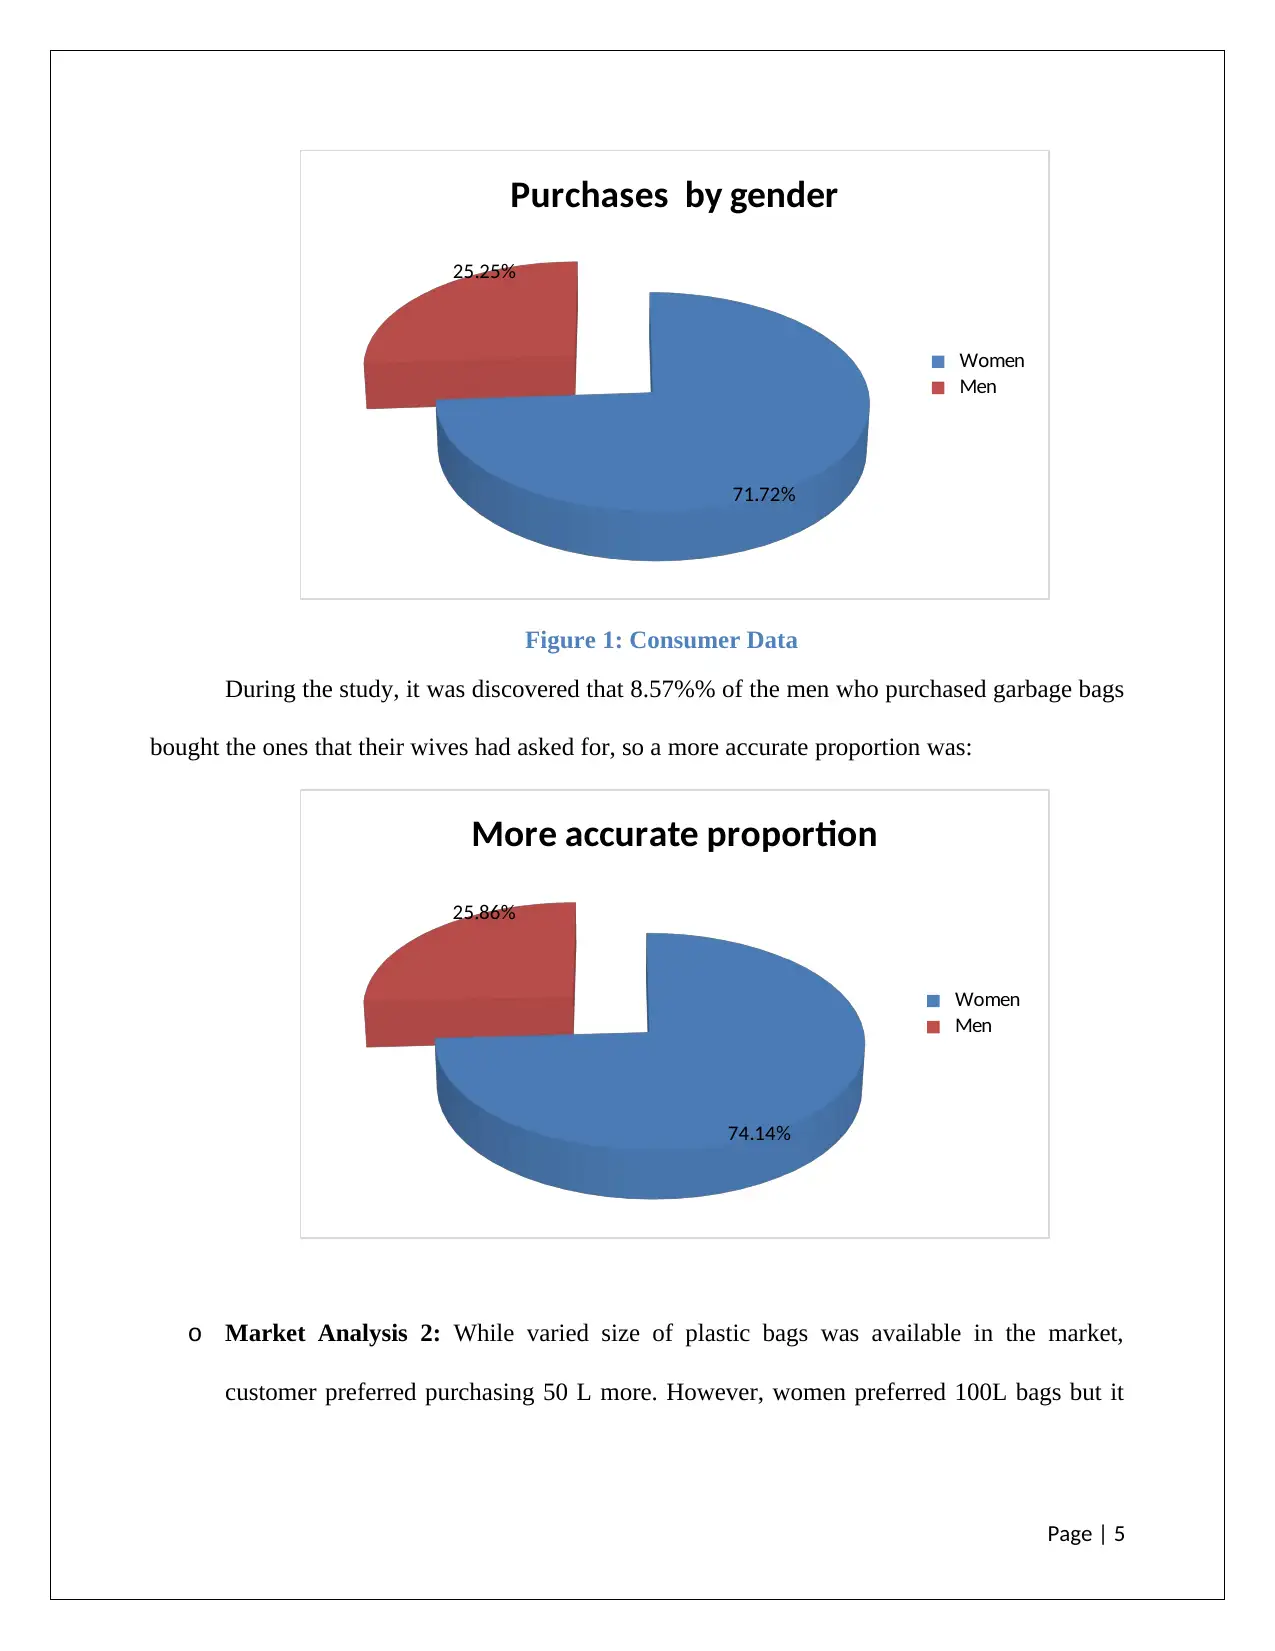
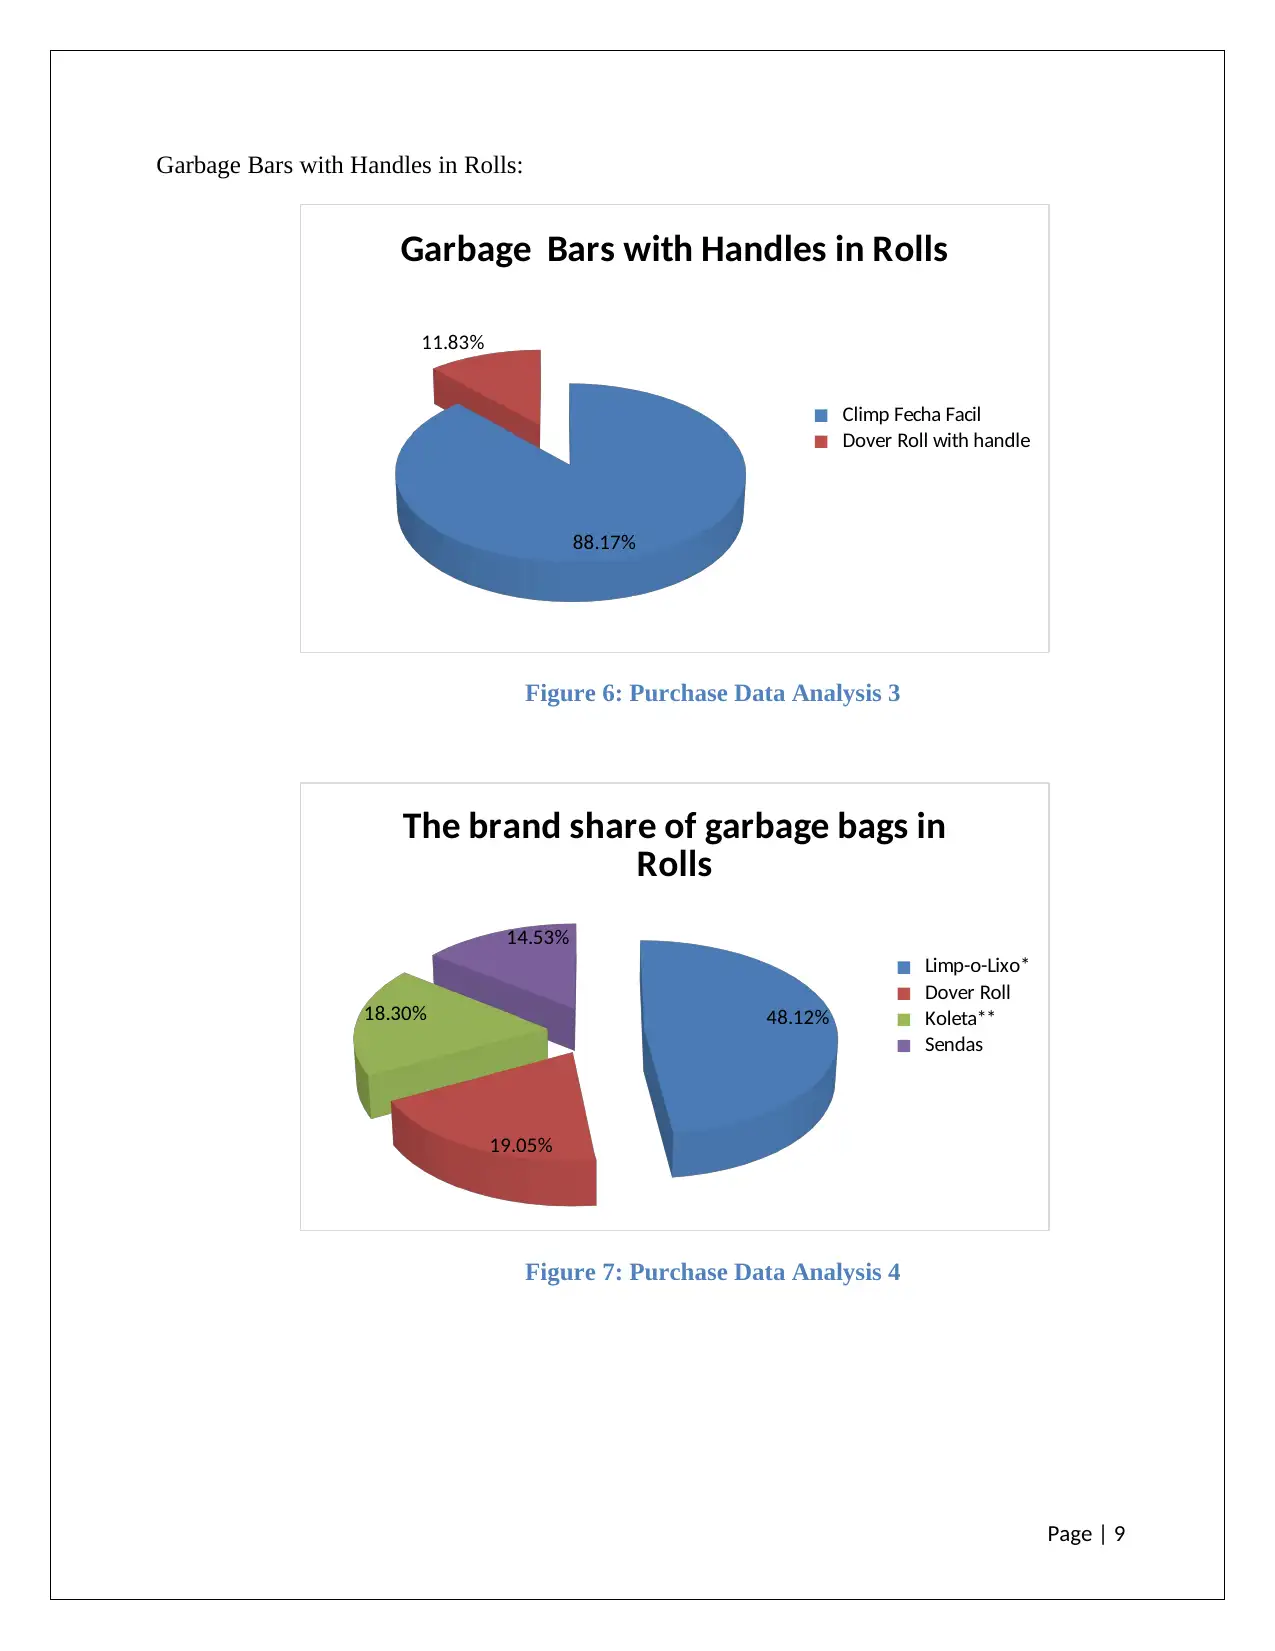
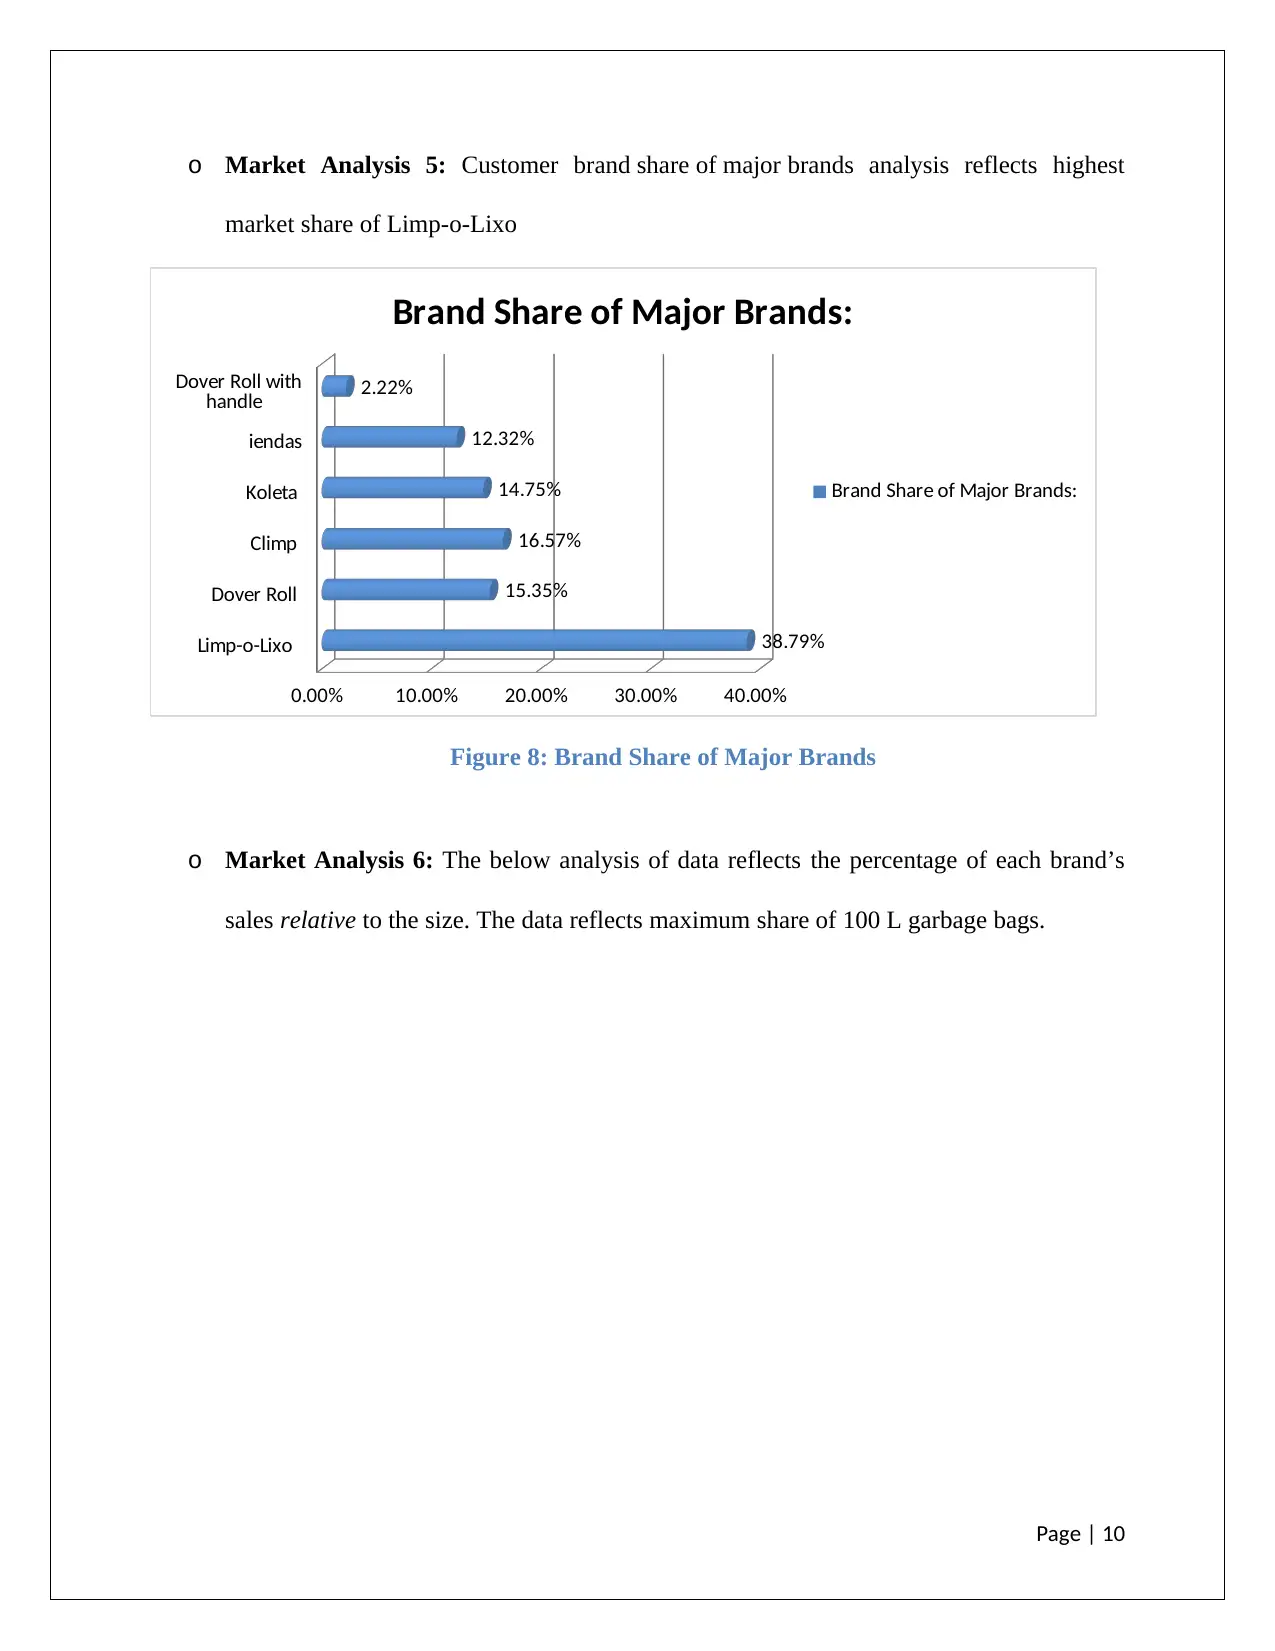
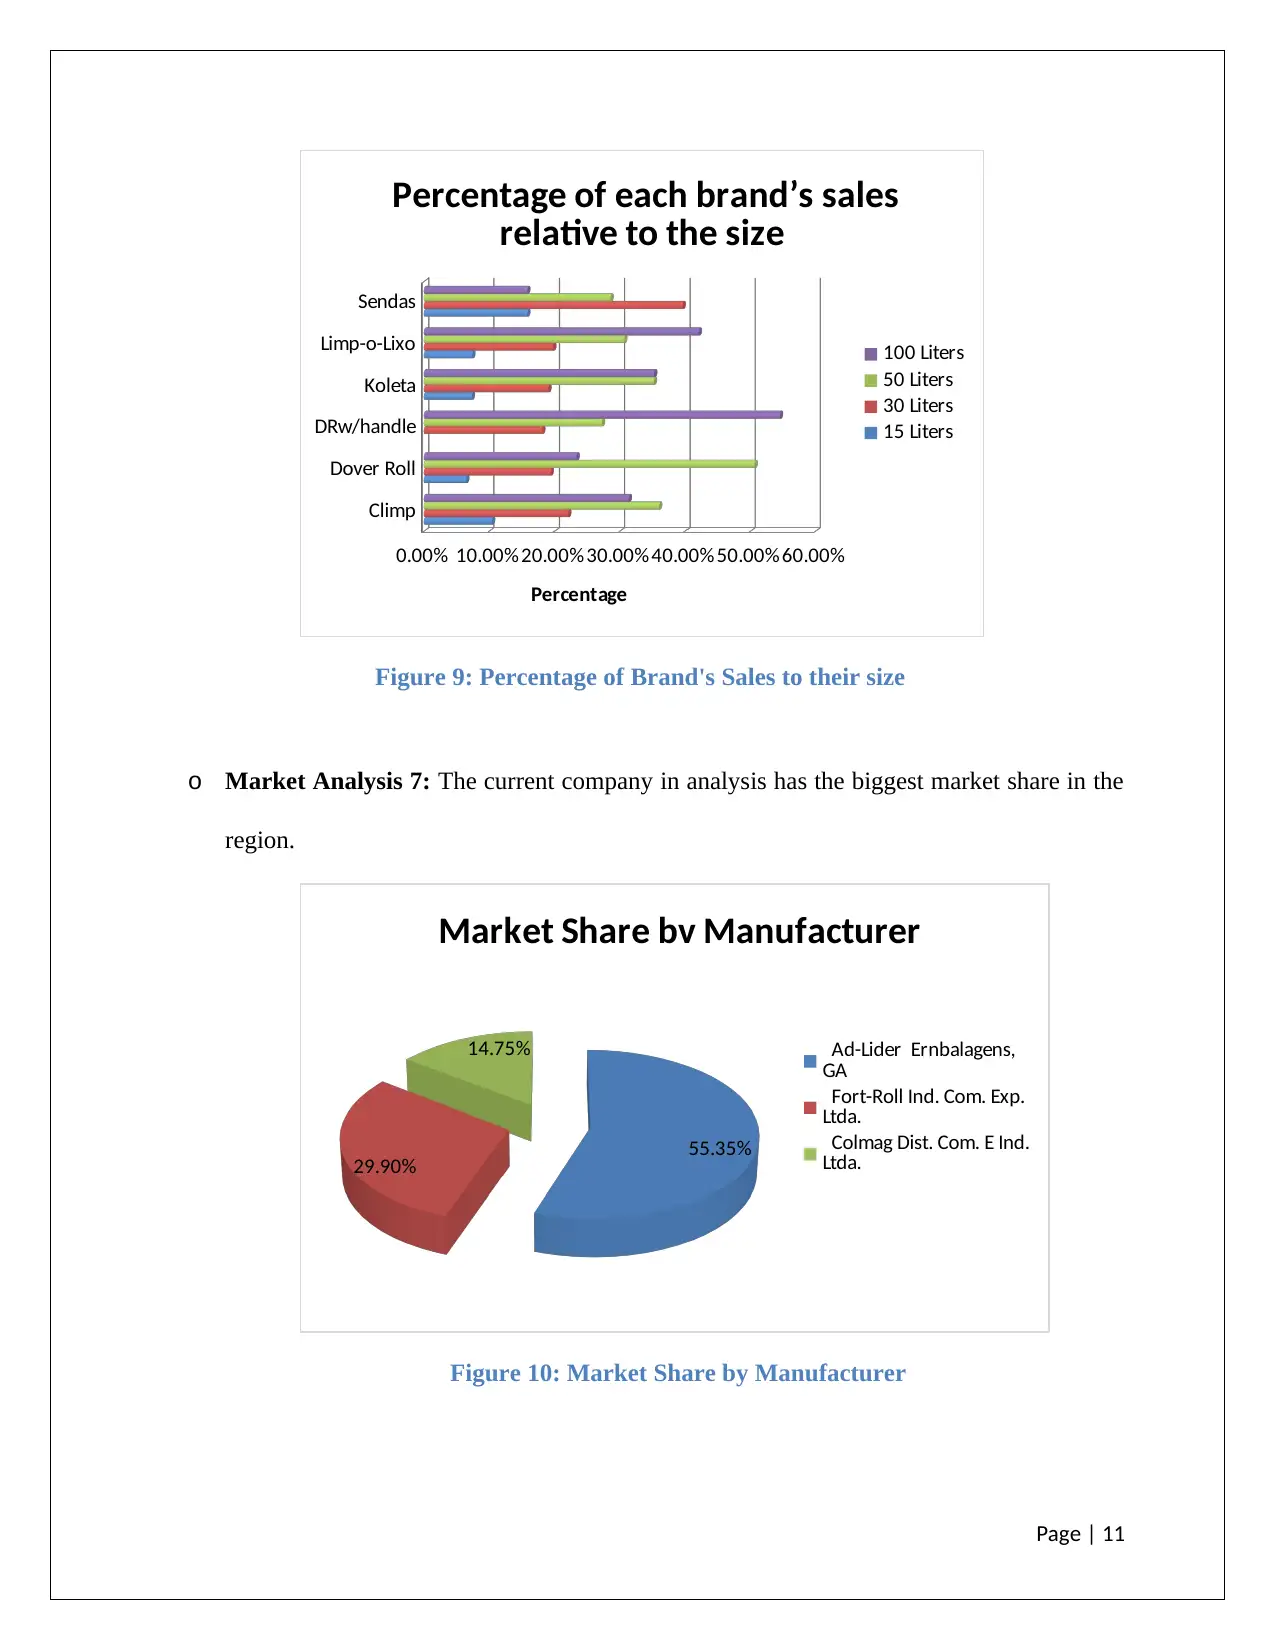
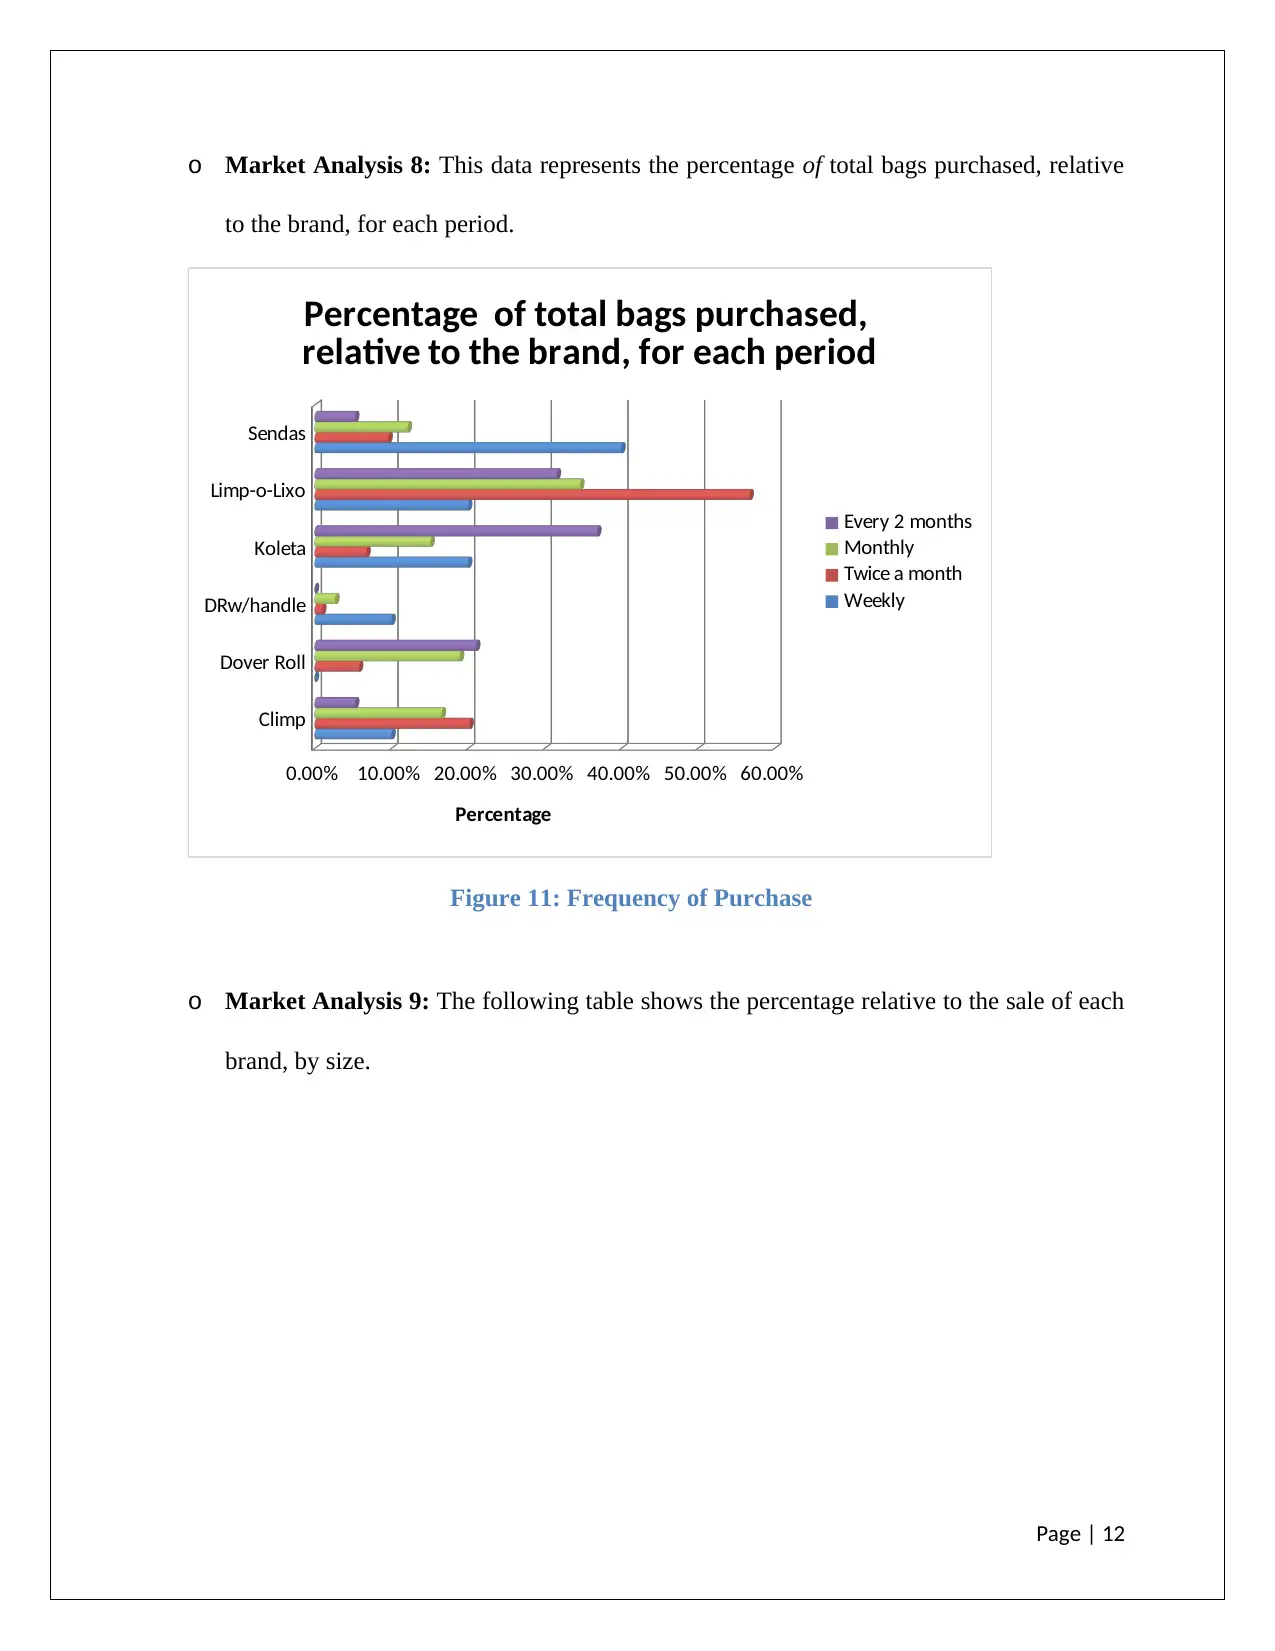
This report presents a comprehensive market research analysis for the launch of Climp Fecha Facil garbage bags in Brazil, specifically targeting the Sao Paulo and Rio de Janeiro regions. The research employs both qualitative and quantitative data, gathered through focus groups and individual interviews, to identify customer preferences and existing gaps in the market. Key findings highlight a demand for 100L garbage bags with handles, addressing issues of leakage and ease of handling. The report includes an analysis of consumer demographics, brand preferences, and purchasing habits, culminating in a proposed marketing mix and STP (Segmentation, Targeting, Positioning) strategy to maximize market penetration and sustainability. The analysis suggests a significant opportunity for Climp Fecha Facil bags to gain market share by fulfilling unmet consumer needs and leveraging environmentally conscious marketing.

Market Research of the
Climp Fecha Facil bag
Student Name: Student ID:
Subject Name: Subject ID:
Date Due: Professor Name:
Page | 1
Climp Fecha Facil bag
Student Name: Student ID:
Subject Name: Subject ID:
Date Due: Professor Name:
Page | 1
Paraphrase This Document
Need a fresh take? Get an instant paraphrase of this document with our AI Paraphraser

Abstract
Brazil’s economy provides immense opportunity for growth and development of new
products. The scope of the study deals with analysis of market research for new product launch.
The current product launch is garbage bag and market research conducted reflects tremendous
opportunity in Sao Paulo and Rio de Jeneiro region for the same.
Page | 2

Table of Contents
Abstract............................................................................................................................................2
Table of Figures...............................................................................................................................3
1.0 Introduction...........................................................................................................................4
2.0 Market Research Design and Implementation...........................................................................4
3.0 Climp Fecha Facil Bag Launch...............................................................................................15
4.0 Recommendations and Conclusion..........................................................................................18
5.0 Reference List..........................................................................................................................19
Table of Figures
Figure 1: Consumer Data.............................................................................................................................5
Figure 2: Percentage of different size of Bags.............................................................................................6
Figure 3: Customer Brand Preference with Gender.....................................................................................7
Figure 4: Purchase Data Analysis 1.............................................................................................................8
Figure 5: Purchase Data Analysis 2.............................................................................................................8
Figure 6: Purchase Data Analysis 3.............................................................................................................9
Figure 7: Purchase Data Analysis 4.............................................................................................................9
Figure 8: Brand Share of Major Brands.....................................................................................................10
Figure 9: Percentage of Brand's Sales to their size....................................................................................11
Figure 10: Market Share by Manufacturer.................................................................................................11
Figure 11: Frequency of Purchase.............................................................................................................12
Figure 12: Percentage Sale related to Size and Brand................................................................................13
Figure 13: Period of Purchase....................................................................................................................13
Figure 14: Percentage Sale of Each Brand.................................................................................................14
Figure 15: Average Time between Purchase.............................................................................................15
Figure 16: Marketing Mix.........................................................................................................................16
Figure 17: STP Model.................................................................................................................................17
Page | 3
⊘ This is a preview!⊘
Do you want full access?
Subscribe today to unlock all pages.

Trusted by 1+ million students worldwide

1.0 Introduction
Market research and data analysis is a crucial component prior to any product launch
(Tanner & Raymond, 2015). Brazil’s economy has been booming in the recent past allowing
opportunity for various products to enter and flourish in the market. The scope of this current
analysis deals with Ad-Lider Embalagens, SA new product launch in the market. Through
qualitative and quantitative data analysis a brief review of market survey is examined as given
below.
2.0 Market Research Design and Implementation
Market Design: The Company has conducted several consumer data analysis across Sao
Paulo and Rio de Janeiro in Brazil to understand customer demand and product preferences. Data
collected by two methods using focus groups interviews and individual interviews reflected a gap
in product existing in garbage bags (Luan & Sudhir, 2010). There are two other prominent
competitors in the market, offering similar variety of bags. Sizes of bags came in 20 L, 30 L, 40
L, 50 L, 60 L and 100 L. In each of the varied product size segment customer helped identify
some or the other usage problem. Customer data collected and analysed had been segregated in
three distinct categories as A, B and C, which encompassed variables including education.
Following are some graphical representation along with analysis of data collected by the
company.
o Market Analysis 1: Mostly women comprised of purchasers of garbage bags. They went
to supermarkets mostly for making such purchases.
Page | 4
Paraphrase This Document
Need a fresh take? Get an instant paraphrase of this document with our AI Paraphraser

71.72%
25.25%
Purchases by gender
Women
Men
Figure 1: Consumer Data
During the study, it was discovered that 8.57%% of the men who purchased garbage bags
bought the ones that their wives had asked for, so a more accurate proportion was:
74.14%
25.86%
More accurate proportion
Women
Men
o Market Analysis 2: While varied size of plastic bags was available in the market,
customer preferred purchasing 50 L more. However, women preferred 100L bags but it
Page | 5

was rather difficult to handle them within apartments. They complained regarding leak
and garbage bags having no end to tie.
8.68%
22.49%
35.31%
33.52%
Percentage of diffrent size of Bags
15 Liters
30 Liters
50 Liters
100 Liters
Figure 2: Percentage of different size of Bags
o Market Analysis 3: The below mentioned analysis depicts brand preference of
customers, in accordance with the gender of the consumer. Market leader in garbage bags
can easily be identified from the presentation being Limp-o-Lixo. Though many women
customers preferred the present company’s roll garbage bags.
Page | 6
⊘ This is a preview!⊘
Do you want full access?
Subscribe today to unlock all pages.

Trusted by 1+ million students worldwide

Climp
Dover Roll
Dover Roll w/handle
Koleta
Limp-o-Lixo
Sendas
0.00% 10.00% 20.00% 30.00% 40.00%
Brand preference, in accordance with the
gender of the consumer
Male
Female
Percentage
Figure 3: Customer Brand Preference with Gender
o Market Analysis 4: A critical data collected from the market to understand customer
preferences and gaps in demand that exists. Analysing these potential gaps in current
existing products can allow opportunity for new product designing and launch.
Page | 7
Paraphrase This Document
Need a fresh take? Get an instant paraphrase of this document with our AI Paraphraser

81.21%
18.79%
The percentage of garbage bags in
rolls, with and without handles
Garbage bags in rolls
Garbage bags w/handles
in rolls
Figure 4: Purchase Data Analysis 1
The brand share of garbage bags in rolls was calculated:
48.12%
19.05%
18.30%
14.53%
The brand share of
garbage bags in Rolls
Limp-o-Lixo*
Dover Roll
Koleta**
Sendas
Figure 5: Purchase Data Analysis 2
Page | 8

Garbage Bars with Handles in Rolls:
88.17%
11.83%
Garbage Bars with Handles in Rolls
Climp Fecha Facil
Dover Roll with handle
Figure 6: Purchase Data Analysis 3
48.12%
19.05%
18.30%
14.53%
The brand share of garbage bags in
Rolls
Limp-o-Lixo*
Dover Roll
Koleta**
Sendas
Figure 7: Purchase Data Analysis 4
Page | 9
88.17%
11.83%
Garbage Bars with Handles in Rolls
Climp Fecha Facil
Dover Roll with handle
Figure 6: Purchase Data Analysis 3
48.12%
19.05%
18.30%
14.53%
The brand share of garbage bags in
Rolls
Limp-o-Lixo*
Dover Roll
Koleta**
Sendas
Figure 7: Purchase Data Analysis 4
Page | 9
⊘ This is a preview!⊘
Do you want full access?
Subscribe today to unlock all pages.

Trusted by 1+ million students worldwide

o Market Analysis 5: Customer brand share of major brands analysis reflects highest
market share of Limp-o-Lixo
Limp-o-Lixo
Dover Roll
Climp
Koleta
iendas
Dover Roll with
handle
0.00% 10.00% 20.00% 30.00% 40.00%
38.79%
15.35%
16.57%
14.75%
12.32%
2.22%
Brand Share of Major Brands:
Figure 8: Brand Share of Major Brands
o Market Analysis 6: The below analysis of data reflects the percentage of each brand’s
sales relative to the size. The data reflects maximum share of 100 L garbage bags.
Page | 10
Paraphrase This Document
Need a fresh take? Get an instant paraphrase of this document with our AI Paraphraser

Climp
Dover Roll
DRw/handle
Koleta
Limp-o-Lixo
Sendas
0.00% 10.00%20.00%30.00%40.00%50.00%60.00%
Percentage of each brand’s sales
relative to the size
100 Liters
50 Liters
30 Liters
15 Liters
Percentage
Figure 9: Percentage of Brand's Sales to their size
o Market Analysis 7: The current company in analysis has the biggest market share in the
region.
55.35%
29.90%
14.75%
Market Share bv Manufacturer
Ad-Lider Ernbalagens,
GA
Fort-Roll Ind. Com. Exp.
Ltda.
Colmag Dist. Com. E Ind.
Ltda.
Figure 10: Market Share by Manufacturer
Page | 11

o Market Analysis 8: This data represents the percentage of total bags purchased, relative
to the brand, for each period.
Climp
Dover Roll
DRw/handle
Koleta
Limp-o-Lixo
Sendas
0.00% 10.00% 20.00% 30.00% 40.00% 50.00% 60.00%
Percentage of total bags purchased,
relative to the brand, for each period
Every 2 months
Monthly
Twice a month
Weekly
Percentage
Figure 11: Frequency of Purchase
o Market Analysis 9: The following table shows the percentage relative to the sale of each
brand, by size.
Page | 12
⊘ This is a preview!⊘
Do you want full access?
Subscribe today to unlock all pages.

Trusted by 1+ million students worldwide
1 out of 19
Related Documents

Your All-in-One AI-Powered Toolkit for Academic Success.
+13062052269
info@desklib.com
Available 24*7 on WhatsApp / Email
Unlock your academic potential
Copyright © 2020–2025 A2Z Services. All Rights Reserved. Developed and managed by ZUCOL.