An In-depth Analysis of Brazil's Productivity and Monetary Policies
VerifiedAdded on 2022/10/14
|10
|2155
|7
Report
AI Summary
This report provides an in-depth analysis of Brazil's economic performance, focusing on total factor productivity (TFP) and monetary policy. It examines Brazil's slow TFP growth, particularly its negative contribution during specific periods, contrasting it with the contributions of capital and labor. The report highlights the volatility of TFP and its limited contribution to GDP growth, using figures and comparisons to other countries. It also explores the impact of labor accumulation and human capital quality on Brazil's growth relative to other nations. The report further delves into the Mexican economy's financial distress due to monetary policies, contrasting discretionary versus rule-based monetary policy and the consequences of the Mexican government's decisions, including devaluation. The analysis compares the advantages and disadvantages of discretionary monetary policy against currency board rules, drawing conclusions about the importance of stable economic policies.
BRAZIL 1
Brazil
Name
Course
Tutor
University
City/State
Date
Brazil
Name
Course
Tutor
University
City/State
Date
Paraphrase This Document
Need a fresh take? Get an instant paraphrase of this document with our AI Paraphraser
BRAZIL 2
Productivity is an important parameter as it serves as a signal to technical efficiency that
demonstrates how firms, industries, and different sectors or the state convert measured inputs
into finished products. The most common measures of productivity entail labor productivity and
total factor productivity (Araújo , et al., 2018). On the other hand, with regards discretion, the
monetary institution has the freedom to operate as per its judgment. A good illustration is if
legislation gave directives to the Federal Reserve to act in its best interest to ensure that the
economy is performing at its best and gifted the monetary authority the tools that it has, the
Federal Reserve, in this case, would be said to be exercising discretionary monetary policy. A
rule, on the other hand, is a limitation on the monetary authority’s discretion. Thus, a rule entails
regulating actions of the monetary authority.
The derivation of total factor productivity entails obtaining the residual of out after the
effect of all evaluated inputs gets accounted for, importantly, labor which entails the
augmentation regarding the quality of human capital, and capital. Thus, TFP encompasses the
efficiency where all inputs are integrated into the production process. TFP, as an evolving
concept, can be thought of as an economic parameter that evaluates technical progress. The
growth of TFP can be a result of reallocating resources to firms that are more efficient across
industries or also due to innovations. Innovation in this context can be as a result of developing a
new product and technology and adapting existing technologies and processes. Thus, the primary
determinant of variations in the rates of economic growth is how various countries use
disposable inputs.
Brazil’s total factor productivity has recorded slow pace in growth exhibiting a negative
contribution in the period between 1996-2015 (de Souza & da Cunha, 2018).TFP’s contribution
to economy-related growth moved from negative 29% during 1996-2003 to positive 39% during
BRAZIL 3
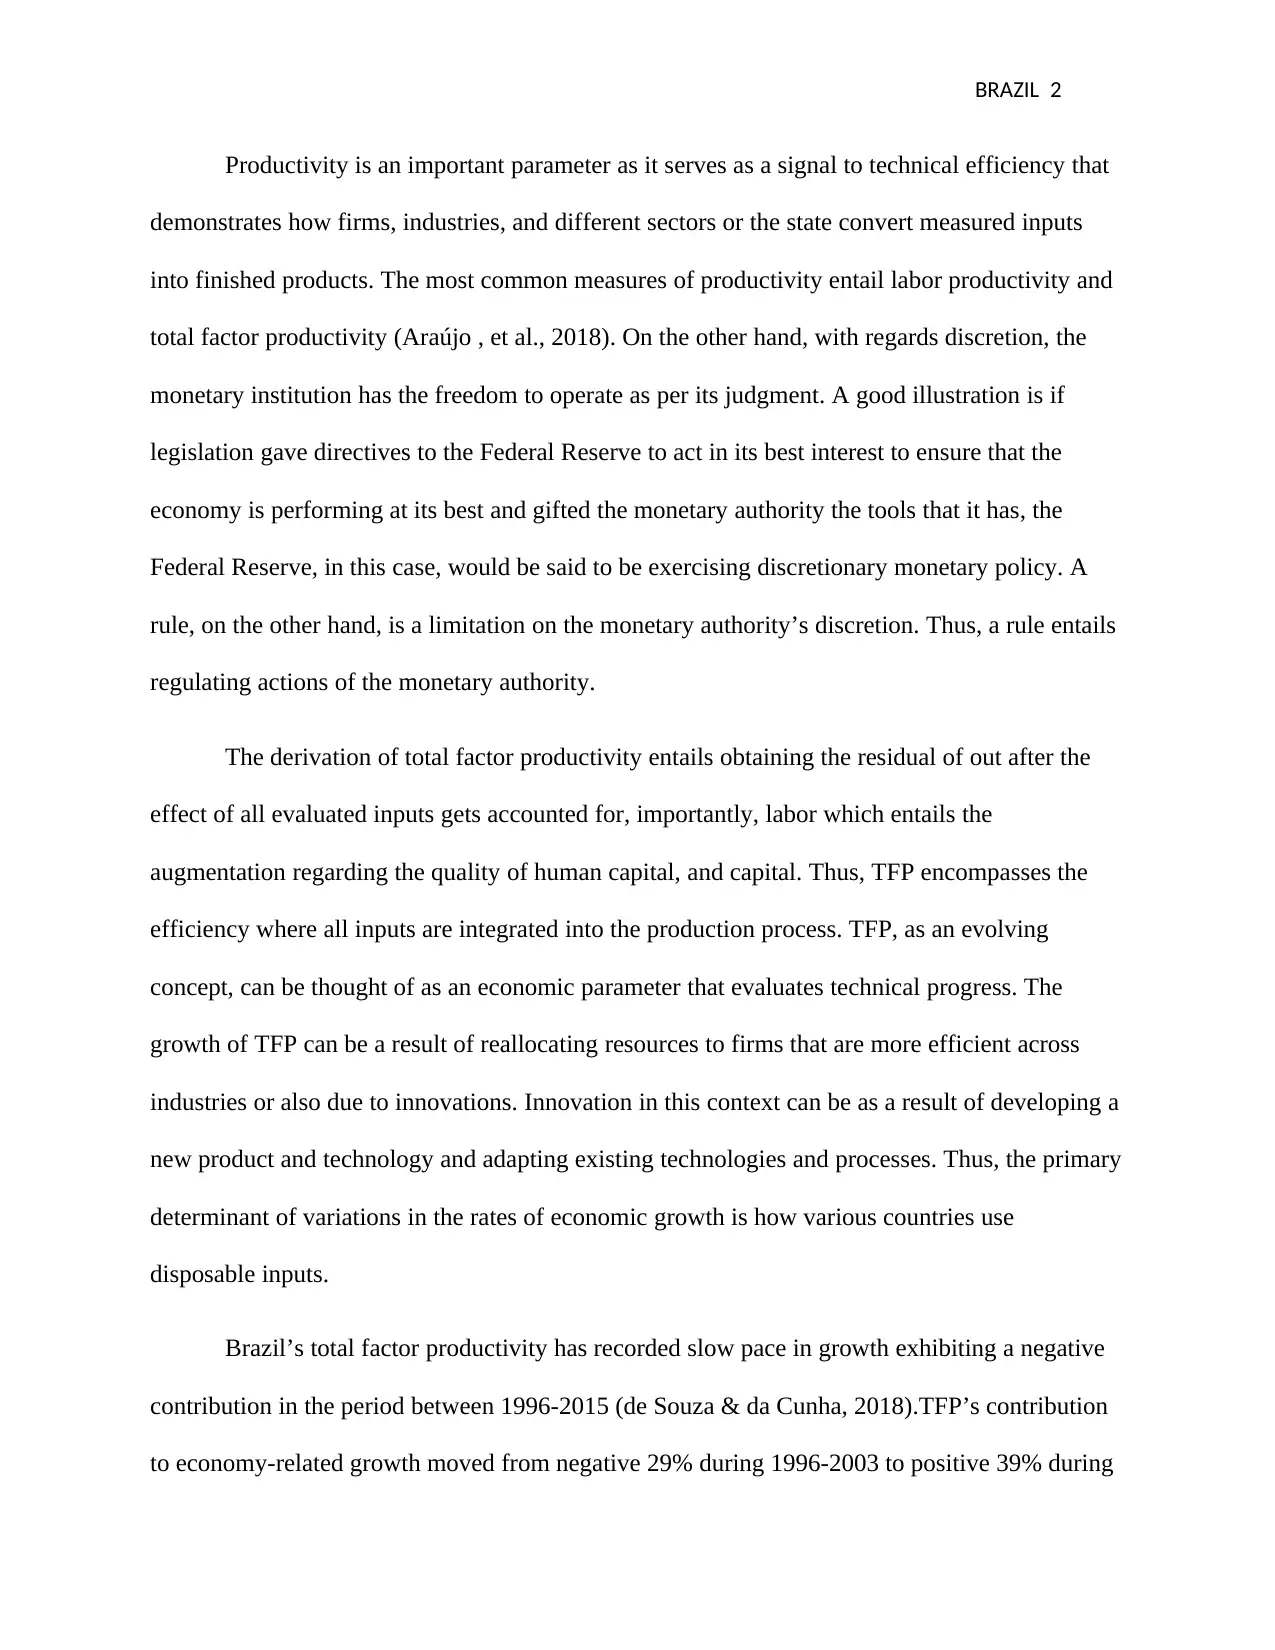
2003-2009, to again negative 57% in 2009-2015 (Araújo , et al., 2018). This fundamentally
portrays that the calculation of TFP as a residual as per the accounting concepts regarding
standard growth. Thus, the latest phase of a growth slowdown and recession seems to have arisen
from the negative contribution of productivity, though this might have been caused by
unobserved elements that are integrated into the TFP residual, for instance, the increment in
spare capacity and inventories. As such, the outcome of the analysis reveals overtime that the
Brazilian economy may not have grown following improvements in productivity.
Figure 1. Downward trend in growth, particularly during 1974-1981 and after 2010
1961
1965
1969
1973
1977
1981
1985
1989
1993
1997
2001
2005
2009
2013
-5
-3
-1
1
3
5
7
9
11
13
15 (real GDP growth and its trend, percentage points)
GDP growth rate Trend, HP filter
Source: WDI
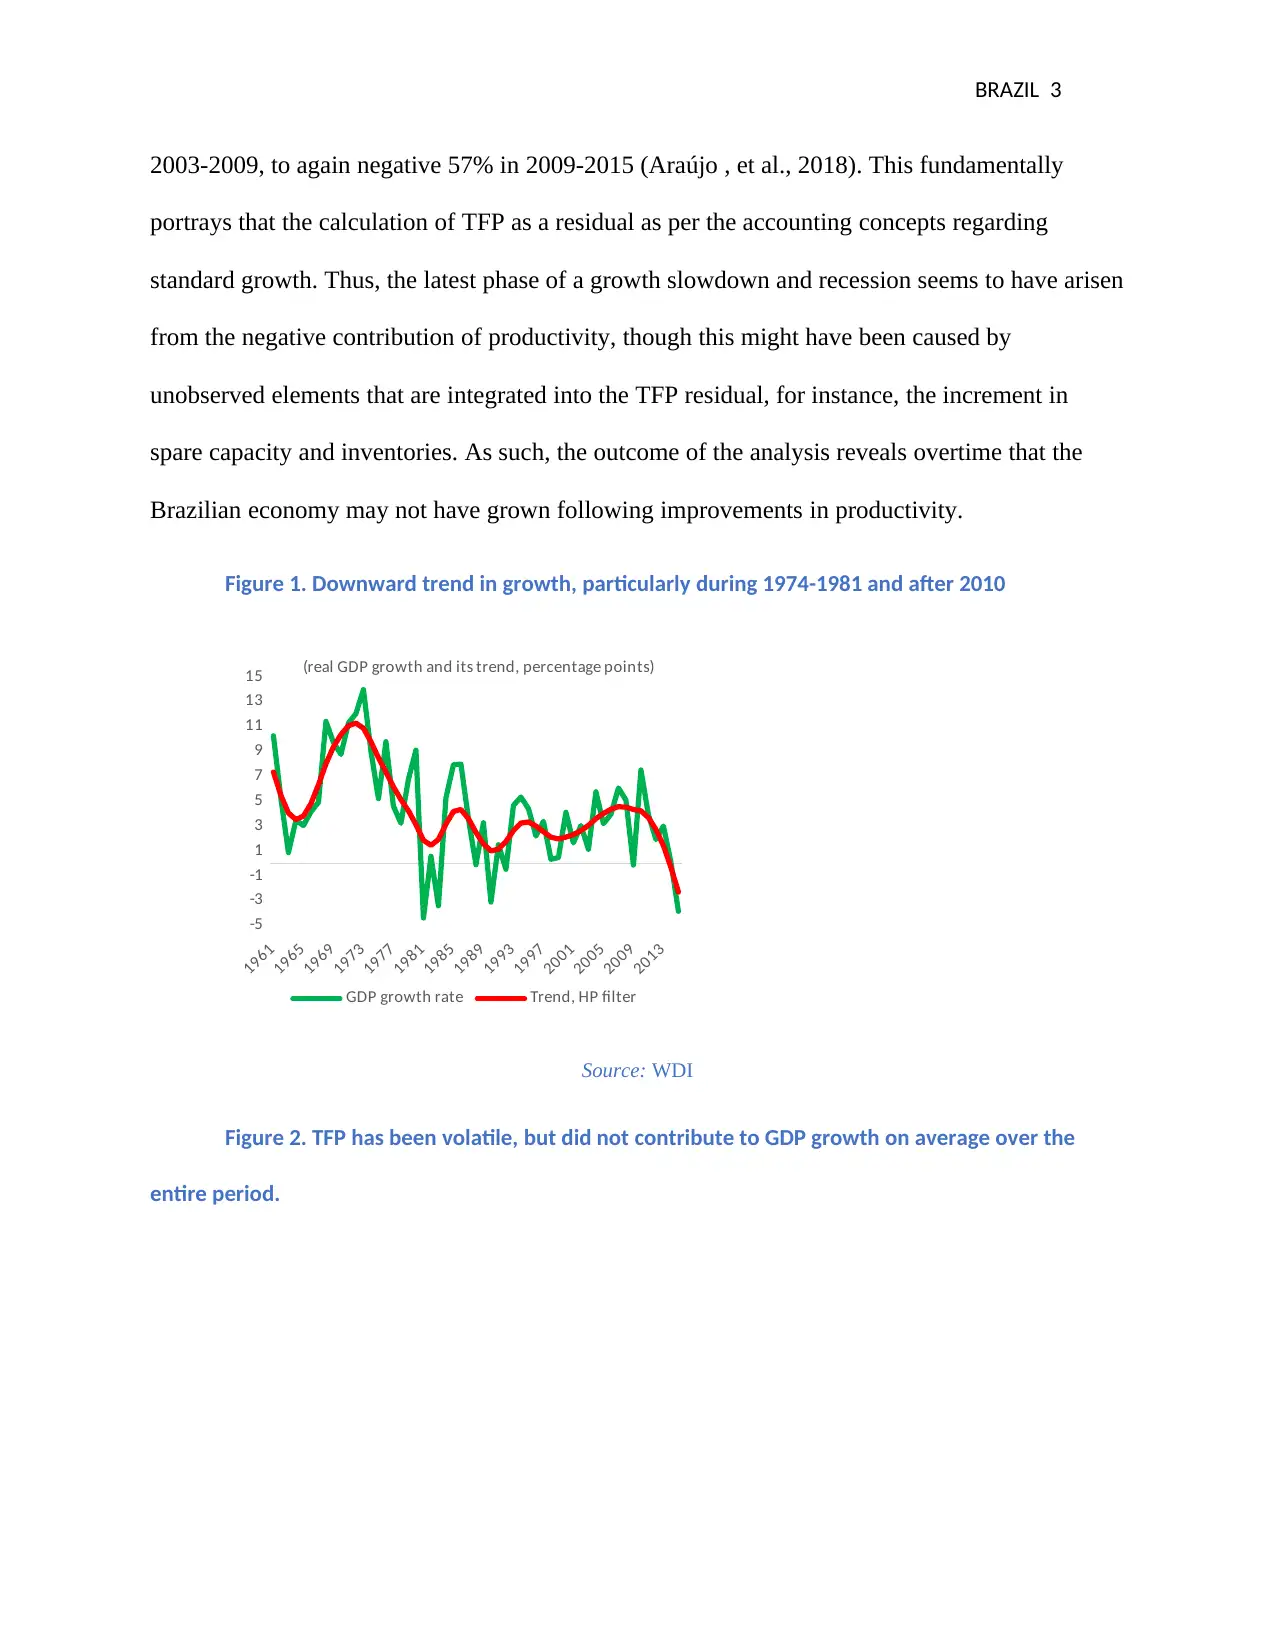
Figure 2. TFP has been volatile, but did not contribute to GDP growth on average over the
entire period.
2003-2009, to again negative 57% in 2009-2015 (Araújo , et al., 2018). This fundamentally
portrays that the calculation of TFP as a residual as per the accounting concepts regarding
standard growth. Thus, the latest phase of a growth slowdown and recession seems to have arisen
from the negative contribution of productivity, though this might have been caused by
unobserved elements that are integrated into the TFP residual, for instance, the increment in
spare capacity and inventories. As such, the outcome of the analysis reveals overtime that the
Brazilian economy may not have grown following improvements in productivity.
Figure 1. Downward trend in growth, particularly during 1974-1981 and after 2010
1961
1965
1969
1973
1977
1981
1985
1989
1993
1997
2001
2005
2009
2013
-5
-3
-1
1
3
5
7
9
11
13
15 (real GDP growth and its trend, percentage points)
GDP growth rate Trend, HP filter
Source: WDI
Figure 2. TFP has been volatile, but did not contribute to GDP growth on average over the
entire period.
⊘ This is a preview!⊘
Do you want full access?
Subscribe today to unlock all pages.
Trusted by 1+ million students worldwide
BRAZIL 4
1997
1999
2001
2003
2005
2007
2009
2011
2013
2015
-5
-3
-1
1
3
5
7
(real GDP growth and contributions, percentage
points)
Human Capital Labor
Capital Total Factor Productivity
Real GDP
Source: IBGE, world bank staff calculation
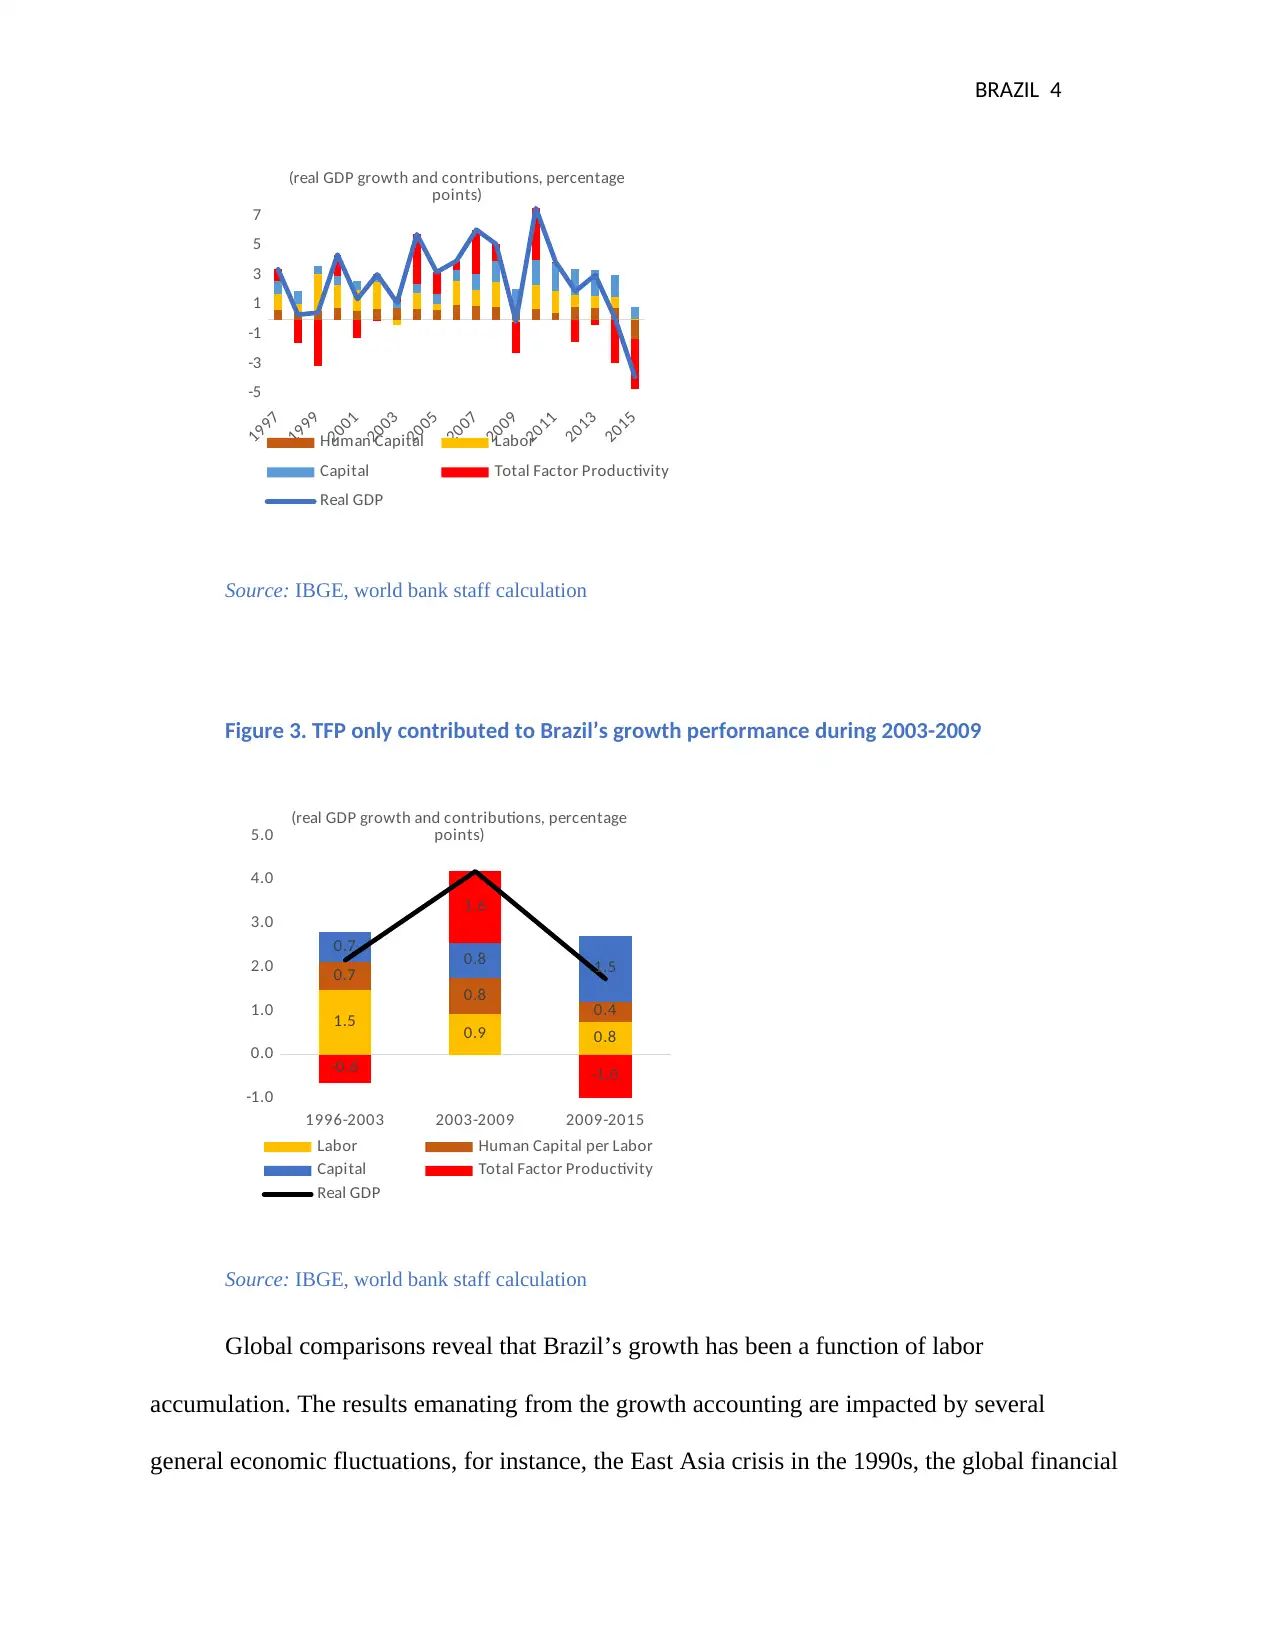
Figure 3. TFP only contributed to Brazil’s growth performance during 2003-2009
1996-2003 2003-2009 2009-2015
-1.0
0.0
1.0
2.0
3.0
4.0
5.0
1.5 0.9 0.8
0.7
0.8 0.4
0.7 0.8 1.5
-0.6
1.6
-1.0
(real GDP growth and contributions, percentage
points)
Labor Human Capital per Labor
Capital Total Factor Productivity
Real GDP
Source: IBGE, world bank staff calculation
Global comparisons reveal that Brazil’s growth has been a function of labor
accumulation. The results emanating from the growth accounting are impacted by several
general economic fluctuations, for instance, the East Asia crisis in the 1990s, the global financial
1997
1999
2001
2003
2005
2007
2009
2011
2013
2015
-5
-3
-1
1
3
5
7
(real GDP growth and contributions, percentage
points)
Human Capital Labor
Capital Total Factor Productivity
Real GDP
Source: IBGE, world bank staff calculation
Figure 3. TFP only contributed to Brazil’s growth performance during 2003-2009
1996-2003 2003-2009 2009-2015
-1.0
0.0
1.0
2.0
3.0
4.0
5.0
1.5 0.9 0.8
0.7
0.8 0.4
0.7 0.8 1.5
-0.6
1.6
-1.0
(real GDP growth and contributions, percentage
points)
Labor Human Capital per Labor
Capital Total Factor Productivity
Real GDP
Source: IBGE, world bank staff calculation
Global comparisons reveal that Brazil’s growth has been a function of labor
accumulation. The results emanating from the growth accounting are impacted by several
general economic fluctuations, for instance, the East Asia crisis in the 1990s, the global financial
Paraphrase This Document
Need a fresh take? Get an instant paraphrase of this document with our AI Paraphraser
BRAZIL 5
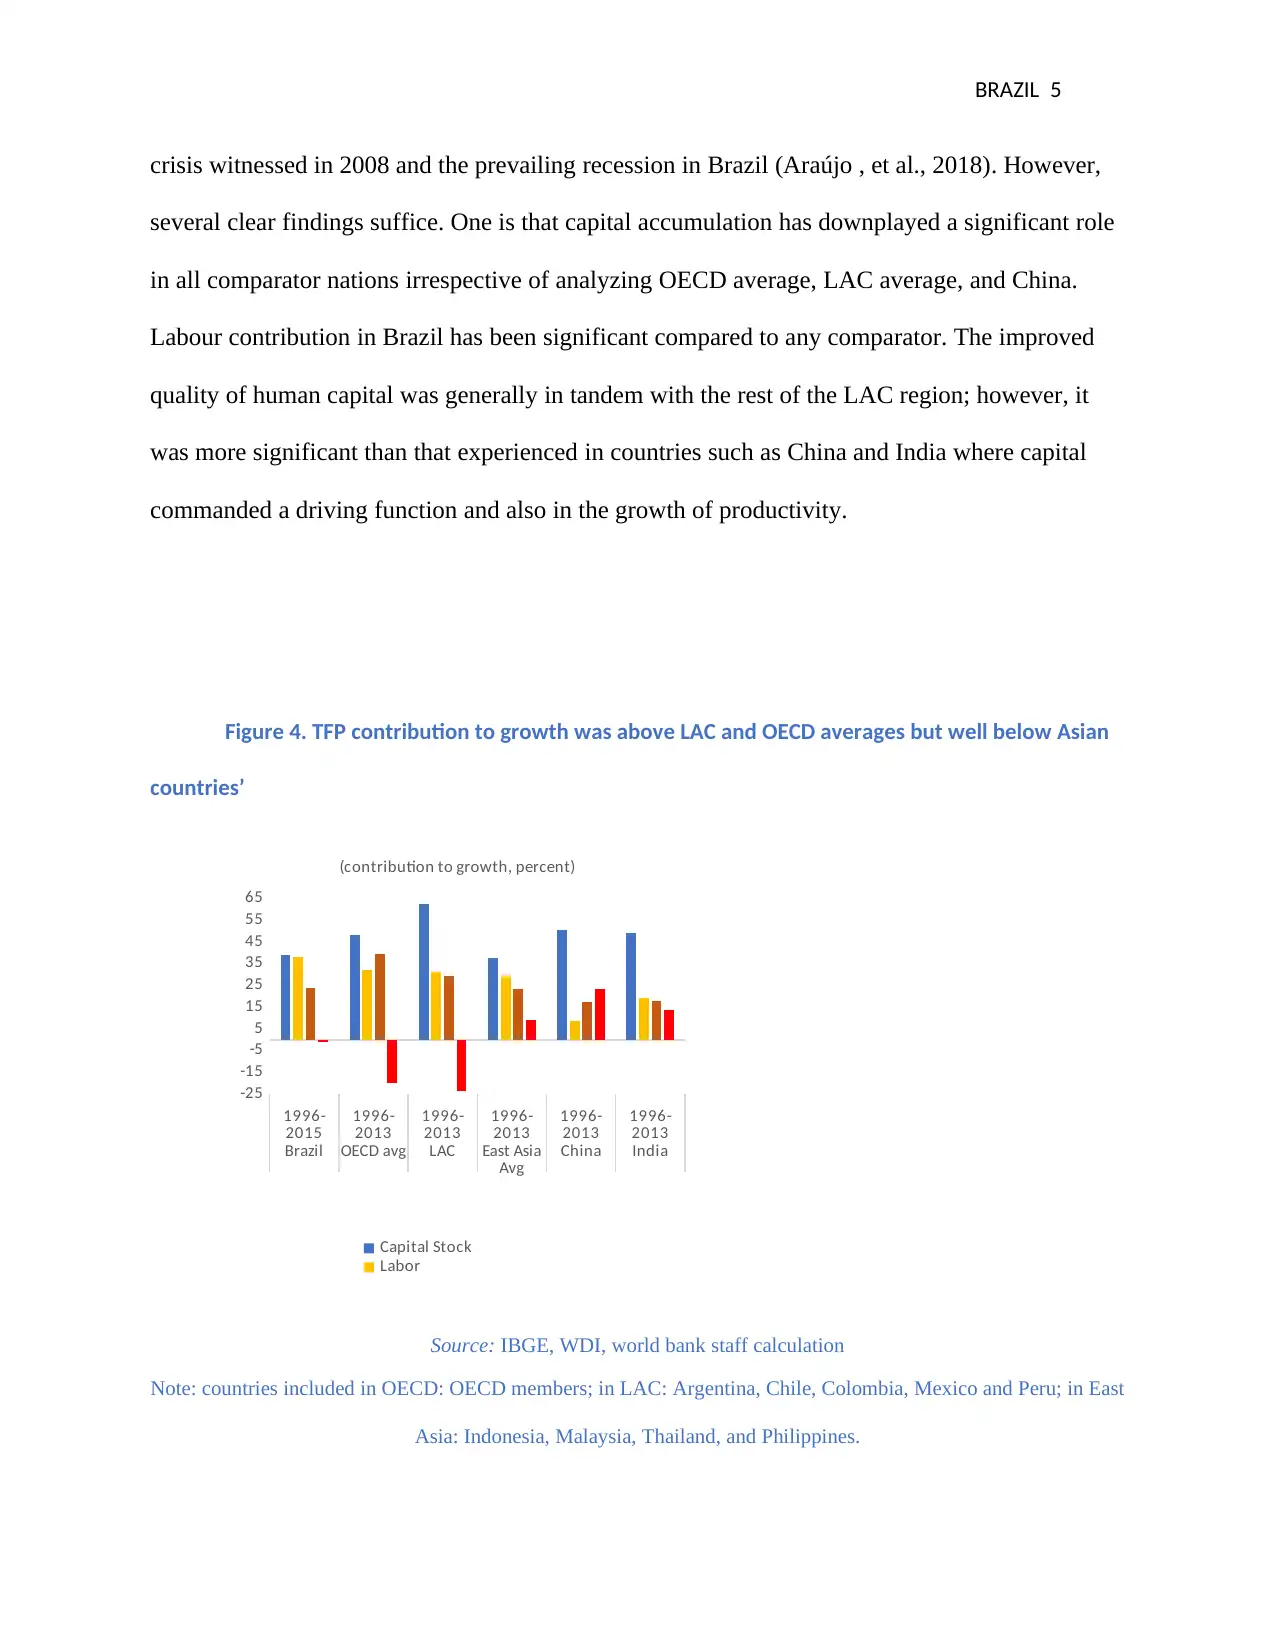
crisis witnessed in 2008 and the prevailing recession in Brazil (Araújo , et al., 2018). However,
several clear findings suffice. One is that capital accumulation has downplayed a significant role
in all comparator nations irrespective of analyzing OECD average, LAC average, and China.
Labour contribution in Brazil has been significant compared to any comparator. The improved
quality of human capital was generally in tandem with the rest of the LAC region; however, it
was more significant than that experienced in countries such as China and India where capital
commanded a driving function and also in the growth of productivity.
Figure 4. TFP contribution to growth was above LAC and OECD averages but well below Asian
countries’
1996-
2015
1996-
2013
1996-
2013
1996-
2013
1996-
2013
1996-
2013
Brazil OECD avg LAC East Asia
Avg
China India
-25
-15
-5
5
15
25
35
45
55
65
(contribution to growth, percent)
Capital Stock
Labor
Source: IBGE, WDI, world bank staff calculation
Note: countries included in OECD: OECD members; in LAC: Argentina, Chile, Colombia, Mexico and Peru; in East
Asia: Indonesia, Malaysia, Thailand, and Philippines.
BRAZIL 6
Brazil recorded low TFP as portrayed by the country’s labor productivity which grew less
compared to advanced economies and other emerging nations in the past two decades. This
entails computing value-added per employee as a proxy for labor productivity. The valued-added
per employee in Brazil in between 1995 and 2015 has been rising at approximately the same rate
as the Latin America and the Caribbean (LAC) nations, though slightly below that reported in
advanced and emerging economies (Araújo , et al., 2018). However, it declined in 2009 in
comparison to other countries in the world. Nevertheless, since 2014, while other emerging and
developed economies exhibited an upward trend in the value-added per employee, the trend in
Brazil and LAC reversed, where Brazil’s rate declined faster compared to LAC. Also, during this
period, the gap regarding labor productivity entailing Brazil and LAC and developed and
emerging economies continued widening. This was contrary to other emerging nations that
recorded productivity in labor growing faster compared to developed economies since 2014, thus
moving to bridge their productivity gap eventually.
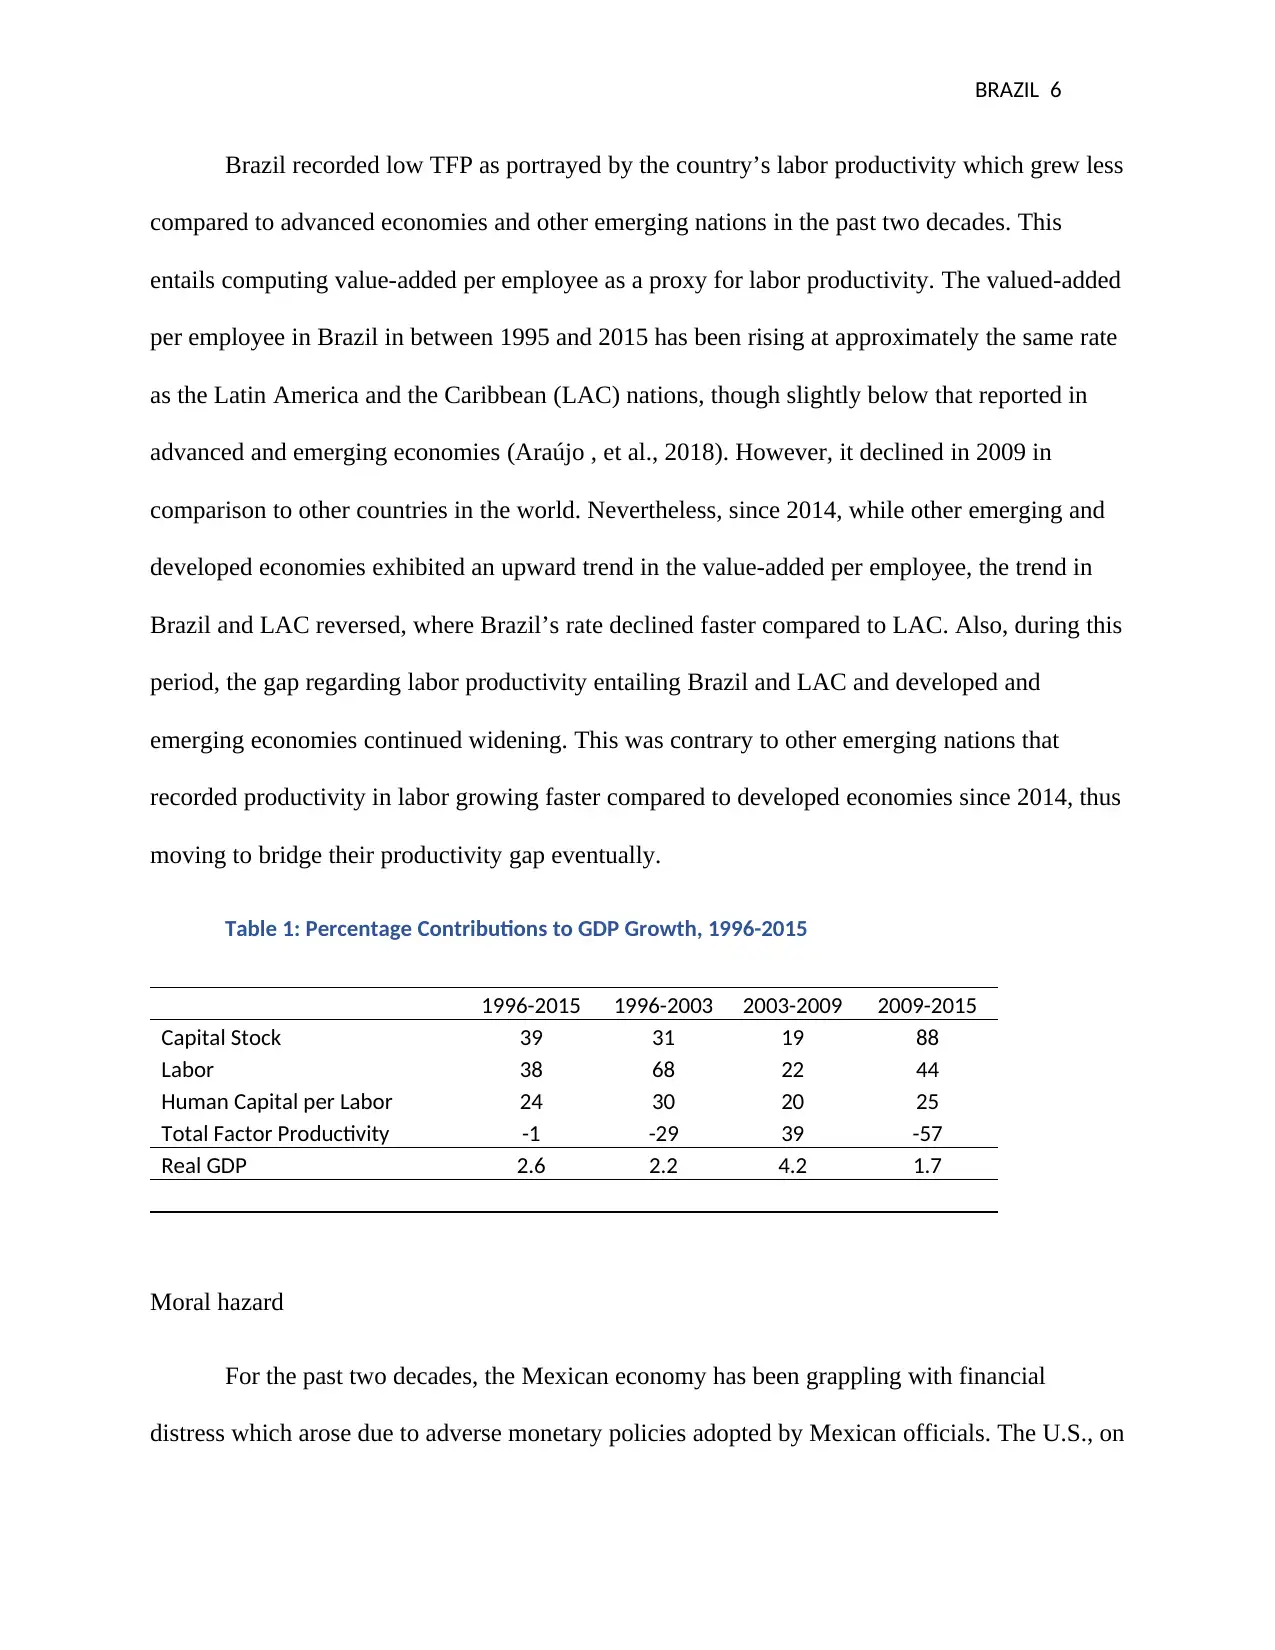
Table 1: Percentage Contributions to GDP Growth, 1996-2015
1996-2015 1996-2003 2003-2009 2009-2015
Capital Stock 39 31 19 88
Labor 38 68 22 44
Human Capital per Labor 24 30 20 25
Total Factor Productivity -1 -29 39 -57
Real GDP 2.6 2.2 4.2 1.7
Moral hazard
For the past two decades, the Mexican economy has been grappling with financial
distress which arose due to adverse monetary policies adopted by Mexican officials. The U.S., on
Brazil recorded low TFP as portrayed by the country’s labor productivity which grew less
compared to advanced economies and other emerging nations in the past two decades. This
entails computing value-added per employee as a proxy for labor productivity. The valued-added
per employee in Brazil in between 1995 and 2015 has been rising at approximately the same rate
as the Latin America and the Caribbean (LAC) nations, though slightly below that reported in
advanced and emerging economies (Araújo , et al., 2018). However, it declined in 2009 in
comparison to other countries in the world. Nevertheless, since 2014, while other emerging and
developed economies exhibited an upward trend in the value-added per employee, the trend in
Brazil and LAC reversed, where Brazil’s rate declined faster compared to LAC. Also, during this
period, the gap regarding labor productivity entailing Brazil and LAC and developed and
emerging economies continued widening. This was contrary to other emerging nations that
recorded productivity in labor growing faster compared to developed economies since 2014, thus
moving to bridge their productivity gap eventually.
Table 1: Percentage Contributions to GDP Growth, 1996-2015
1996-2015 1996-2003 2003-2009 2009-2015
Capital Stock 39 31 19 88
Labor 38 68 22 44
Human Capital per Labor 24 30 20 25
Total Factor Productivity -1 -29 39 -57
Real GDP 2.6 2.2 4.2 1.7
Moral hazard
For the past two decades, the Mexican economy has been grappling with financial
distress which arose due to adverse monetary policies adopted by Mexican officials. The U.S., on
⊘ This is a preview!⊘
Do you want full access?
Subscribe today to unlock all pages.
Trusted by 1+ million students worldwide
BRAZIL 7
the other hand, acted by lending more money to the government of Mexico as an immediate
palliative. The overall effect is a set of controversial incentives for Mexican administrators and
international investors that facilitates that the crisis resurfaces on a larger magnitude (Meltzer,
2011). Also, the application of Exchange Stabilization Fund by the Treasury and the Federal
Reserve to finance an administration’s international ventures leads to concerns regarding
constitutional matters regarding the separation of authority and ignores the fundamentals of
Central bank autonomy.
Unfortunately, there is no caveat to avoiding the expenses imposed by adverse economic
policies created in the past. The only alternative is to promote market forces, promote the
existence of robust private property rights, stabilize prices, and use a floating exchange rate for
the peso. It by strengthening the institutions that yield such outcomes will Mexico improve its
standards of living.
Loans from international bodies such as the IMF and World Bank are imperative in
addressing a crisis only in short-term but get counterproductive in the long run. The new global
order is that of market solutions as opposed to intrusion by the state.
Rules vs. discretion
Discretionary vs rule in monetary policy in Mexico
As of 1994, the monetary base of Mexico remained relatively stable and subsequently
increased in October despite shrinking of its foreign reserves. This demonstrated that Mexico
was less conservative in accepting divisions from the rules adopted the current board. The
MB$FR ratio moved to the accepted limit of 1.62 in Mexico in December the day prior to
devaluation. It was obvious that a devaluation was more probable in a nation that was backed
Paraphrase This Document
Need a fresh take? Get an instant paraphrase of this document with our AI Paraphraser
BRAZIL 8
only 20% of its monetary base with foreign reserves as was the case with Mexico towards the
end of 1994; compared to a state that backs 80% or more of its monetary base with foreign
reserves. Surprisingly, until October 1994, Mexico was accustomed to managing its monetary
base using a rule that was beyond the rigor of the standards set by the currency board. Prior to
the fourth-quarter in 1994, MB$FR ratio in Mexico was tagged below one, which implied that
Mexico’s foreign reserves were more than its monetary base. After 1994, Mexico repudiated its
policy without any warnings. The high ratio exhibited in the MB$FR in the fourth quarter
implied that Mexico’s Central Bank was no longer in charge of exchanging the country’s
monetary base for dollars at the pledged exchange rate, rendering Mexico open to speculative
attack, thus, Mexico had to devalue its currency by more than 60%.
The uncertainty associated with a speculative attack became self-fulfilling, leading to a
string of events that facilitated devaluation towards the end of 1994 (Zarazaga, 1996). It is the
continuous drain of Mexico’s foreign exchange that led to the banking industry getting exposed
to the risk entailing liquidity crunch. Thus, the Mexican monetary institutions attempted
preempting the financial uncertainty by operating as the country’s lender of last resort. The
discount window loans ended up expanding the monetary base above the foreign reserves
threshold and this rendered Mexico susceptible to devaluation and speculative attacks
(Kocherlakota, 2016). The expansion of the monetary base via Mexico’s supreme bank discount
window amidst shrinking foreign exchange reserves seems counteractive with the pegged
exchange rate regime that was effective at the time. However, such responses were not
inconsistent depending on the reasons provided by the monetary authorities that the capital
outflows and subsequent decline of foreign reserves were short-term and would normalize once
the worries of political catastrophe were over and that the threshold for local currency had also
BRAZIL 9
increased. However, some problems arose as pointed out by Banco de Mexico as the impact of
Mexico’s political uncertainty regarding creditworthiness was underestimated, and the increase
in demand for pesos got overestimated.
Something seemed awkward. Mexico most probably experienced the same challenge that
several countries had faced, their currencies getting devalued following miscalculations by
policymakers about expanding the money base unbacked by foreign reserves (Aragon &
Portugal, 2009). Regarding the case of Mexico, the monetary authorities had allowed the use of
discount window and thus the increase of the unbacked monetary supply to a quantity that was
beyond what the market was willing to accommodate. Since the source of the problem may not
have been unskilled policymakers but the discretion they enjoyed while imposing monetary
policy. For instance, preempting bank runs, then the only remedy to fix the problem would
involve removing the discretion enjoyed by policymakers. This is the logic behind favoring
currency board rules as opposed to discretion.
In conclusion, it is evident how discretionary monetary policy in Mexico led to the
country devaluing its currency following less backing with foreign currency. The result was the
country had limited foreign exchange reserves. In terms of total factor productivity, Mexico has a
lot to remedy to experience growth in its economy.
⊘ This is a preview!⊘
Do you want full access?
Subscribe today to unlock all pages.
Trusted by 1+ million students worldwide
BRAZIL 10
References
Aragon, E. K. & Portugal, M. S., 2009. Central bank preferences and monetary rules under the
inflation targeting regime in Brazil. Brazilian Review of Econometrics, 29(1), pp. 79-109.
Araújo , J. T., Qian, R. & Nucifora, A., 2018. Brazil's Productivity Dynamics, s.l.: s.n.
de Souza, T. A. A. & da Cunha, M. S., 2018. Performance of Brazilian total factor productivity
from 2004 to 2014: a sectoral and regional analysis. Journal of Economic Structures, 7(24), pp.
102-125.
Kocherlakota, N., 2016. Rules versus Discretion: A Reconsideration. Rochester, s.n.
Meltzer, A., 2011. Moral Hazard, the IMF, Mexico and Asia. [Online]
Available at: https://kilthub.cmu.edu/articles/Moral_Hazard_the_IMF_Mexico_and_Asia/
6706994/1
[Accessed 25 September 2019].
Zarazaga, C. E., 1996. Argentina, Mexico,And Currency Boards: Another Case of Rules Versus
Discretion. [Online]
Available at:
https://pdfs.semanticscholar.org/5f94/1e60a7a68f701ee14862eb204788e48001c0.pdf
[Accessed 25 September 2019].
1 out of 10

Your All-in-One AI-Powered Toolkit for Academic Success.
+13062052269
info@desklib.com
Available 24*7 on WhatsApp / Email
![[object Object]](/_next/static/media/star-bottom.7253800d.svg)
Unlock your academic potential
Copyright © 2020–2026 A2Z Services. All Rights Reserved. Developed and managed by ZUCOL.