QB2002 Management Accounting 2: Break-Even Analysis Project Report

Verified

Added on  2023/06/03

|8
|1974
|173
Report
AI Summary
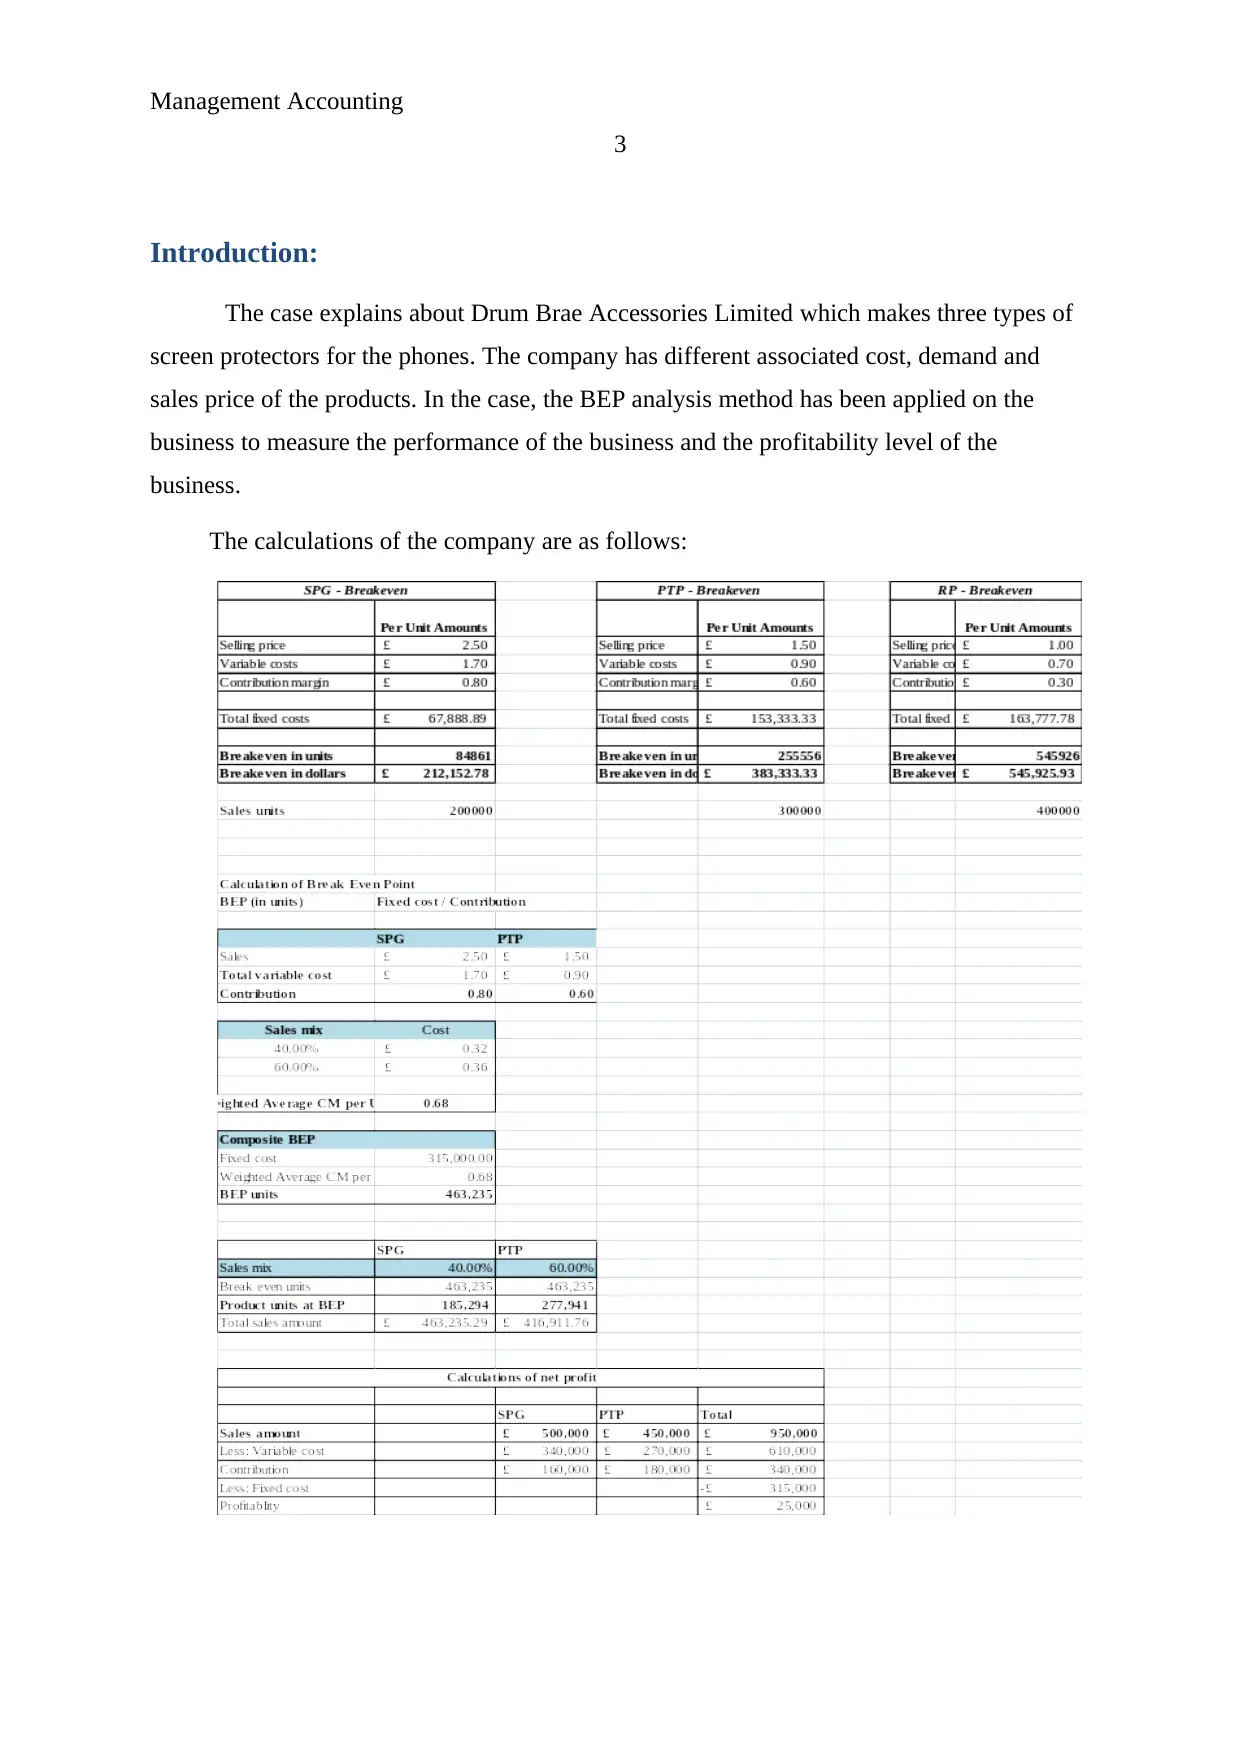
This report analyzes the financial performance of Drum Brae Accessories Limited, focusing on break-even analysis and product discontinuation decisions. The company produces three types of screen protectors (SPG, PTP, and RP) and faces competitive market pressures. The report calculates the break-even point (BEP) in both units and sales value, assesses contribution margins, and evaluates the overall profitability position of the business. It explores the impact of revised fixed cost allocations and identifies which products should be retained based on their BEP levels and sales volumes. The analysis also examines the marketing manager's sales targets and the suitability of the operational manager's approach to fixed cost allocation. The report concludes with recommendations, suggesting changes to sales targets and fixed cost allocation methods to improve the company's overall profitability and performance.
Document Page
Running Head: Management Accounting
1
Project Report: Management Accounting
tabler-icon-diamond-filled.svg

Paraphrase This Document

Need a fresh take? Get an instant paraphrase of this document with our AI Paraphraser
Document Page
Management Accounting
2
Contents
Introduction:.....................................................................................................................3
Part 1:................................................................................................................................4
a.Break-even point (in £s):...........................................................................................4
b.Contribution margin and BEP:..................................................................................4
c.Overall profitability position:....................................................................................4
d.Revised break-even point:.........................................................................................4
e.Products which must be retained:..............................................................................5
f.Overall profitability level:..........................................................................................5
Part 2:................................................................................................................................6
a.Marketing manager’s target.......................................................................................6
b.Suitability of operational manager.............................................................................6
Recommendation and conclusion:....................................................................................7
References:.......................................................................................................................8
Document Page
Management Accounting
3
Introduction:
The case explains about Drum Brae Accessories Limited which makes three types of
screen protectors for the phones. The company has different associated cost, demand and
sales price of the products. In the case, the BEP analysis method has been applied on the
business to measure the performance of the business and the profitability level of the
business.
The calculations of the company are as follows:
Document Page
Management Accounting
4
Part 1:
a. Break-even point (in £s):
The company’s breakeven point is 753261 units and the total BEP sales amount of the
company is £1,129,891.30. The calculations have been given in the above table. It explains
that the £1,35,0000. It explains that in case of composite BEP level of the business, the
company is able to generate the profits because £ 2,20,108 is the margin of safety sales of the
business.
b. Contribution margin and BEP:
The contribution margin and BEP amount of each of the product of the company has
been measured and it has been found that the contribution and BEP of each of the product is
different than other. In case of SPG, it has been found that the contribution per unit is £ 0.18
and the BEP amount of the product is £ 4,18,4478.26. Further, in case of PTP, it has been
found that the contribution per unit is £ 0.20 and the BEP amount of the product £ 3,76,630
(Toomey, 2012).
Lastly, the case evaluation on the RP explains that the Contribution margin per share
and BEP level of the business is £ 0.13 and £ 3,34,783.
c. Overall profitability position:
The overall profitability analysis of business would be zero if the company would be
able to sell only the break even units of the business. As at the level of the break even units,
the company only generate that much revenue which could cover the overall expenses of the
business. If the company sells more unit than the break even units then the company would
be able to generate the profits (Sweeney, 2013).
d. Revised break-even point:
The management of the company has argued that the fixed cost of the business must be
divided among the products on the basis of their sales units. Though, the fixed cost must be
common after deducting all the extra fixed cost of each of the product. On the basis of the
calculations, it has been found that the BEP, contribution per margin etc of each of the
product would be changed in this case.
tabler-icon-diamond-filled.svg

Paraphrase This Document

Need a fresh take? Get an instant paraphrase of this document with our AI Paraphraser
Document Page
Management Accounting
5
In case of SPG, it has been found that the contribution per unit is £ 0.80 and the BEP
amount of the product is £ 2,12,153 which used to be £ 0.8 and £ 4,18,478 earlier. Further, in
case of PTP, it has been found that the contribution per unit is £ 0.60 and the BEP amount of
the product £ 3,83,333 which used to be £ 0.2 and £ 376,630 earlier.
Lastly, the case evaluation on the RP explains that the Contribution margin per share
and BEP level of the business is £ 0.30 and £ 5,45,926 which used to be £ 0.13 and £
3,34,783 earlier. It explains that the huge changes have taken place because of the different
distribution among the fixed cost of the business (Lysons and Farrington, 2012).
e. Products which must be retained:
On the basis of the BEP sales level of each of the product, it has been measured that the
break even units of each of the product is different. In case of SPG, it has been found that the
BEP units is 84,861 units and the BEP amount of the product is £ 2,12,153 whereas the sales
units of the products are 2,00,000. Further, in case of PTP, it has been found that the BEP
units are 2,55,556 and the BEP amount of the product £ 3,83, 333 whereas the sales units of
the products are 3,00,000.
Lastly, the case evaluation on the RP explains that break even units and BEP level of
the business is 5,45,926 and £ 5,45,926 whereas the sales units of the products are 5,00,000.
It explains that in case of SPG and PTP, the break even units are lower than the sales units of
the company whereas in case of RP, the break even units are higher than the sales units of the
business which explains that the RP production must be discounted by the business and the
business must focus on the SPG and PTP products in order to improve the profitability level
of the business (Hussey, 2007).
In case of discounting the RP production from the company, the profitability level of
the business would be improved and it would lead to the business towards better performance
in the market. The case explains that the level of fixed cost would also be reduced from the
business along with the discounting of RP.
f. Overall profitability level:
On the basis of the study on part e, it has been measured that the RP production line
must be eliminated from the business in order to improve the profitability position of the
Document Page
Management Accounting
6
business. The case explains that if the RP production would be eliminated than the fixed cost
of the business would be £ 3,15,000 which would make the changes into the composite BEP
level and the profitability position of the business. The study explains that along with the
changes in the production process of the business, the composite BEP level of the business
has become 4,62,235 units which have been divided among the SPG and PTP (Drury, 2013).
After the evaluation on different BEP of each of the product, total profitability amount
of the company has been recognized and it has been found that after the elimination of the RP
production line, the profit of the business would be £ 25,000.
Part 2:
a. Marketing manager’s target:
On the basis of the overall study on the company, it has been measured that it is
important for the marketing manager of the company to make the changes into their target as
currently, the BEP level of the business is even higher than the sales unit of the business
which lead to the business towards the loss position. In case of SPG and PTP, the sales target
of the business is quite better but n terms of the RP, it has been found that the break even unit
of the business is 5,45,926 whereas the sales unit of the business are 4,00,000 (Weygandt,
Kimmel and Kieso, 2015).
It explains that the marketing team of the company must focus on the RP products and
must improve the sales of the business in order to cover all the associated expense with the
production of the company and improve the profitability level of the business. If the sales
target of the business would be changed than company would not be required to eliminated
the production process of the business.
b. Suitability of operational manager:
The operational manager of the company has argued that the fixed cost of the business
must be divided among the products on the basis of their sales units. Though, the fixed cost
must be common after deducting all the extra fixed cost of each of the product. This is not a
proper allocation method in order to reach over a better conclusion about the performance of
the business. the fixed cost of a business never depends on the sales units of the business or
Document Page
Management Accounting
7
the specific product line and thus the allocation of the resources on the sales unit basis lead to
the worst outcome and worst decisions of the company (Kaplan and Anderson, 2013).
An operational manager is required to measure the different fixed cost of the business
and must be allocate the fixed cost on the basis of their activity. Such as, in this case, the rent
of the building is £ 5000 and the building’s floss space is 500 square feet out of which 100 sq
feet is used by SPG, 200 by PTP and rest 200 by RP than the fixed cost of each of the product
line would be £ 1000, £ 2000 and £ 2000 (Garrison, Noreen, Brewer and McGowan, 2010).
Recommendation and conclusion:
On the basis of the overall study on the production process and the sales target of the
business, it has been found that the sales target of the business must be changed in terms of
the RP sales units. In that case, the company would not be required to eliminate the
production process of the RP products in the business and the profitability level of the
business would be improved. Further, it has also been measured that the fixed cost must not
be divided on the basis of the sales unit of products because it is not a proper fixed cost
allocation method. The fixed cost per sales unit could occur different result and manipulate
the overall results of the business. To conclude, few changes into the production process,
operational changes and the sales target of the company would improve the overall
profitability level of the business.
tabler-icon-diamond-filled.svg

Paraphrase This Document

Need a fresh take? Get an instant paraphrase of this document with our AI Paraphraser
Document Page
Management Accounting
8
References:
DRURY, C. M. 2013. Management and cost accounting. Springer.
Garrison, R. H., Noreen, E. W., Brewer, P. C., and McGowan, A. 2010. Managerial
accounting. Issues in Accounting Education, 25(4), 792-793.
Hussey, D.E., 2007. Strategic Management: From Theory to Implementation, UK: Taylor
and Francis
Kaplan, R., and Anderson, S. R. 2013. Time-driven activity-based costing: a simpler and
more powerful path to higher profits. Harvard business press.
Lysons, K. and Farrington, B. 2012. Purchasing and supply chain management, Harlow,
Essex: Pearson Financial Times
Sweeney, E 2013. The people dimension in logistics and supply chain management – its role
and importance, Supply Chain Management: Perspectives. Issues and Cases. McGraw-Hill:
Milan, pp. 73-82.
Toomey, J., 2012. Inventory Management: Principles, Concepts and Techniques, Germany:
Springer Science and Business Media
Weygandt, J. J., Kimmel, P. D., and Kieso, D. E. 2015. Financial & Managerial Accounting.
John Wiley & Sons.
chevron_up_icon
1 out of 8
circle_padding
hide_on_mobile
zoom_out_icon
[object Object]