Break Even Point Analysis Report - Finance Module, University Project

Verified

Added on  2023/01/13

|5
|356
|58
Report
AI Summary
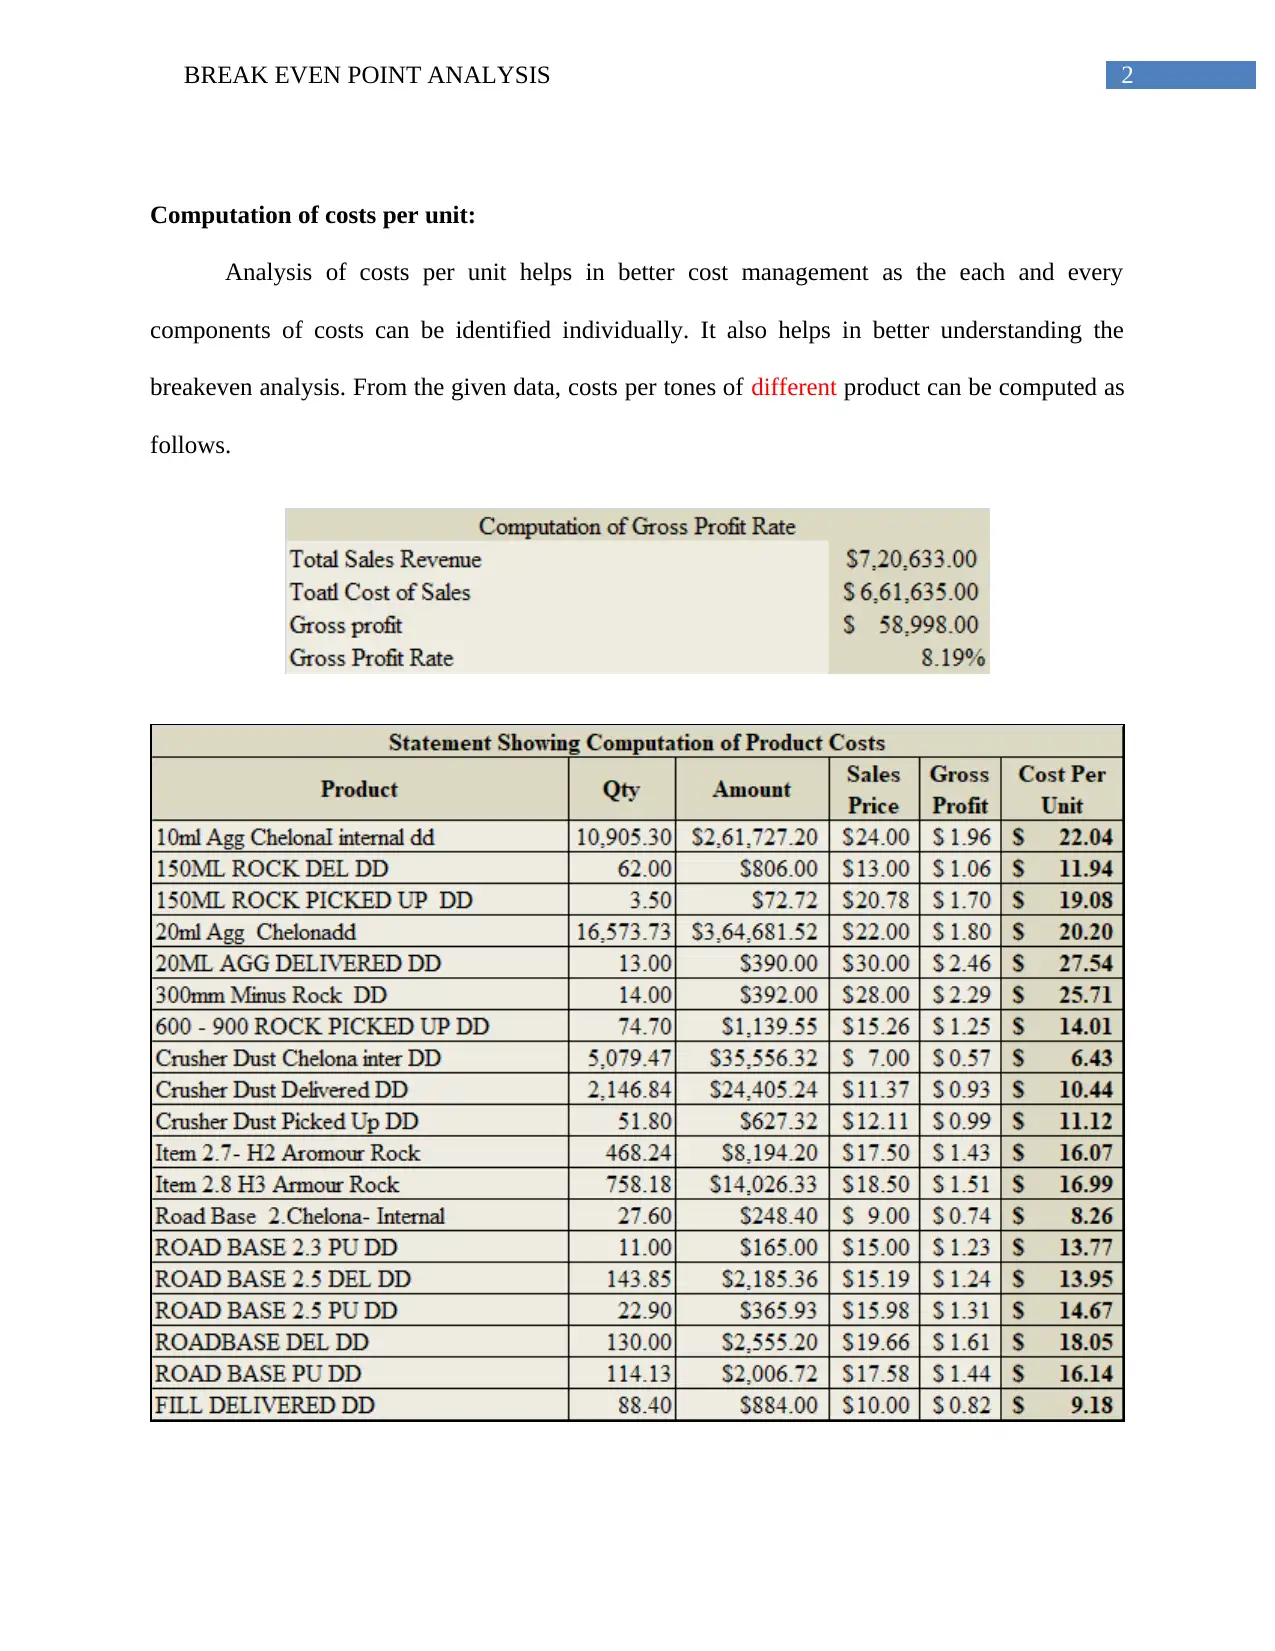
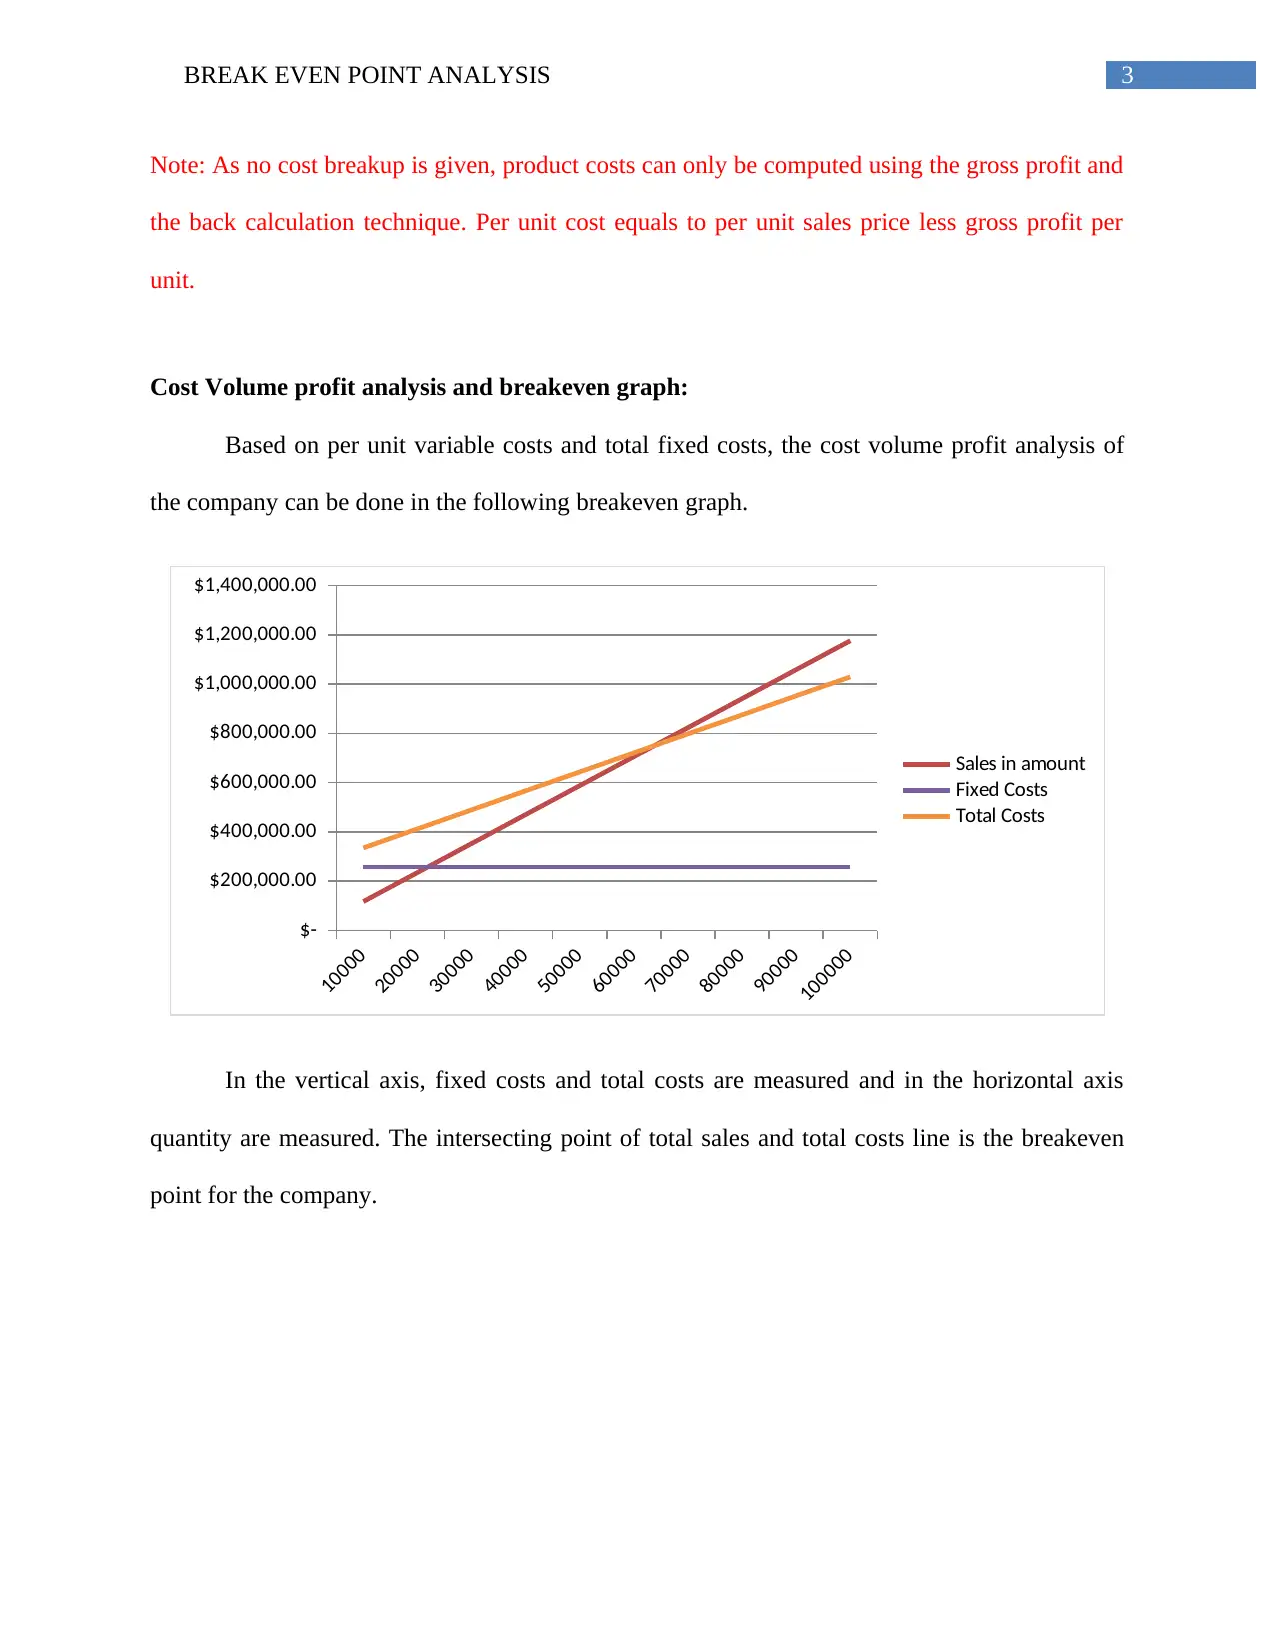
This report delves into break-even point analysis, crucial for understanding a company's financial health. It begins with a cost per unit analysis, essential for identifying and managing costs effectively. The report then moves on to cost-volume-profit analysis, presenting a break-even graph to visualize the relationship between costs, sales, and profit. The graph illustrates the intersection of total sales and total costs, marking the break-even point. The report also includes a bibliography with references to relevant academic sources. The report provides a clear understanding of financial concepts and their practical application in business decision-making. The report is a good example of how to analyze costs and determine the point at which a business starts to make a profit.
Document Page
Running head: BREAK EVEN POINT ANALYSIS
Break Even Point Analysis
Name of the Student:
Name of the University:
Author’s Note:
tabler-icon-diamond-filled.svg

Paraphrase This Document

Need a fresh take? Get an instant paraphrase of this document with our AI Paraphraser
Document Page
1BREAK EVEN POINT ANALYSIS
Table of Contents
Computation of costs per unit:.........................................................................................................2
Cost Volume profit analysis and breakeven graph:.........................................................................3
Bibliography:...................................................................................................................................4
Document Page
2BREAK EVEN POINT ANALYSIS
Computation of costs per unit:
Analysis of costs per unit helps in better cost management as the each and every
components of costs can be identified individually. It also helps in better understanding the
breakeven analysis. From the given data, costs per tones of different product can be computed as
follows.
Document Page
3BREAK EVEN POINT ANALYSIS
Note: As no cost breakup is given, product costs can only be computed using the gross profit and
the back calculation technique. Per unit cost equals to per unit sales price less gross profit per
unit.
Cost Volume profit analysis and breakeven graph:
Based on per unit variable costs and total fixed costs, the cost volume profit analysis of
the company can be done in the following breakeven graph.
10000
20000
30000
40000
50000
60000
70000
80000
90000
100000
$-
$200,000.00
$400,000.00
$600,000.00
$800,000.00
$1,000,000.00
$1,200,000.00
$1,400,000.00
Sales in amount
Fixed Costs
Total Costs
In the vertical axis, fixed costs and total costs are measured and in the horizontal axis
quantity are measured. The intersecting point of total sales and total costs line is the breakeven
point for the company.
tabler-icon-diamond-filled.svg

Paraphrase This Document

Need a fresh take? Get an instant paraphrase of this document with our AI Paraphraser
Document Page
4BREAK EVEN POINT ANALYSIS
Bibliography:
Ihemeje, J.C., Okereafor, G. and Ogungbangb, B.M., 2015. Cost-volume-profit analysis and
decision making in the manufacturing industries of Nigeria. Journal of International Business
Research and Marketing, 1(1), pp.7-15.
Kaplan, R.S. and Atkinson, A.A., 2015. Advanced management accounting. PHI Learning.
chevron_up_icon
1 out of 5
circle_padding
hide_on_mobile
zoom_out_icon
[object Object]