Break Even Analysis and Example: Finance Report, Semester 1
VerifiedAdded on 2020/03/16
|7
|1163
|456
Report
AI Summary
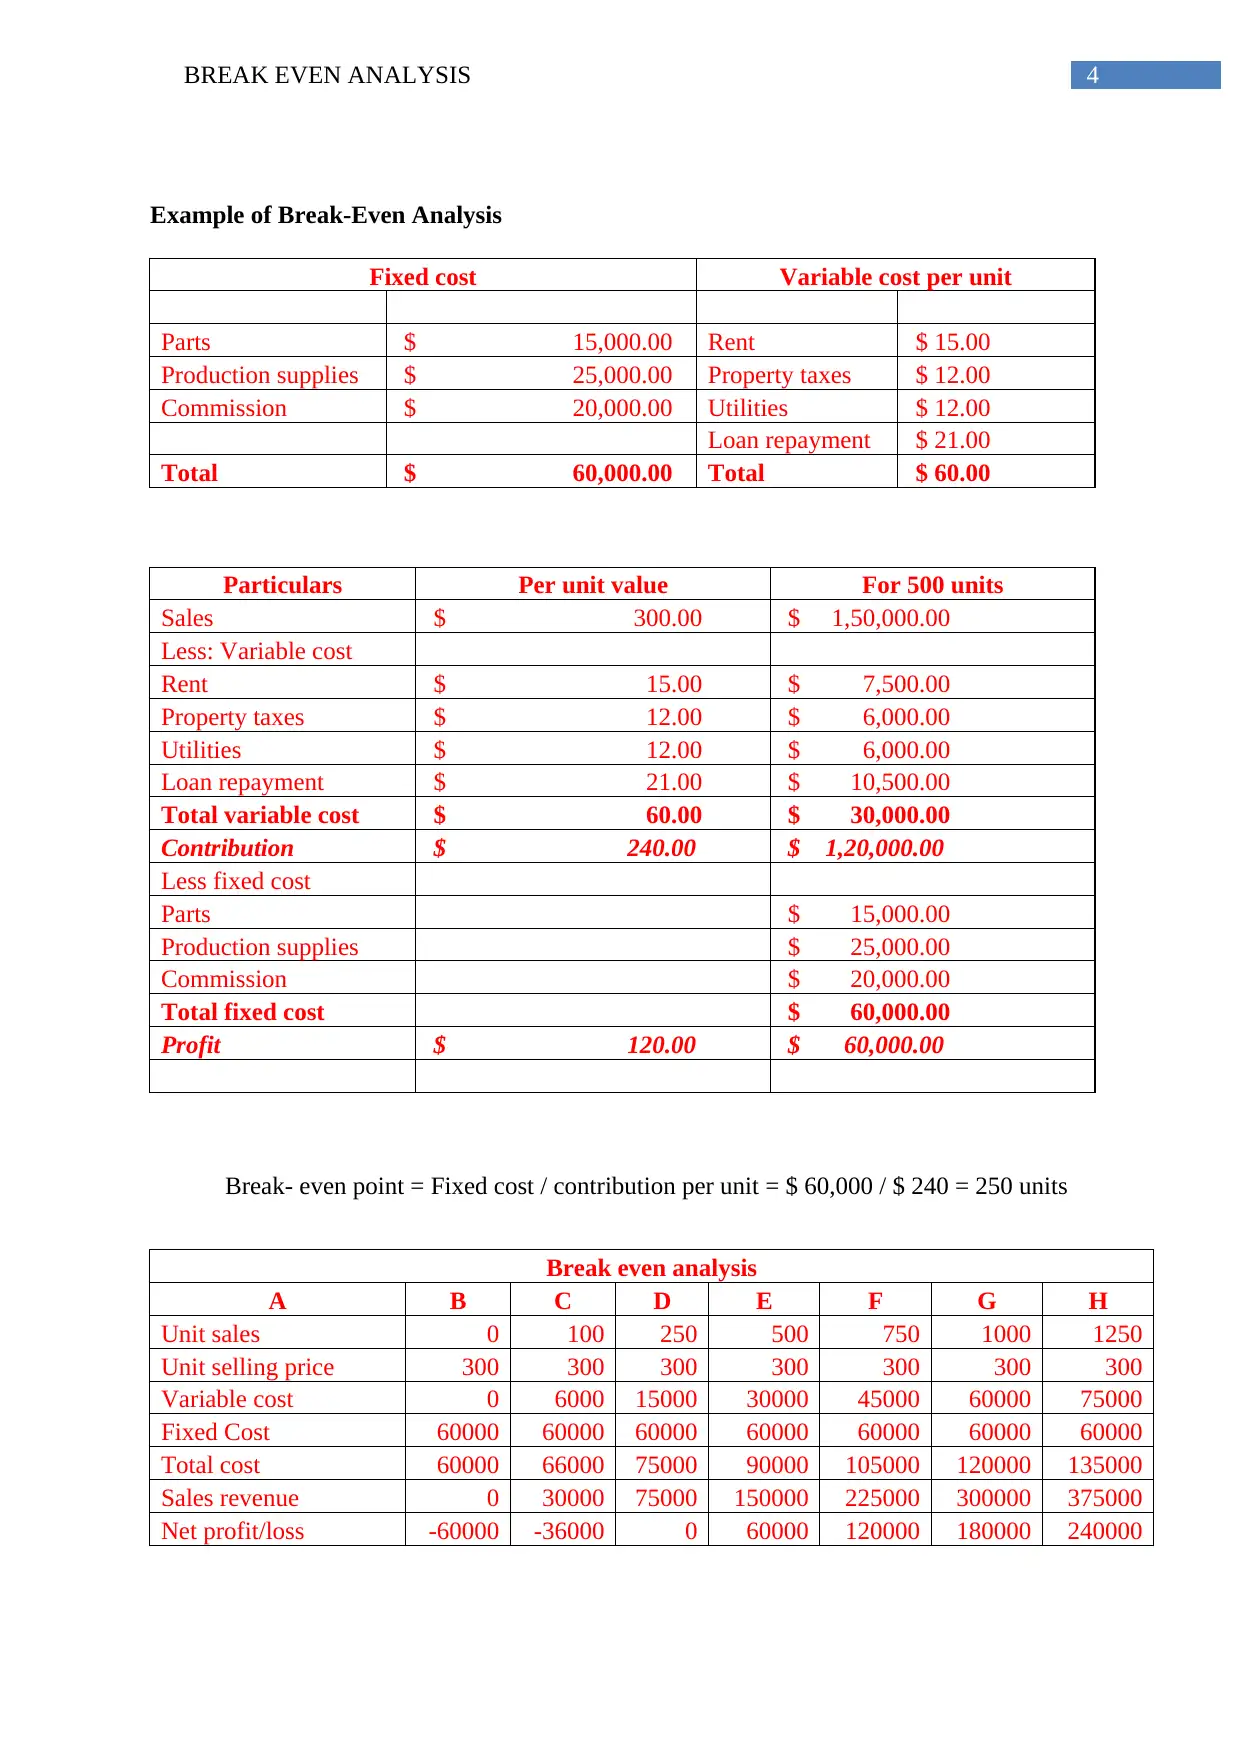
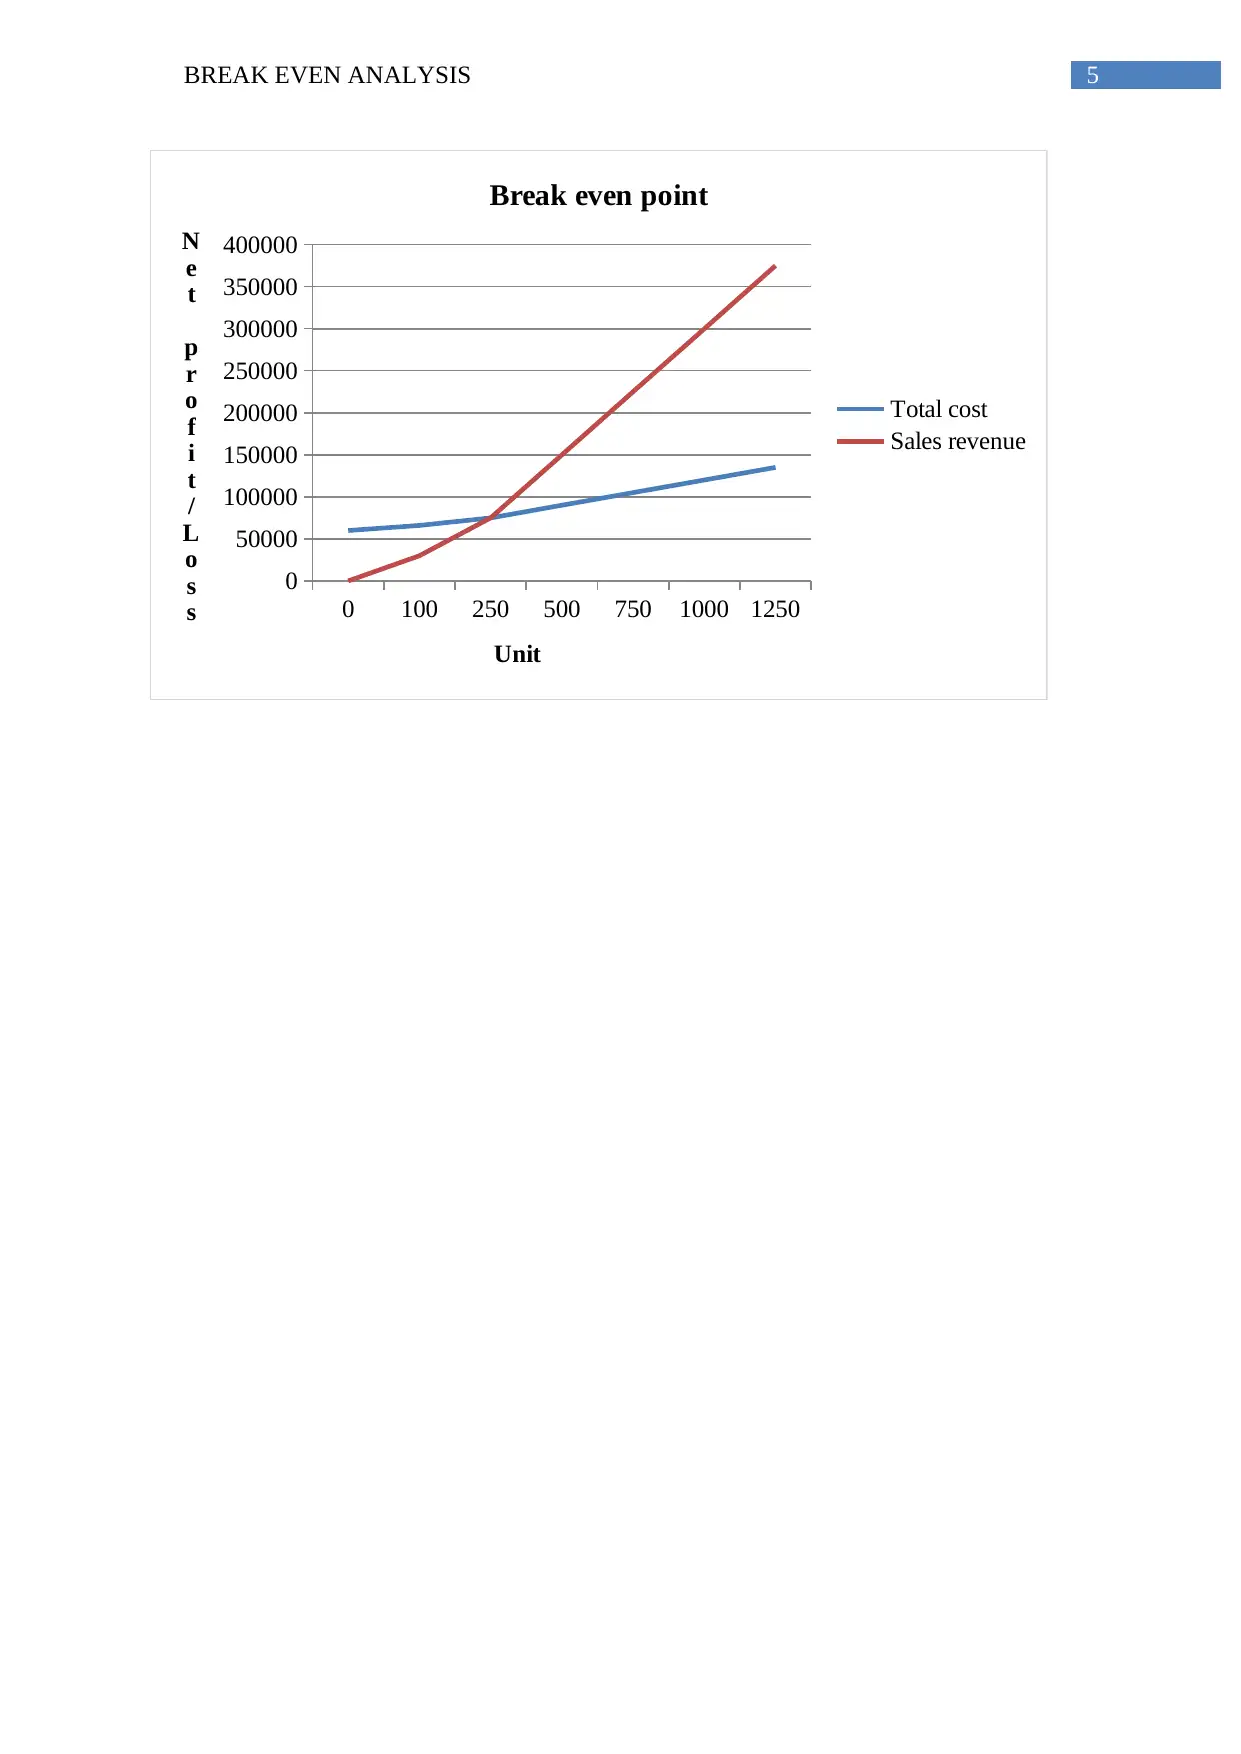
This report provides a detailed analysis of break-even analysis, a crucial concept in financial management. It begins by defining the break-even point (BEP) as the point where total costs equal total revenue, resulting in zero profit. The report outlines key assumptions underlying break-even analysis, including average sales per unit, average per-unit cost, and monthly fixed costs. It emphasizes the importance of break-even analysis in determining production levels and sales targets, while also highlighting its use in understanding a product's contribution margin. The report then presents two formulas for calculating break-even analysis, one based on dividing total fixed costs by the contribution margin per unit and another using the contribution margin ratio. A detailed example is included to illustrate these calculations, providing a clear understanding of how to determine the break-even point in units and in dollar sales. Finally, the report includes a comprehensive example of break-even analysis with a table showing how profit or loss changes with unit sales, and a list of references used.

1 out of 7
Related Documents


Your All-in-One AI-Powered Toolkit for Academic Success.
+13062052269
info@desklib.com
Available 24*7 on WhatsApp / Email
![[object Object]](/_next/static/media/star-bottom.7253800d.svg)
Copyright © 2020–2026 A2Z Services. All Rights Reserved. Developed and managed by ZUCOL.